MATLAB 绘制的二维离散数据图的类型
MATLAB是一种科学编程语言,提供了不同的表达信息的方式。其中之一就是 二维离散数据图 。在MATLAB中,我们可以创建几种不同类型的二维离散数据图来以图形方式表示数据和信息。
在本文中,我们将探讨MATLAB中不同类型的二维离散数据图,并讨论它们在MATLAB编程中的实现。所以,让我们从对MATLAB中二维离散数据图的基本介绍开始。
介绍二维离散数据图
在MATLAB中,二维离散数据图是以图形方式表示二维信息或数据点的一种方式。它允许绘制X轴和Y轴之间的数据图。正如其名称所示,它提供了一种绘制由不同个体数据点组成的离散数据的方法。离散数据图没有连续的数据图。
从可视化和数据分析的角度来看,二维离散数据图在数据方面具有重要意义。这是因为它们以图形形式表示数值数据,并允许理解数据中存在的关系和模式。因此,二维离散数据图使数据的分析和解释变得更加容易。
二维离散数据图的类型
以下是常用于MATLAB中以图形方式表示离散数据的一些重要的二维离散数据图:
- 线图 −它是用于表示离散数据的最基本的2D图形。它由一系列通过线段连接的数据点组成。
-
散点图 −也称为X-Y散点图。散点图是一种将个体数据点表示为标记的2D图形。
-
柱状图 −柱状图通过使用不同高度或长度的垂直或水平的矩形条来表示数据。这种类型的图形主要用于比较不同类别的数据。
-
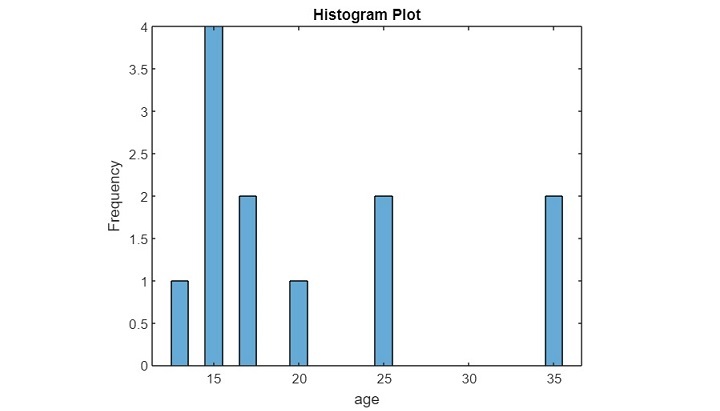
直方图 −直方图是在二维空间中表示离散数据的另一种方法。直方图用于通过将数据分成一组小区间来表示连续数据的分布情况。每个小区间表示落入其中的数据点数量。直方图广泛用于了解数据模式和数据分布中的偏差。
-
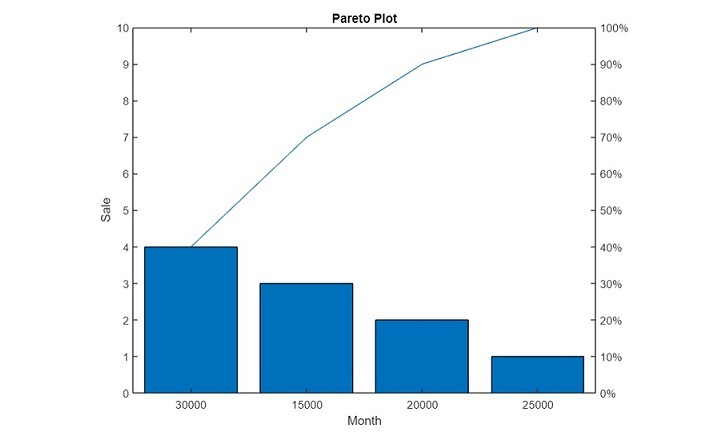
Pareto图 −这是一种使用垂直条形图表示数据集值的2D离散图。在这种数据图中,条形图按从左到右的顺序从大到小排列。除了条形图外,它还包括一个代表从左到右移动时数据值的累积贡献的曲线。
-
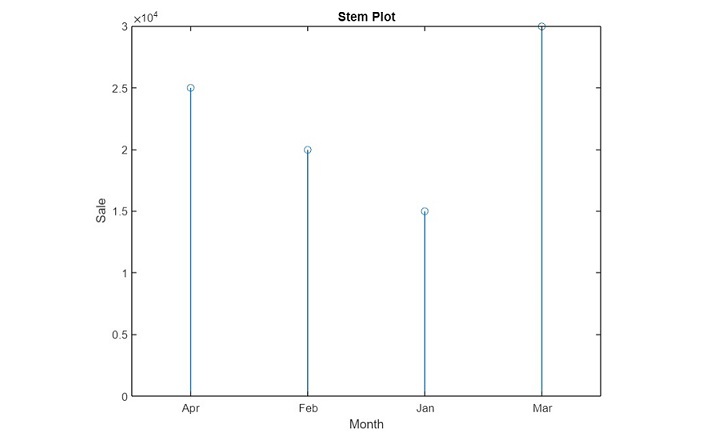
棒图 −在这种图形中,使用一条带有顶部气泡的直线表示数据。在这种图表中,从x轴开始并沿着y轴到达数据值的直线称为茎。茎图是可视化离散数据值的有效方式。
-
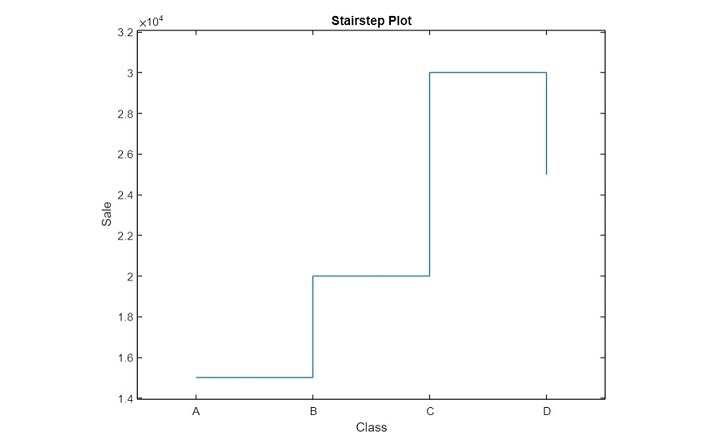
阶梯图 −这种类型的图形也称为阶跃图。它是一种用于将数据值表示为一系列连续步骤的2D离散数据图,使结构像一条楼梯。这种类型的图形主要用于可视化数据模式和分析突变变化。
-
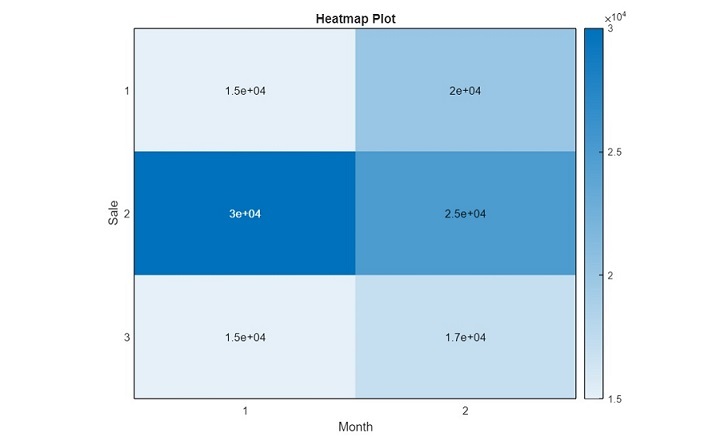
热图 −这是另一种2D离散数据图。热图用于以2D单元格网格的形式表示数据值,其中每个单元格根据其相应的数据值填充颜色。在这个图中,单元格的颜色强度表示单元格的值。这种类型的图形在图像处理、相关矩阵、地理空间分析等领域中有应用。
因此,这些是MATLAB中不同类型的2D离散数据图的全部内容。现在让我们通过示例程序来了解如何使用MATLAB编程创建它们。
示例
% MATLAB code for plotting 2D line graph
% Create a sample data
month = categorical({'Jan', 'Feb', 'Mar', 'Apr'});
sale = [15000, 20000, 30000, 25000];
% Plot the line chart
plot(month, sale);
% Create chart title and axis labels for better readability
title('Line Plot');
xlabel('Month');
ylabel('Sale');
输出
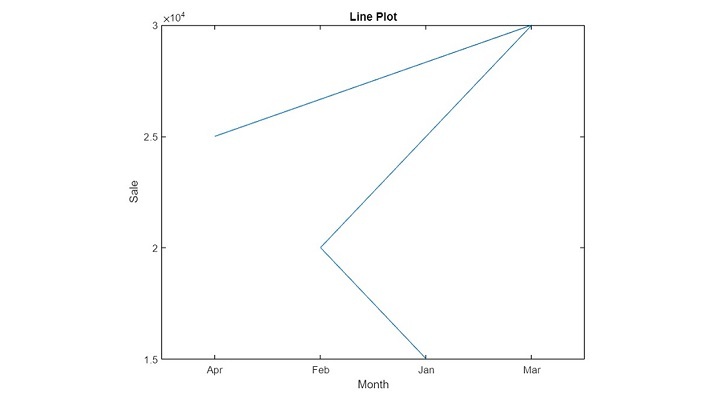
解释
在这个MATLAB代码中,我们首先定义了每月销售额的样本数据。然后,我们使用’plot’函数创建了一张折线图。同时,我们还添加了图表标题和轴标签,以便更好地阅读图表。
示例
% MATLAB code for plotting 2D scatter graph
% Create sample data
month = categorical({'Jan', 'Feb', 'Mar', 'Apr'});
sale = [15000, 20000, 30000, 25000];
% Plot the x-y scatter chart
scatter(month, sale);
% Create chart title and axis labels for better readability
title('Scatter Plot');
xlabel('Month');
ylabel('Sale');
输出
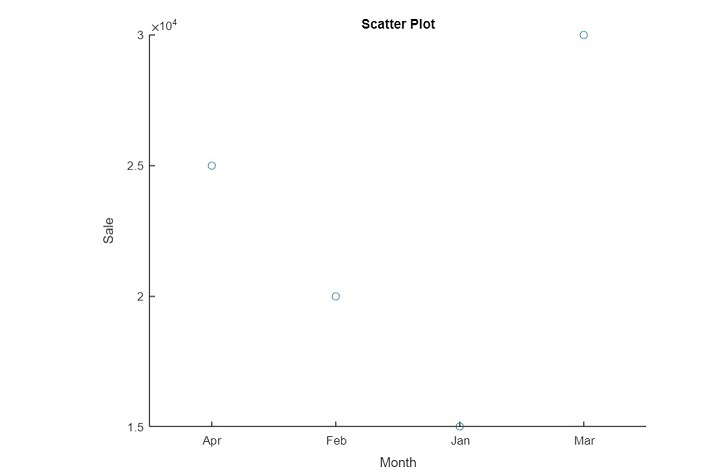
解释
在这段MATLAB代码中,我们使用了scatter函数创建了一个 xy 散点图。代码中的其他内容与 MATLAB 程序(1)相似。
示例
% MATLAB code for plotting 2D bar graph
% Create sample data
month = categorical({'Jan', 'Feb', 'Mar', 'Apr'});
sale = [15000, 20000, 30000, 25000];
% Plot the bar chart
bar(month, sale);
% Create chat title and axis labels for better readability
title('Bar Plot');
xlabel('Month');
ylabel('Sale');
输出
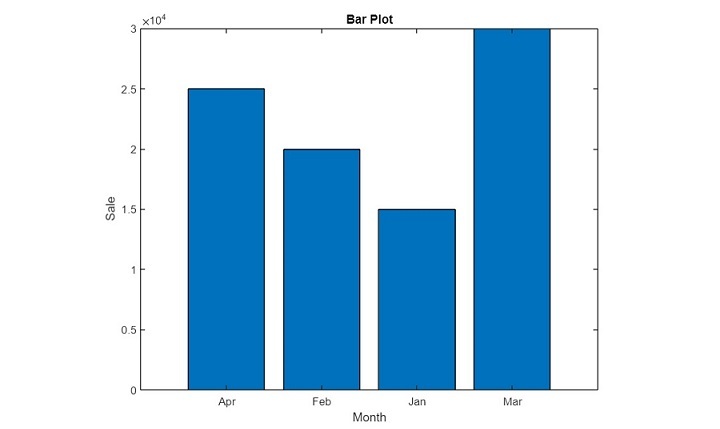
解释
在这个MATLAB代码中,我们使用了“bar”函数来创建一个柱状图。
示例
% MATLAB code for plotting 2D horizontal bar graph
% Create sample data
month = categorical({'Jan', 'Feb', 'Mar', 'Apr'});
sale = [15000, 20000, 30000, 25000];
% Plot the horizontal bar chart
barh(month, sale);
% Create chat title and axis labels for better readability
title('Horizontal Bar Plot');
xlabel('Sale');
ylabel('Month');
输出
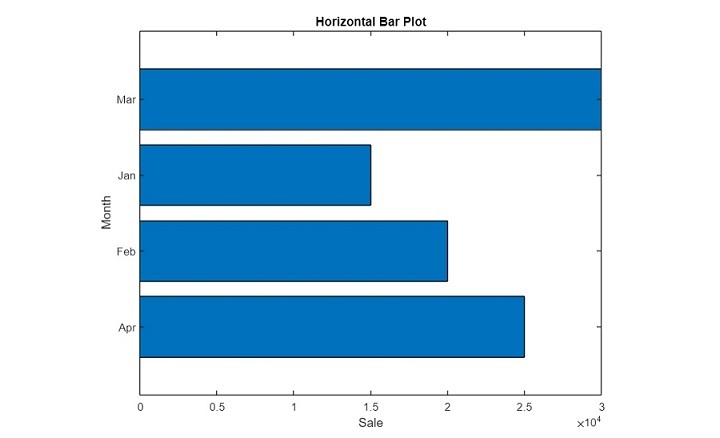
解释
在这段MATLAB代码中,我们使用‘barh’函数创建了一个水平柱状图。
示例
% MATLAB code for plotting 2D histogram graph
% Create sample data
age = [15 20 15 17 25 35 25 35 17 15 15 13];
% Plot the histogram chart
histogram(age);
% Create chat title and axis labels for better readability
title('Histogram Plot');
xlabel('age');
ylabel('Frequency');
输出
解释
在这个MATLAB代码中,我们首先创建一个年龄数组。然后,我们使用’histogram’函数创建它的直方图来显示每个年龄的频率。接下来,我们应用图表标题和坐标轴标签,以便更好地阅读图表。
示例
% MATLAB code for plotting pareto chart
% Create a sample data
month = categorical({'Jan', 'Feb', 'Mar', 'Apr'});
sale = [15000, 20000, 30000, 25000];
% Plot the pareto chart
pareto(month, sale);
% Apply chart title and axis labels
title('Pareto Plot');
xlabel('Month');
ylabel('Sale');
输出
解释
在这段MATLAB代码中,我们首先创建了一个名为’month’和’sale’的示例数据。然后,我们使用’pareto’函数创建它的帕累托图。接下来,我们创建了图表的标题和坐标轴标签,以便更好地阅读图表。
示例
% MATLAB code for plotting stem chart
% Create a sample data
month = categorical({'Jan', 'Feb', 'Mar', 'Apr'});
sale = [15000, 20000, 30000, 25000];
% Plot the stem chart
stem(month, sale);
% Apply chart title and axis labels
title('Stem Plot');
xlabel('Month');
ylabel('Sale');
输出
解释
在这个MATLAB代码中,我们首先创建一个示例数据’month’和’sale’。然后,我们使用’stem’函数创建其柱状图。接下来,我们为了更好地可读性,给图表添加了标题和坐标轴标签。
示例
% MATLAB code for plotting stairstep chart
% Create a sample data
class = categorical({'A', 'B', 'C', 'D'});
sale = [15000, 20000, 30000, 25000];
% Plot the stairstep chart
stairs(class, sale);
% Apply chart title and axis labels
title('Stairstep Plot');
xlabel('Class');
ylabel('Sale');
输出
解释
在这段MATLAB代码中,我们首先创建了一个名为’class’和’sale’的样本数据。然后,我们使用’stairs’函数创建了它的stairstep图。接下来,我们应用图表标题和轴标签,以使绘图更易读。
示例
% MATLAB code for plotting heatmap chart
% Create a sample data
sale = [15000, 20000; 30000, 25000; 15000, 17000];
% Plot the heatmap chart
heatmap(sale);
% Apply chart title and axis labels
title('Heatmap Plot');
xlabel('Month');
ylabel('Sale');
输出
解释
在这个MATLAB代码中,我们首先创建一个名为’sale’的样本数据作为一个表格。然后,我们使用’heatmap’函数创建它的热图。接着,我们为了更好地阅读图表,应用图表标题和坐标轴标签。
结论
因此,关于MATLAB中的2D离散数据图和它们的类型就是这些。MATLAB提供了各种内置函数来创建不同类型的2D离散数据图,用于数据点的图形表示。在本文章的上述部分,我们讨论了各种类型的2D离散数据图,并使用MATLAB程序进行了说明。
 极客笔记
极客笔记