MATLAB 如何计算给定数字图像中的圆的数量
在本文中,我们将学习如何使用MATLAB代码来计算数字图像中圆的数量。通过使用各种图像处理技术如图像腐蚀、圆检测等来计算图像中的圆的数量。
以下是在MATLAB中计算数字图像中圆的数量的逐步过程的解释:
第一步: − 读取输入图像。
第二步: − 如有必要,将输入图像转换为灰度图像。
第三步: − 创建一个特定大小的圆形或圆盘形状的结构元素,用于对图像进行腐蚀。
第四步: − 使用圆形结构元素对灰度图像进行腐蚀,以将圆形从图像中分离出来。
第五步: − 通过连通性成分分析为连接的区域应用标签。
第六步: − 确定唯一的组件标签。
第七步: − 计算图像中的圆的数量。
第八步: − 显示腐蚀后的图像和连接的成分地图(标签地图),以及图像中找到的圆的数量。
现在,让我们了解使用MATLAB计算给定数字图像中圆的数量的算法的实现。
下面的MATLAB程序演示了按照上述算法来计算数字图像中圆的数量的代码实现。
示例
%MATLAB code to count number of circles in a digital image
% Read the input image
in_img = imread('https://solarianprogrammer.com/images/2015/05/08/circles.jpg');

% Convert the input image to grayscale image, if necessary
gray_img= rgb2gray(in_img);

% Create a circular structuring element for image erosion
r = 10; % Radius of the circular structuring element
structuring_element = strel('disk', r, 0);

% Perform erosion of the grayscale image
erd_img = imerode(gray_img, structuring_element);

% Apply labels to the connected components
con_comp = bwlabel(erd_img, 8);

% Determine the unique component labels
unique_labels = unique(con_comp);

% Count the number of circles in the image
circles = numel(unique_labels) - 1;

% Display the eroded image and the connected component map
figure;
subplot(1, 3, 1); imshow(in_img); title('Input Image');
subplot(1, 3, 2); imshow(erd_img); title('Eroded Image');
subplot(1, 3, 3); imshow(con_comp, []); title('Connected Component Map');

% Show the number of circles in the image
disp('Number of circles found is:');
disp(circles);
输出
Number of circles found is:
     1
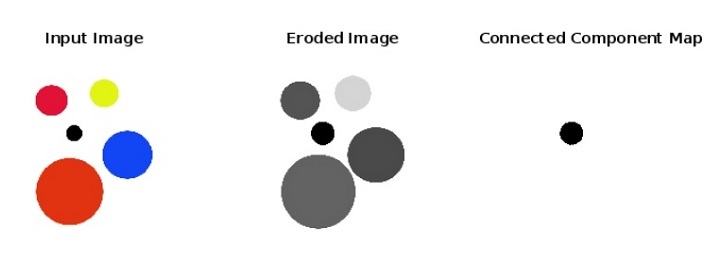
图像输出

代码解释
此 MATLAB 程序展示了如何在给定的数字图像中计算圆的数量的代码实现。在这段代码中,我们首先使用 ‘imread’ 函数读取输入图像,并将其存储在变量 ‘in_img’ 中。然后,如果输入图像不是灰度图像,则将其转换为灰度图像,并将其存储在变量 ‘gray_img’ 中。
接下来,我们定义一个特定半径的圆形或圆盘形的结构元素 ‘structuring_element’,用于对图像进行腐蚀。然后,我们使用 ‘imerode’ 函数根据结构元素对图像进行腐蚀,并将结果存储在变量 ‘erd_img’ 中。然后,我们标记连接的组件并找到唯一的组件标签。接下来,我们计算图像中圆的数量。
最后,我们使用 ‘disp’ 函数显示圆的数量、原始图像、腐蚀图像和连接的组件图。
结论
因此,这就是使用 MATLAB 编程来计算给定数字图像中圆的数量的全部内容。MATLAB 提供了各种图像处理技术来计算图像中圆的数量。在本文中,我们解释了使用图像腐蚀的最简单的技术来计算圆的数量。请尝试使用自己的图像运行以上 MATLAB 代码。
 极客笔记
极客笔记