seaborn 如何从图形中删除轴脊柱
轴脊柱,也称为轴线,是定义图形坐标系边界的线条。在二维图形中,通常有四条轴脊柱,包括顶部、底部、左侧和右侧。这些脊柱为图形创建了框架,并作为数据点的参考线。
每个脊柱代表图形的四个边。顶部脊柱横跨顶部,底部脊柱横跨底部,左侧脊柱沿左侧垂直,右侧脊柱沿右侧垂直。
轴脊柱为数据点提供了视觉参考,并有助于解释图形。它们还可以根据可见性、线条样式、线宽和颜色进行自定义,以增强整体外观并强调图形的特定方面。
从图形中删除轴脊柱
删除或修改轴脊柱可用于美学目的,或者当我们想要强调图形的某些特征时,例如删除不必要的杂乱或将注意力集中在数据本身上。
要从使用Seaborn创建的图形中删除轴脊柱,我们可以利用matplotlib库,这是Seaborn库的基础。Matplotlib提供了各种自定义选项,包括修改轴脊柱外观的能力。
以下是逐步指南,介绍了如何从Seaborn图形中删除轴脊柱。
导入所需的库
首先,我们必须导入所有必要的库来绘制数据。
import seaborn as sns
import matplotlib.pyplot as plt
创建一个Seaborn图
现在我们需要使用Seaborn库和Matplotlib创建一个带有坐标轴刻度的数据样本图。
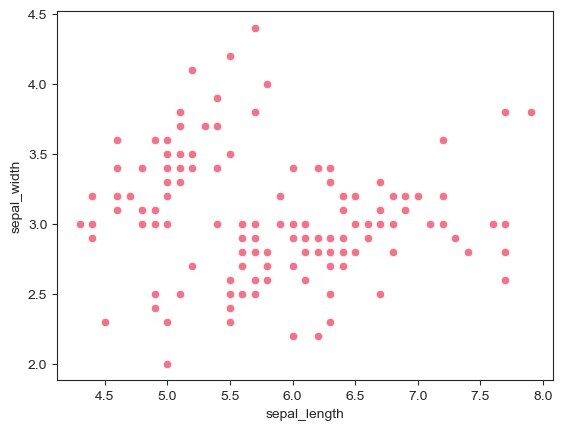
在这里,我们使用Seaborn库中可用的Iris数据集,并使用scatterplot()函数绘制 sepal_length 和 sepal_width 两列的散点图。
示例
import seaborn as sns
import matplotlib.pyplot as plt

# Generate some example data
data = sns.load_dataset("iris")
# Create a Seaborn plot
sns.scatterplot(x="sepal_length", y="sepal_width", data=data)
plt.show()
输出

访问轴对象
要获取当前轴对象,我们将使用matplotlib库的函数 gca() 。
# Get the current axes object
ax = plt.gca()
移除所需的脊柱
获取坐标轴的脊柱后,我们现在根据需求和使用情况用True和False设置脊柱的可见性。如果定义为True,则坐标轴的脊柱将可见,否则将被移除。
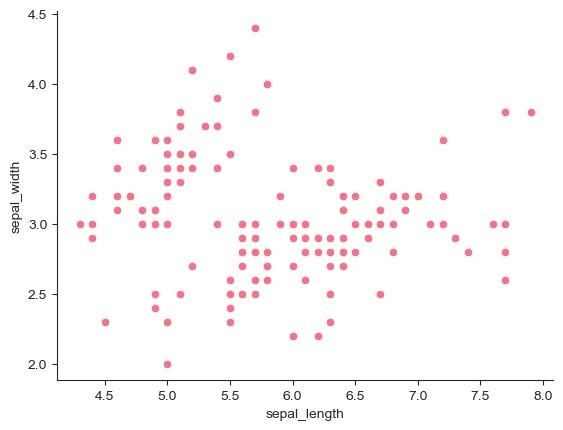
现在我们通过将它们设置为False来移除坐标轴的上方和右边的脊柱。
示例
import seaborn as sns
import matplotlib.pyplot as plt

# Generate some example data
data = sns.load_dataset("iris")
# Create a Seaborn plot
sns.scatterplot(x="sepal_length", y="sepal_width", data=data)

# Get the current axes object
ax = plt.gca()

# Remove the top and right spines
ax.spines["top"].set_visible(False)
ax.spines["right"].set_visible(False)

plt.show()
输出

自定义剩余的脊柱
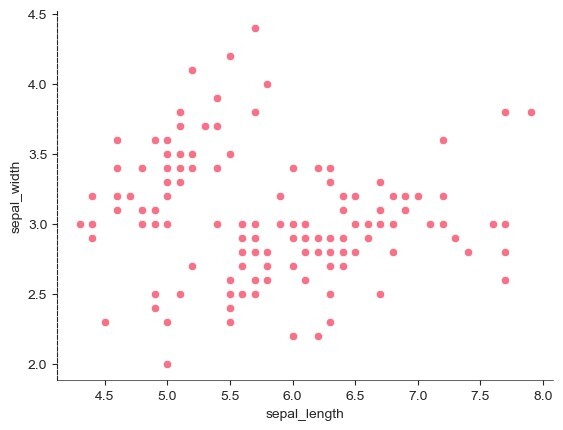
在这一步中,我们通过设置线宽和线型来自定义剩余的坐标轴脊柱的底部和左侧。
示例
import seaborn as sns
import matplotlib.pyplot as plt

# Generate some example data
data = sns.load_dataset("iris")
# Create a Seaborn plot
sns.scatterplot(x="sepal_length", y="sepal_width", data=data)

# Get the current axes object
ax = plt.gca()

# Customize the appearance of the remaining spines
ax.spines["bottom"].set_linewidth(0.5)  # Set the linewidth of the bottom spine
ax.spines["left"].set_linestyle("--")  # Set the linestyle of the left spine

plt.show()
输出

注意 −
脊椎的特定定制选项,如线宽、线型、颜色等,可以根据我们的要求进行调整。
 极客笔记
极客笔记