如何使用Bokeh在Python中制作面积图
Bokeh是Python的交互式数据可视化库,它使用HTML和JavaScript语言创建图表。其基本目标是现代网页浏览器,以提供优雅、简洁的图形和高性能交互性。
在本教程中,我们将学习如何使用Bokeh库在图表上创建一个区域图。
绘制区域图
区域图可以定义为共享一个公共区域的两个系列之间的填充区域。Bokeh的figure类有两个函数,分别是:
- varea()
- harea()
1. varea()函数
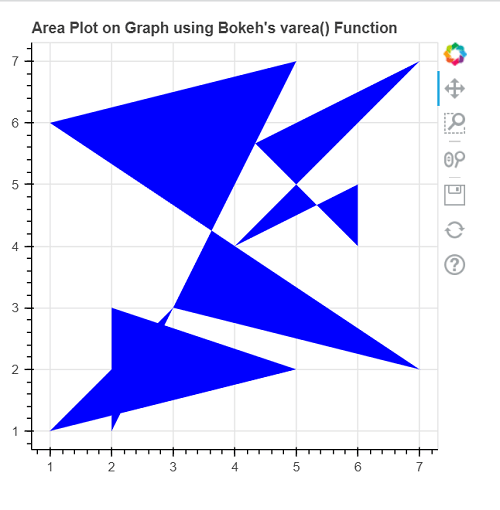
varea()函数用于垂直方向的区域。它有一个”X”坐标数组和两个”Y”坐标数组,”Y1″和”Y2″,这两个数组之间会被填充。
语法:
varea()函数的语法如下:
varea(x, y1, y2, **kwargs)
参数:
varea() 函数接受以下参数:
- x: 这是区域图的点的“x坐标”。
- y1: 这是区域图一侧的点的“y坐标”。
- y2: 这是区域图另一侧的点的“y坐标”。
代码:
# First, we will import all the required libraries

import numpy as nmp
from bokeh.plotting import figure as fig
from bokeh.plotting import output_file as OF
from bokeh.plotting import show

x_1 = [2, 5, 1, 7, 3, 4, 6]
Y_1 = [1, 7, 6, 2, 3, 4, 5]
Y_2 = [3, 2, 1, 7, 5, 6, 4]

# here, we will create an Output file for saving the Output
OF("JavaTpoint.html")
# Now, we will instantiate the figure object

PLOT1 = fig(plot_width = 400, plot_height = 400, title = "Area Plot on Graph using Bokeh's varea() Function")

# Creating the area plot
PLOT1.varea(x = x_1, y1 = Y_1, y2 = Y_2, fill_color = "BLUE")
# Displaying the Plot
show(PLOT1)
输出:

2. harea()函数
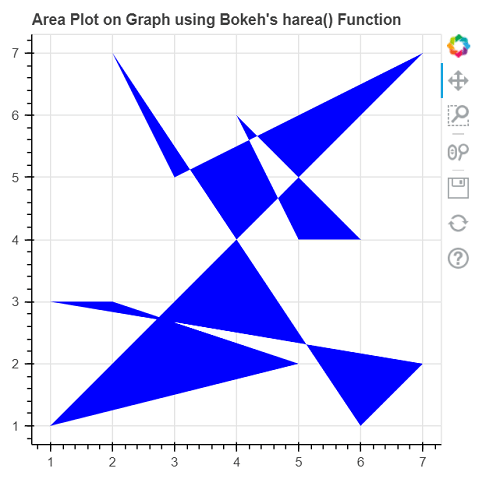
Bokeh库的harea()函数用于绘制沿水平方向的区域。
它有一个”Y”坐标数组和两个”X”坐标数组:”X1″和”X2″,之间会被填充。
语法:
harea()函数的语法为:
harea(x1, x2, y, **kwargs)
参数:
harea()函数接受以下参数:
- x1: 这是面积图一侧点的”x坐标”。
- x2: 这是面积图另一侧点的”x坐标”。
- y: 这是面积图上点的”y坐标”。
代码:
# First, we will import all the required libraries

import numpy as nmp
from bokeh.plotting import figure as fig
from bokeh.plotting import output_file as OF
from bokeh.plotting import show

x_1 = [2, 5, 1, 7, 3, 4, 6]
x_2 = [1, 7, 6, 2, 3, 4, 5]
Y_1 = [3, 2, 1, 7, 5, 6, 4]

# here, we will create an Output file for saving the Output
OF("JavaTpoint.html")
# Now, we will instantiate the figure object

PLOT1 = fig(plot_width = 400, plot_height = 400, title = "Area Plot on Graph using Bokeh's harea() Function")

# Creating the area plot
PLOT1.harea(x1 = x_1, x2 = x_2, y = Y_1, fill_color = "BLUE")
# Displaying the Plot
show(PLOT1)
输出:

结论
在本教程中,我们讨论了如何使用Python中的bokeh库的varea()和harea()函数创建垂直和水平方向的面积图。
 极客笔记
极客笔记