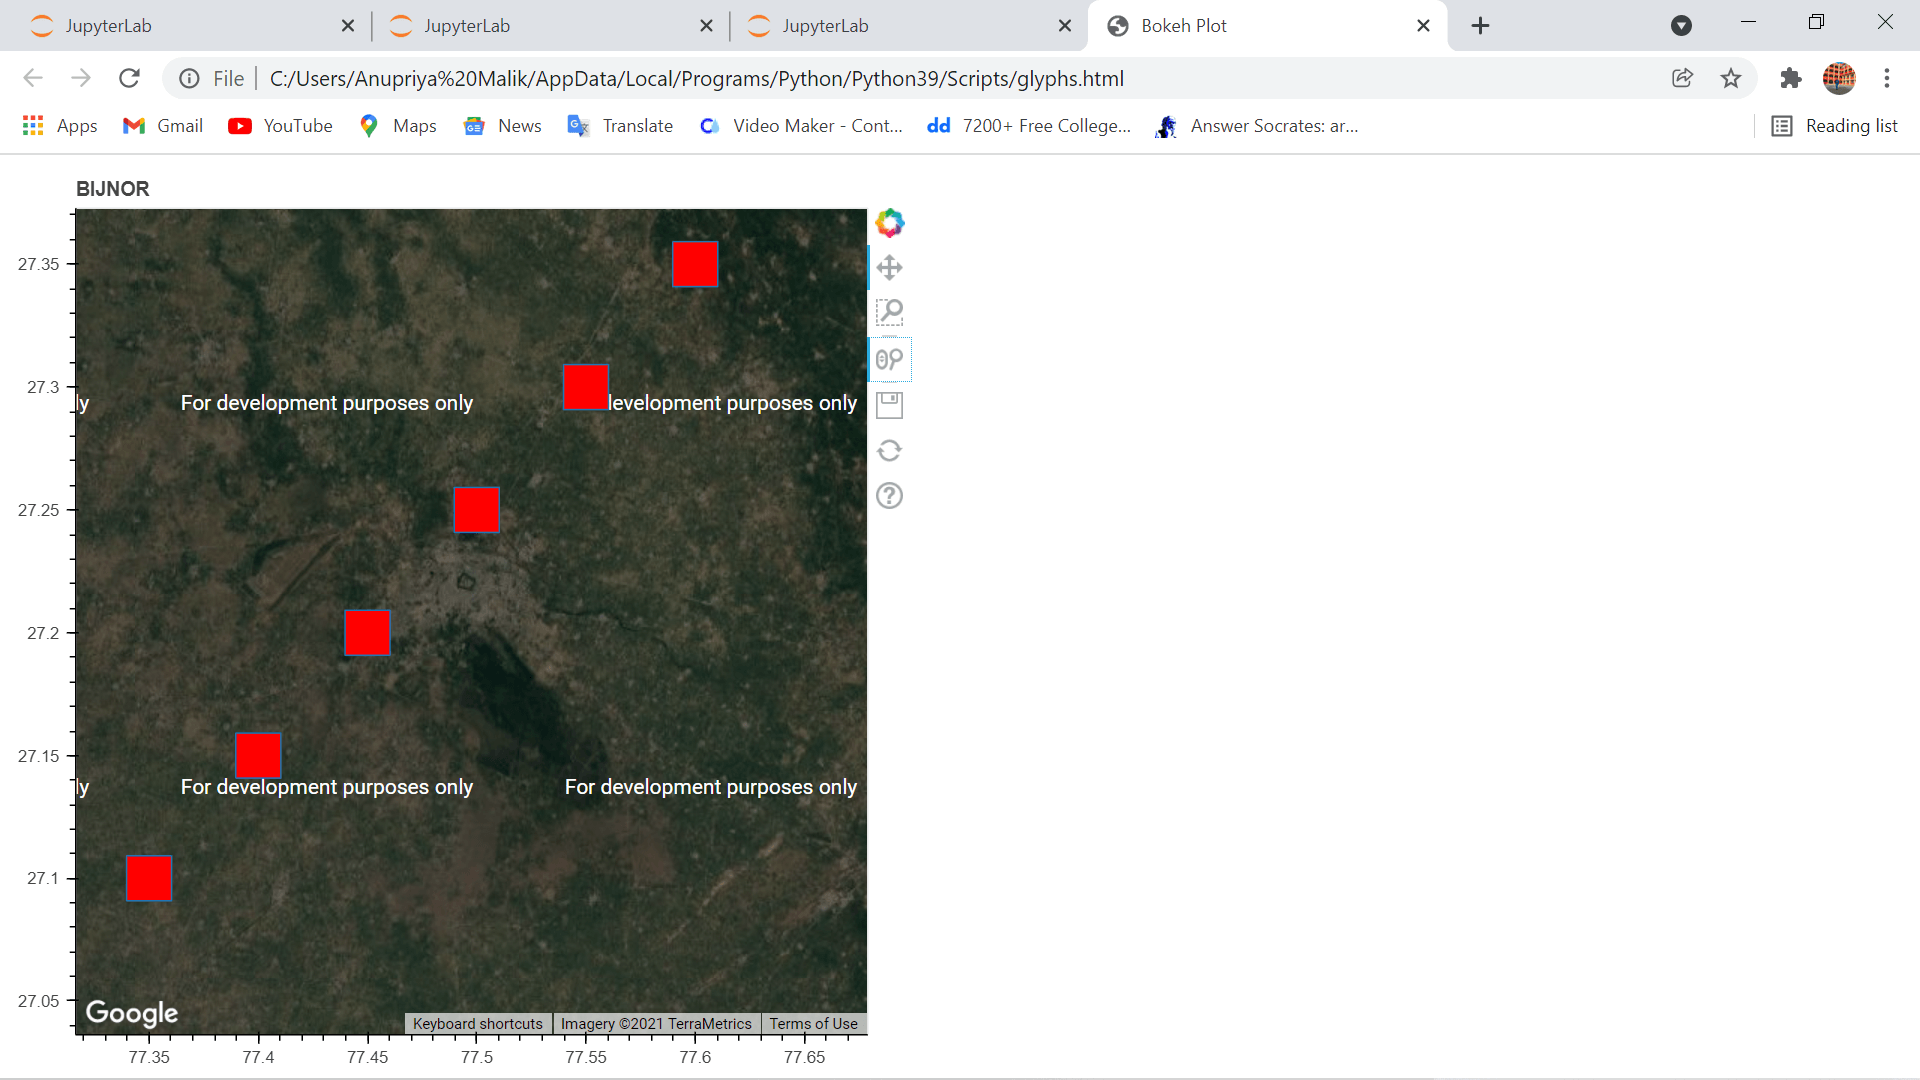
如何在Python中使用Bokeh库在Google地图上绘制图形符号
Bokeh是Python的交互式数据可视化库。它使用HTML和JavaScript语言创建图形。其基本目标是在现代网页浏览器中呈现提供的优雅和简洁的新图形,具有高性能的互动性。
Bokeh库用于在Google地图上绘制图形符号。图形符号是一种象形文字符号或字符。要在Bokeh中使用Google地图,我们可以使用bokeh.plotting类的gmap()函数。
gmap()
语法:
gmap(parameter)
参数:
- google_api_key: Google API的密钥
- map_options: GMapOptions,即特定于Google地图的配置
- active_drag: 初始状态下为活动的拖动工具
- active_inspect: 初始状态下为活动的检查工具
- active_scroll: 初始状态下为活动的滚动工具
- active_tap: 初始状态下为活动的点击工具
- title: Google地图的标题
- tools: 绘图应该开始的工具
- x_axis_label: 用于标记x轴的标签
- x_axis_location: x轴的位置
- x_minor_ticks :相邻x轴主要刻度之间的次要刻度数目
- y _axis_label: 用于标记y轴的标签
- y_axis_location: y轴的位置
- y_minor_ticks: 相邻y轴主要刻度之间的次要刻度数目
返回值:
它将返回一个GMap类的对象
GMapOptions()
语法:
GMapOptions(parameters)
参数:
- lat: 用于设定Google地图的纬度中心点。
- lng: 用于设定Google地图的经度中心点。
- map_type: 定义用于绘制的Google地图类型。有以下四种可用的地图类型:
- -Hybrid
- -Roadmap
- -Satellite
- -Terrain
- name: 指定Google地图的名称。
- scale_control: 定义Google地图是否显示其距离刻度控制。
- styles: 用于定义用于绘制地图的样式。
- subscribed_events: 用于定义由Python回调订阅的事件列表。
- tags: 与Google地图模型关联的标签。
- tilt: 用于倾斜地图的角度。
- zoom: Google地图的初始缩放级别。
- apply_theme: 模型的主题。
返回值:
返回一个GMapOptions类的对象。
在Google地图上绘制图形的步骤:
步骤1: 导入以下模块和库:
- gmap from bokeh.plotting
- ColumnDataSource from bokeh.models
- GmapOptions from bokeh.models
- output_file from bokeh.io
- show from bokeh.io
步骤2: 使用 output_file() 创建一个文件来存储模型。
步骤3: 使用 GMapOptions() 配置Google地图。
步骤4: 使用 gmap() 生成一个Google地图对象。
步骤5: 使用 ColumnDataSource() 定义图形的坐标。
第6步: 在上面创建的Google Maps对象上绘制图形。
步骤7: 使用 show() 显示Google Maps的输出。
代码:
# First, import the required modules
from bokeh.plotting import gmap as GM
from bokeh.models import ColumnDataSource as CDS
from bokeh.models import GMapOptions as GMO
from bokeh.io import output_file as OF
from bokeh.io import show

# first, we will create a file for saving the model
OF("glyphs.html")

# here, we will configure the Google map
latitude = 27.2046
longitude = 77.4977
map_type1 = "satellite"
zoom1 = 15
google_map_options1 = GMO(lat = latitude,
                                 lng = longitude,
                                 map_type = map_type1,
                                 zoom = zoom1)

# Here, we will generate the Google map
google_api_key = ""
title1 = "BIJNOR"
google_map1 = GM(google_api_key,
                  google_map_options1,
                  title = title1)

# Here, we will define the coordinates of the glyphs
source1 = CDS(
    data = dict(latitude = [27.00, 27.10, 27.15, 27.20, 27.25, 27.30, 27.35],
                longitude = [77.30, 77.35, 77.40, 77.45, 77.50, 77.55, 77.60]))

# here, we will generate the glyphs over the Google map
x1 = "longitude"
y1 = "latitude"
size1 = 30
fill_color1 = "red"
fill_alpha1 = 1
google_map1.square(x = x1,
                  y = y1,
                  size = size1,
                  fill_color = fill_color1,
                  fill_alpha = fill_alpha1,
                  source = source1)

# At last, we will display the model
show(google_map1)
输出:

结论
在本教程中,我们讨论了如何使用Python中的Bokeh库在Google地图上绘制图形。
 极客笔记
极客笔记