如何使用Bokeh在Python中绘制光线图
Bokeh是一个用于数据可视化的Python库。它使用HTML和JavaScript语言创建图形,并且还针对现代网页浏览器提供了漂亮、简洁和高性能的交互性。
在本教程中,我们将学习如何在图中绘制光线。要在图中绘制光线,我们可以使用bokeh.plotting模块的ray()函数。
plotting.figure.ray()
语法:
ray()函数的语法是:
ray(parameters)
参数:
ray()函数的参数如下:
- x: 它接受光线起点的x坐标值。
- y: 它接受光线起点的y坐标值。
- length: 它接受光线长度的值作为输入。
- length_units: 它接受光线长度的单位。
返回值:
ray()函数的返回值如下:
一个GlyphRenderer类的对象
示例1:
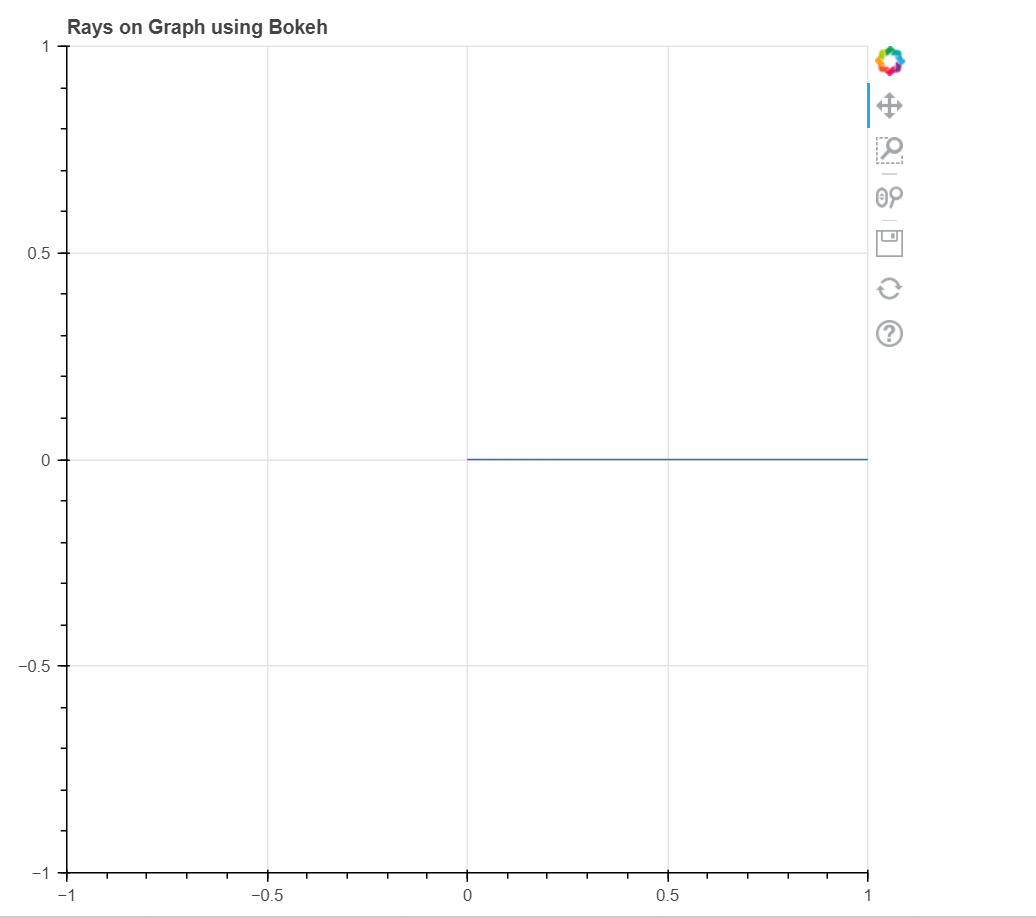
在此示例中,我们将使用默认值来绘制图形。
代码:
# First, we will import all the required modules
import numpy as nmp
from bokeh.plotting import figure as fig
from bokeh.plotting import output_file as OF
from bokeh.plotting import show

# Here, we will create a file for saving the model
OF("javaTpoint.html")

# Now, we will instantiate the figure object
graph_1 = fig(title = "Rays on Graph using Bokeh")

# the points to be plotted
x = 0
y = 0

# Here, we will plot the graph
graph_1.ray(x, y)

# To display the model
show(graph_1)
输出:

示例2:
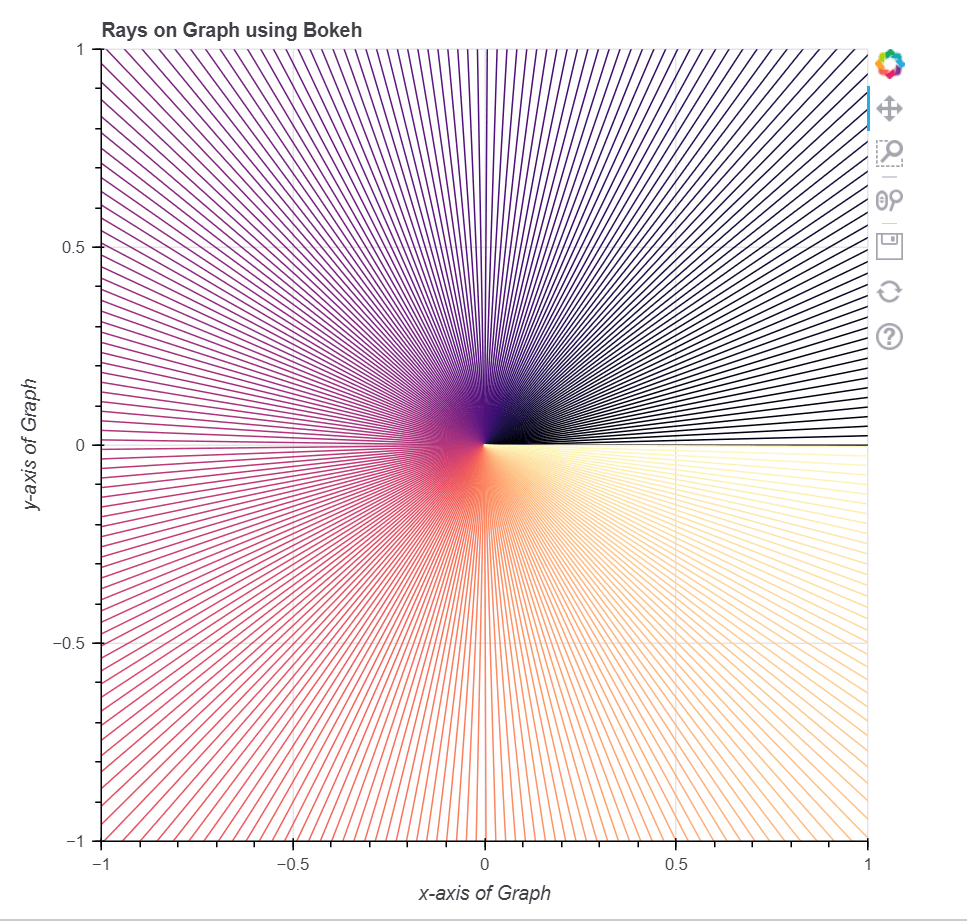
在这个示例中,我们将绘制具有各种其他参数的多个射线。
代码:
# First, we will import all the required modules
import numpy as nmp
from bokeh.plotting import figure as fig
from bokeh.plotting import output_file as OF
from bokeh.plotting import show
from bokeh.palettes import magma as MG


# Here, we will create a file for saving the model
OF("javaTpoint.html")

# Now, we will instantiate the figure object
graph_1 = fig(title = "Rays on Graph using Bokeh")

# Name of the x-axis
graph_1.xaxis.axis_label = "x-axis of Graph"

# Name of the y-axis
graph_1.yaxis.axis_label = "y-axis of Graph"

# The points to be plotted
x = [0] * 254
y = [0] * 254

# Now, we will instantiate angles of the rays
angle = nmp.linspace(0.00, 6.28, num = 254).tolist()

# color of the rays
color = MG(254)

# Here, we will plot the graph
graph_1.ray(x, y,
          angle = angle,
          color = color)

# To display the model
show(graph_1)
输出:

结论
在本教程中,我们讨论了如何使用Python的bokeh库在图表上绘制射线。
 极客笔记
极客笔记