bokeh.plotting.figure.circle_x()函数用法
Bokeh是Python的一个库,用于通过绘制图形和图表来进行数据可视化。可以在不同的平台上获取输出,例如Notebook、HTML、JavaScript和浏览器。Figure类用于在图形上创建一个新的图形,并且是bokeh.plotting的子类,可以简化图形的创建过程,包括默认的坐标轴、网格、工具等。
bokeh.plotting.figure.circle_x()函数
我们可以使用bokeh库的bokeh.plotting模块中的circle_x()方法来配置和添加圆形x标记到这个图形中。
语法:
circle_x()函数的语法为:
circle_x(x, y, size = 4, angle = 0.0, *, angle_units = 'rad', fill_alpha = 1.0, fill_color = 'gray', line_alpha = 1.0, line_cap = 'butt', line_color = 'black', line_dash = [], line_dash_offset = 0, line_join = 'bevel', line_width = 1, name = None, tags = [], **wars)
参数:
- xs: 这是线条的x坐标。
- ys: 这是线条的y坐标。
- line_alpha: 它接受线条透明度的百分比值;默认值为1。
- line_cap: 它接受线条的cap值;默认值为butt。
- line_color: 它接受线条的颜色作为输入;默认值为黑色。
- line_dash: 它接受线条的虚线值,例如solid、dashed、dotted、dot-dash、dash-dot [默认值为solid]。
- line_dash_offset: 它接受线条虚线偏移值作为输入;默认值为0。
- line_join: 它接受线条的连接方式作为输入;默认值为bevel。
- line_width: 它接受线条的宽度值作为输入;默认值为1。
- mode: 它接受三个模式值之一作为输入: [“before”, “after”, “centre”]。
- name: 它接受用户提供的模型名称作为输入。
- tags: 它接受用户提供的模型值作为输入。
其他参数:
- alpha: 用于一次设置所有alpha关键字参数。
- color: 用于一次设置所有color关键字参数。
- legend_field: 输入数据源中应使用的列的名称。
- legend_group: 输入数据源中应使用的列的名称。
- legend_label: 用于为图例项标记标签。
- muted: 用于确定是否将glyph渲染为静音状态;其默认值为False。
- name: 用作可选的用户提供的用于附加到渲染器的名称。
- source: 用户提供的数据源。
- view: 用于筛选数据源的视图。
- visible: 用于确定是否应该渲染图形;其默认值为True。
- x_range_name: 用作额外范围的名称,用于映射x坐标。
- y_range_name: 用作额外范围的名称,用于映射y坐标。
- level: 用于指定此glyph的渲染级别顺序。
返回:
circle_x()函数的返回值为:
类GlyphRenderer的对象。
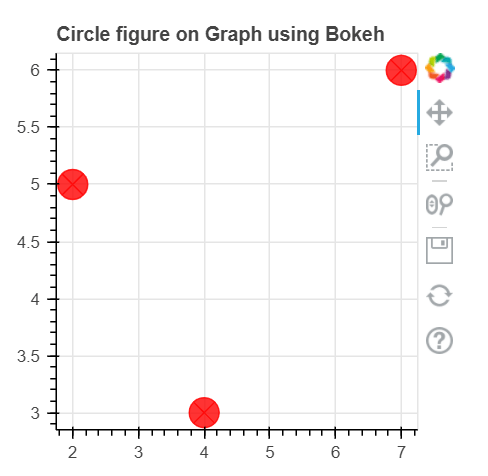
下面的示例演示了bokeh.plotting.figure.circle_x()函数在bokeh.plotting中的用法:
示例1:
# First, we will import all the required modules
import numpy as np
from bokeh.plotting import figure as fig
from bokeh.plotting import output_file as OF
from bokeh.plotting import show
# Here, we will create a file for saving the model
OF("javaTpoint.html")

# Now, we will instantiate the figure object
plot_1 = fig(plot_width = 300, plot_height = 300, title = "Circle figure on Graph using Bokeh")
plot_1.circle_x(x = [2, 4, 7], y = [5, 3, 6], size = 20,
         color ="red", alpha = 0.8)

show(plot_1)
输出:

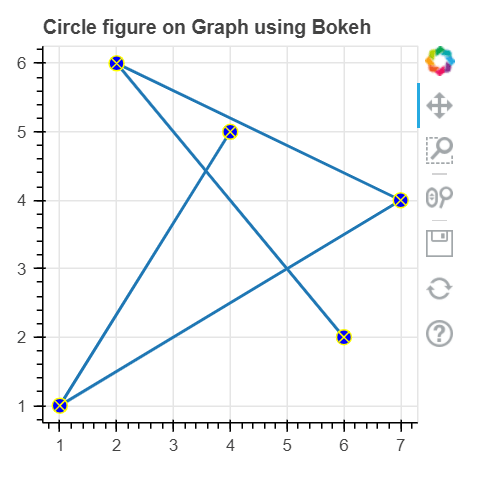
示例2:
# First, we will import all the required modules
import numpy as nmp
from bokeh.plotting import figure as fig
from bokeh.plotting import output_file as OF
from bokeh.plotting import show

x = [4, 1, 7, 2, 6]
y = [5, 1, 4, 6, 2]

# Here, we will create a file for saving the model
OF("javaTpoint.html")

# Now, we will instantiate the figure object
plot_1 = fig(plot_width = 300, plot_height = 300, title = "Circle figure on Graph using Bokeh")

# add both a line and circles on the same plot
plot_1.line(x, y, line_width = 2)
plot_1.circle_x(x, y, fill_color = "blue",
           line_color ="yellow", size = 10)

show(plot_1)
输出:

结论
在本教程中,我们通过示例讨论了Python中使用bokeh.plotting.figure.circle_x()函数的方法。
 极客笔记
极客笔记