如何使用Bokeh在Python中绘制多条线图
Bokeh是一个用于数据可视化的Python库,它使用JavaScript和HTML平台来开发绘图功能。它还针对现代网页浏览器,提供了优雅、简明的构建新颖图形和高性能互动的展示。
在本教程中,我们将学习如何使用bokeh库在图表上绘制多条线。为此,我们将使用bokeh.plotting模块的multi_line()函数。
plotting.figure.multi_line()
语法:
multi_line()函数的语法如下:
multi_line(parameters)
参数:
- xs: 这是线条的x坐标。
- ys: 这是线条的y坐标。
- line_alpha: 它接受线条透明度的百分比值;默认值为1。
- line_cap: 它接受线条的线帽值;默认值为butt。
- line_color: 它以颜色作为线条的输入;默认值为黑色。
- line_dash: 它接受线条虚线样式的值,如实线、虚线、点线、点划线、划点线 [默认值为实线]。
- line_dash_offset: 它接受线条虚线偏移量的值;默认值为0。
- line_join: 它接受线条连接点样式的值;默认值为bevel。
- line_width: 它接受线条宽度的值作为输入;默认值为1。
- name: 它以用户提供的名称作为模型的输入。
- tags: 它以用户提供的值作为模型的输入。
其他参数:
- alpha: 它用于一次性设置所有alpha关键字参数。
- color: 它用于一次性设置所有颜色关键字参数。
- legend_field: 它接受数据源中应该使用的列的名称作为输入。
- legend_group: 它接受数据源中应该使用的列的名称作为输入。
- legend_label: 它用于标记图例条目。
- muted: 它用于确定是否将图元呈现为静音;默认值为False。
- name: 它用作可选的用户提供的名称,以便附加到渲染器上。
- source: 它是一个用户提供的数据源。
- view: 它用于过滤数据源的视图。
- visible: 它用于确定是否呈现图元;默认值为True。
- x_range_name: 它用作额外范围的名称,用于映射x坐标。
- y_range_name: 它用作额外范围的名称,用于映射y坐标。
- level: 它用于指定渲染此图元的渲染级别顺序。
返回:
multi_line()函数的返回值为:
“一个类GlyphRenderer的对象”。
示例1:
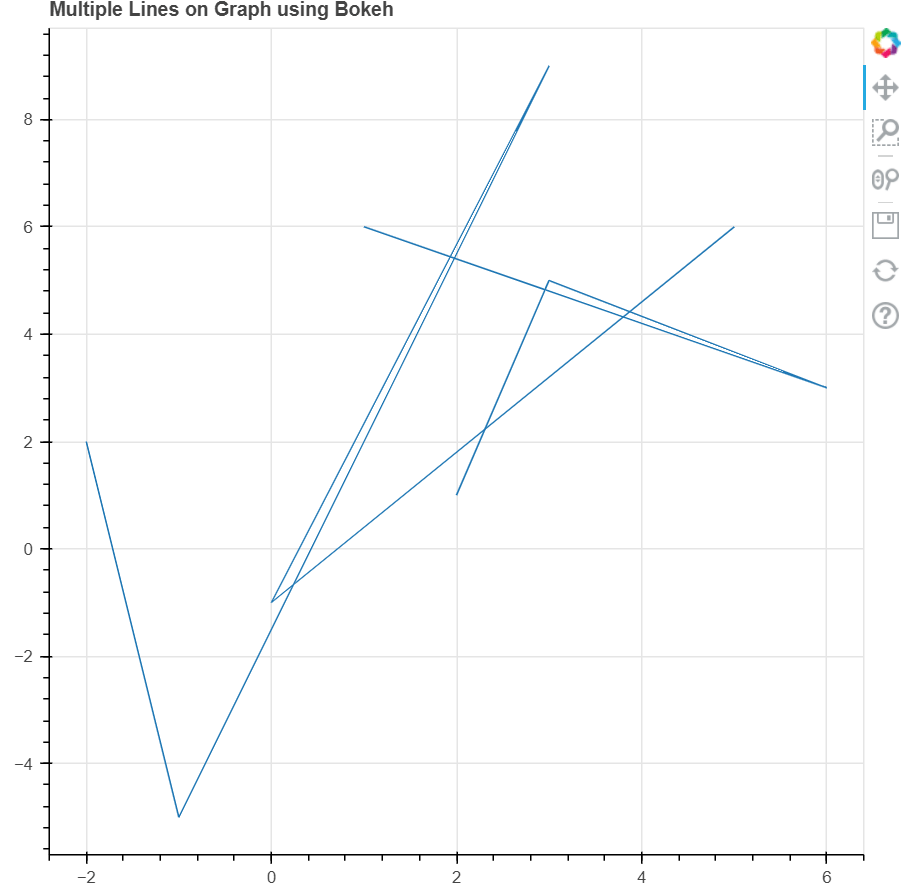
在此示例中,我们将看到如何使用默认值在图上绘制多条线。
代码:
# First, we will import all the required modules
from bokeh.plotting import figure as fig
from bokeh.plotting import output_file as OF
from bokeh.plotting import show

# Here, we will create a file for saving the model
OF("javaTpoint.html")

# Now, we will instantiate the figure object
graph_1 = fig(title = "Multiple Lines on Graph using Bokeh")

# the points to be plotted on Graph
xs = [[2, 3, 6, 1, 4], [-2, -1, 3, 0, 5]]
ys = [[1, 5, 3, 6], [2, -5, 9, -1, 6]]

# Here, we will plot the graph
graph_1.multi_line(xs, ys)

# To display the model
show(graph_1)
输出:

示例2:
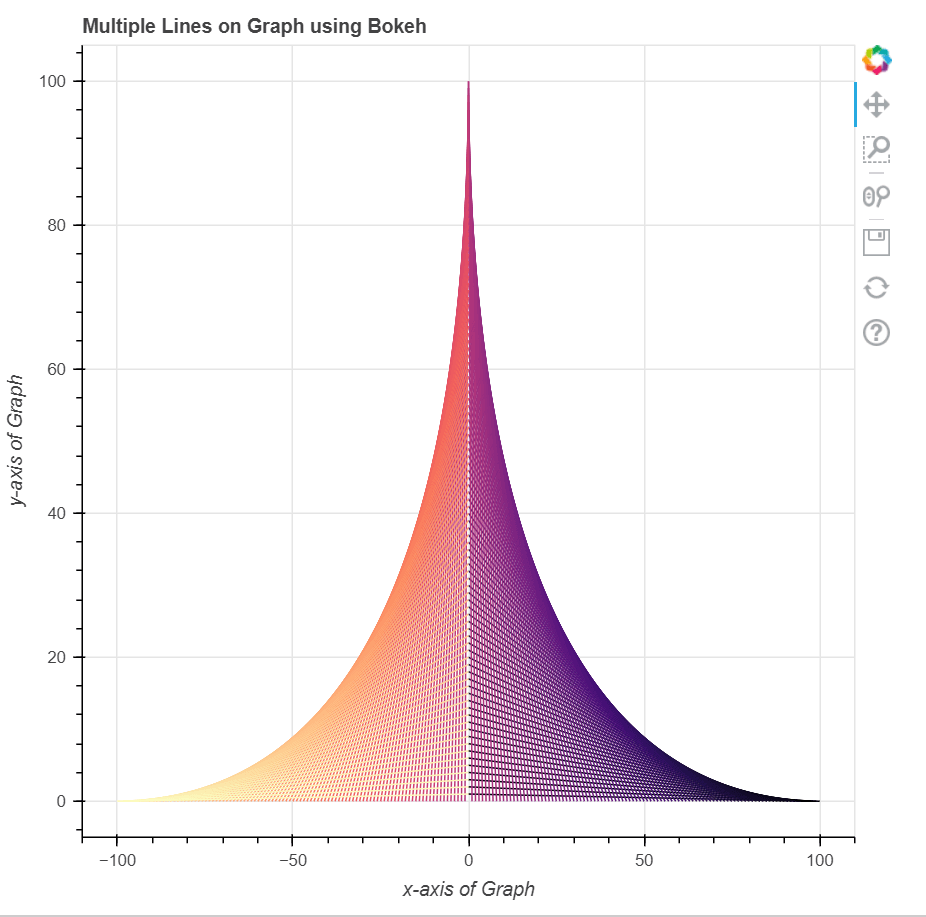
在这个示例中,我们将看到如何在图表上绘制多条线,并带有其他参数。
代码:
# First, we will import all the required modules
from bokeh.plotting import figure as fig
from bokeh.plotting import output_file as OF
from bokeh.plotting import show
from bokeh.palettes import magma as MG

# Here, we will create a file for saving the model
OF("javaTpoint.html")

# Now, we will instantiate the figure object
graph_1 = fig(title = "Multiple Lines on Graph using Bokeh")

# Here, we will name of the x-axis
graph_1.xaxis.axis_label = "x-axis of Graph"

# here, we will name of the y-axis
graph_1.yaxis.axis_label = "y-axis of Graph"

# the points to be plotted
x = [K for K in range(-100, 101)]
x.reverse()
xs = [[K, 0] for K in x]
y1 = [K for K in range(1, 101)]
y1.reverse()
y = [K for K in range(1, 101)] + [0] + y1
ys = [[0, K] for K in y]

# Defineing color of the lines
line_color = MG(201)

# Here, we will plot the graph
graph_1.multi_line(xs, ys,
                 line_color = line_color)

# To display the model
show(graph_1)
输出:

结论
在本教程中,我们讨论了如何使用Python中的Bokeh库绘制图表上的多条线。
 极客笔记
极客笔记