Python使用Bokeh库进行数据可视化
Bokeh是一个Python库,用于通过高性能交互式图表和绘图来进行数据可视化。它使用HTML和JavaScript语言来创建图表。Bokeh库的输出可以在多个平台上生成,如浏览器、HTML、服务器和笔记本。还可以在Django和flask应用程序中创建Bokeh图表。
Bokeh库为用户提供了两种可视化接口:
- 模型: 它是一个低级接口,为应用程序开发人员提供了高度的灵活性。
- 绘图: 它是一个高级接口,用于创建视觉图形。
在本教程中,我们将学习如何使用Python中的Bokeh库创建不同类型的数据可视化图形和图表。
安装:
要安装Bokeh库,可以使用以下命令:
!pip3 install bokeh
代码 1:创建散点圆标记
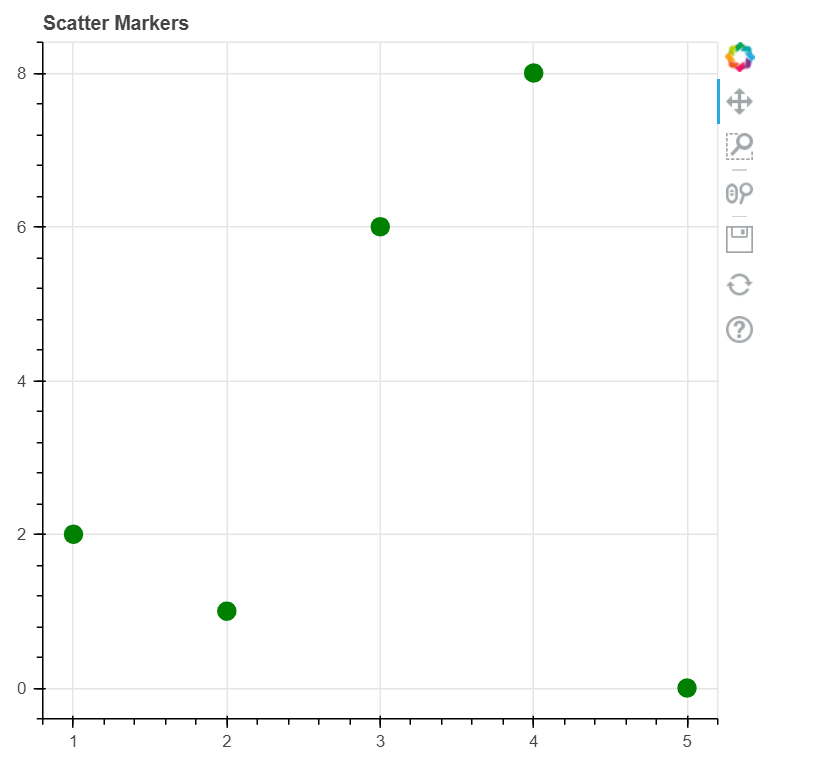
我们可以使用bokeh库在图表上创建散点圆标记。为此,我们将使用 circle() 函数。
示例:
# First, we will import the required modules
from bokeh.plotting import figure as fig
from bokeh.plotting import output_notebook as ON
from bokeh.plotting import show

# output to the notebook
ON()

# creating figure
plot1 = fig(plot_width = 500, plot_height = 500, title = "Scatter Markers")

# adding a circle renderer with size, color and alpha
plot1.circle([1, 2, 3, 4, 5, 6], [2, 1, 6, 8, 0],
         size = 12, color = "green", alpha = 1)

# show the results
show(plot1)
输出:
代码2:创建一条线
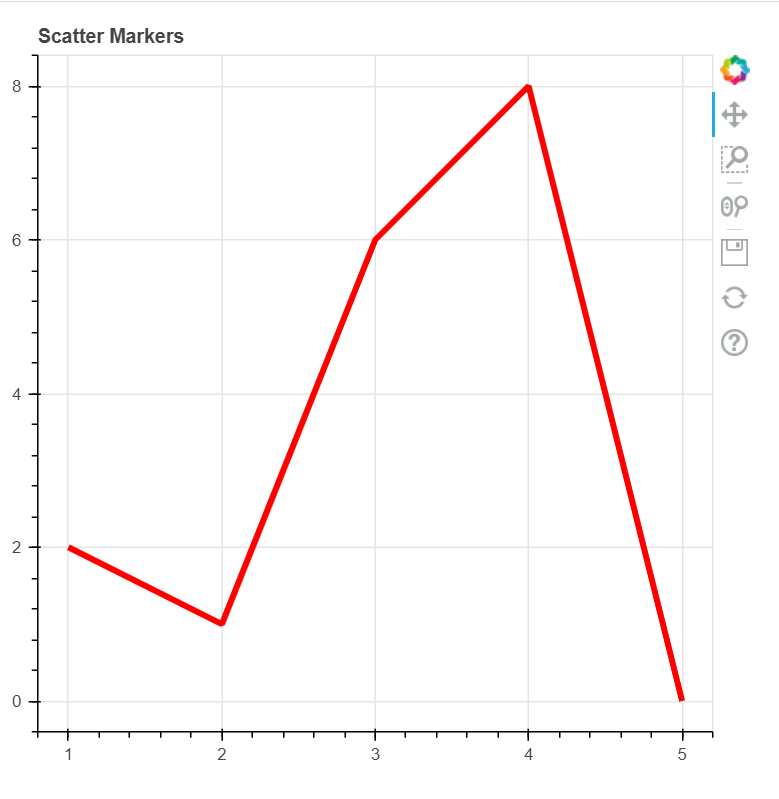
我们可以使用Python中的bokeh库来创建一条线。为此,我们将使用 line() 函数。
示例:
# First, we will import the required modules
from bokeh.plotting import figure as fig
from bokeh.plotting import output_notebook as ON
from bokeh.plotting import show

# output to the notebook
ON()

# creating figure
plot1 = fig(plot_width = 500, plot_height = 500, title = "Scatter Markers")

# adding a line renderer
plot1.line([1, 2, 3, 4, 5, 6], [2, 1, 6, 8, 0],
        line_width = 4, color = "red")

# show the results
show(plot1)
输出:
代码3:创建柱状图
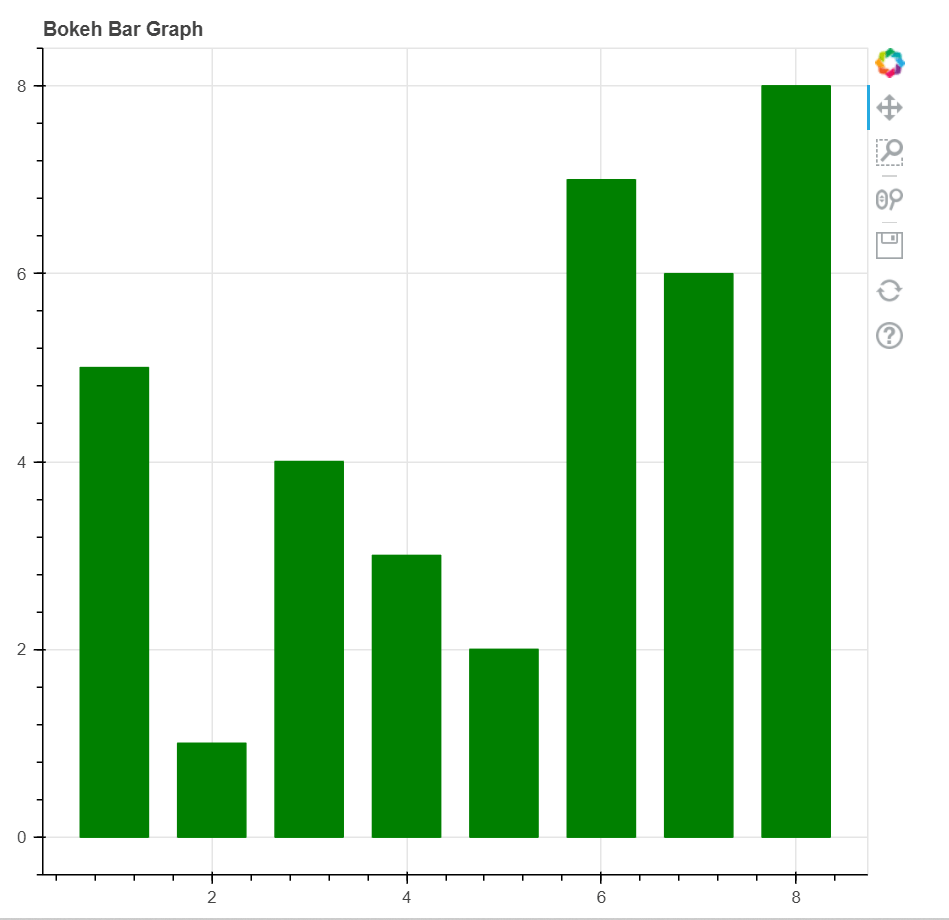
柱状图用于表示具有矩形条的分类数据。条的长度与它们所代表的值成比例。
示例:垂直柱状图
# First, we will import the required modules
from bokeh.plotting import figure as fig
from bokeh.plotting import output_file as OF
from bokeh.plotting import show

# file to save the model
output_file("jtp.html")

# Now, instantiate the figure object
graph1 = fig(title = "Bokeh Bar Graph")

# x-coordinates to be plotted
x = [1, 2, 3, 4, 5, 6, 7, 8]

# y-coordinates of the top edges
top1 = [5, 1, 4, 3, 2, 7, 6, 8]

# width / thickness of the bars
width1 = 0.7

# plot the graph
graph1.vbar(x,
           top = top1,
           width = width1,
           color = "green")

# display the model
show(graph1)
输出:
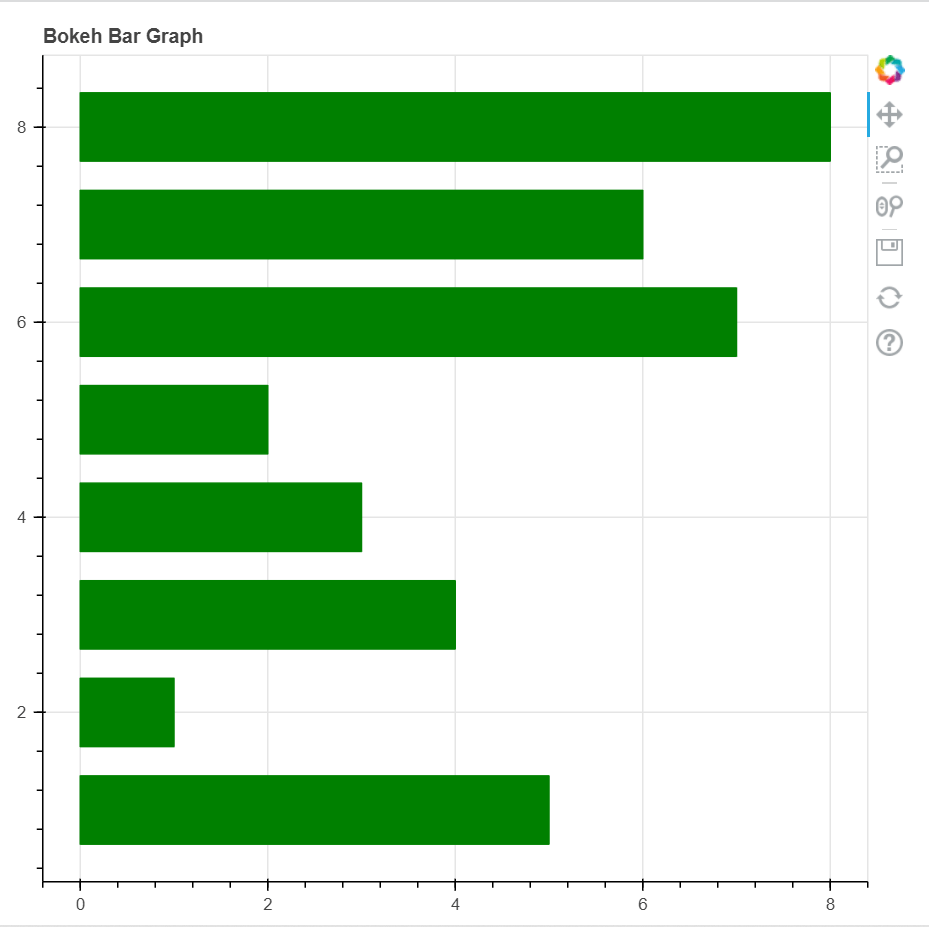
示例2:水平条形图
# First, we will import the required modules
from bokeh.plotting import figure as fig
from bokeh.plotting import output_file as OF
from bokeh.plotting import show

# file to save the model
output_file("jtp.html")

# Now, instantiate the figure object
graph1 = fig(title = "Bokeh Bar Graph")

# x-coordinates to be plotted
x = [1, 2, 3, 4, 5, 6, 7, 8]

# y-coordinates of the top edges
right1 = [5, 1, 4, 3, 2, 7, 6, 8]

# width / thickness of the bars
height1 = 0.7

# plot the graph
graph1.hbar(x,
           right = right1,
           height = height1,
           color = "green")

# display the model
show(graph1)
输出:
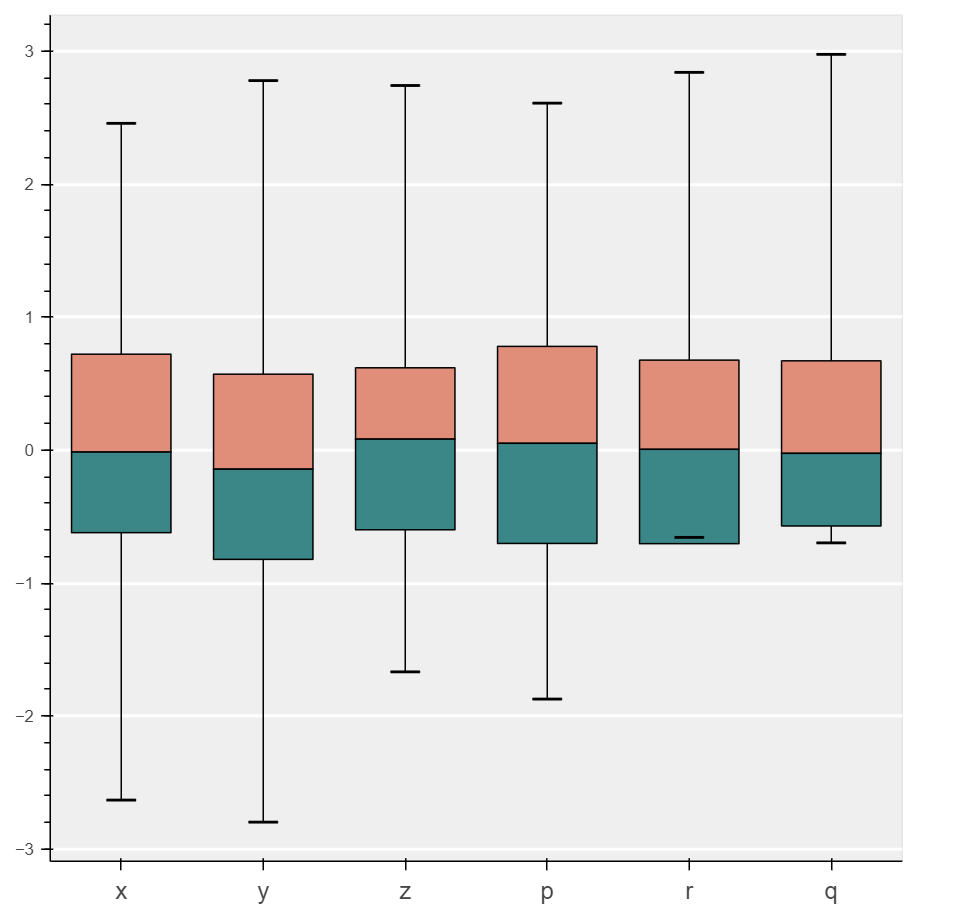
代码4:创建箱线图
箱线图用于在图表上表示统计数据,对于总结数据集中多个组的统计特性非常有用。
示例:
import numpy as nmp
import pandas as pnd

from bokeh.plotting import figure as fig
from bokeh.plotting import show

# generate some time series for six different categories
cats_1 = list("xyzprq")
y_y = nmp.random.randn(2000)
g_1 = nmp.random.choice(cats_1, 2000)
for K, J in enumerate(cats_1):
    y_y[g_1 == l] += K // 2
data_frame = pnd.DataFrame(dict(score = y_y, group = g_1))

# now, we will find the quartiles and IQR for each category
groups1 = data_frame.groupby('group')
q_1 = groups1.quantile(q = 0.25)
q_2 = groups1.quantile(q = 0.5)
q_3 = groups1.quantile(q = 0.75)
iqr = q3 - q1
upper = q3 + 1.5 * iqr
lower = q1 - 1.5 * iqr

# now we will find the outliers for each category
def outliers(group2):
    cat_2 = group2.name
    return group2[(group2.score > upper.loc[cat_2]['score']) | (group2.score < lower.loc[cat_2]['score'])]['score']
out = groups.apply(outliers).dropna()

# here, we will prepare outlier data to plot, we would be needing coordinates for every outlier.
if not out.empty:
    out_x = list(out.index.get_level_values(0))
    out_y = list(out.values)

plot1 = fig(tools = "", background_fill_color = "#efefef", x_range = cats_1, toolbar_location = None)

# if no outliers, we will shrink the lengths of stems to be no longer than the minimums or maximums
q_min = groups1.quantile(q = 0.00)
q_max = groups1.quantile(q = 1.00)
upper.score = [min([x,y]) for (x,y) in zip(list(q_max.loc[:, 'score']), upper.score)]
lower.score = [max([x,y]) for (x,y) in zip(list(q_min.loc[:, 'score']), lower.score)]

# stems
plot1.segment(cats_1, upper.score, cats_1, q_3.score, line_color = "black")
plot1.segment(cats_1, lower.score, cats_1, q_1.score, line_color = "black")

# boxes
plot1.vbar(cats_1, 0.7, q_2.score, q_3.score, fill_color = "#E08E79", line_color = "black")
plot1.vbar(cats_1, 0.7, q_1.score, q_2.score, fill_color = "#3B8686", line_color = "black")

# whiskers (almost-0 height rects simpler than segments)
plot1.rect(cats_1, lower.score, 0.2, 0.01, line_color = "black")
plot1.rect(cats_1, upper.score, 0.2, 0.01, line_color = "black")

# outliers
if not out.empty:
    plot1.circle(outx, outy, size = 6, color = "#F38630", fill_alpha = 0.6)

plot1.xgrid.grid_line_color = None
plot1.ygrid.grid_line_color = "white"
plot1.grid.grid_line_width = 2
plot1.xaxis.major_label_text_font_size = "16px"

show(plot1)
输出:
代码 5:创建散点图
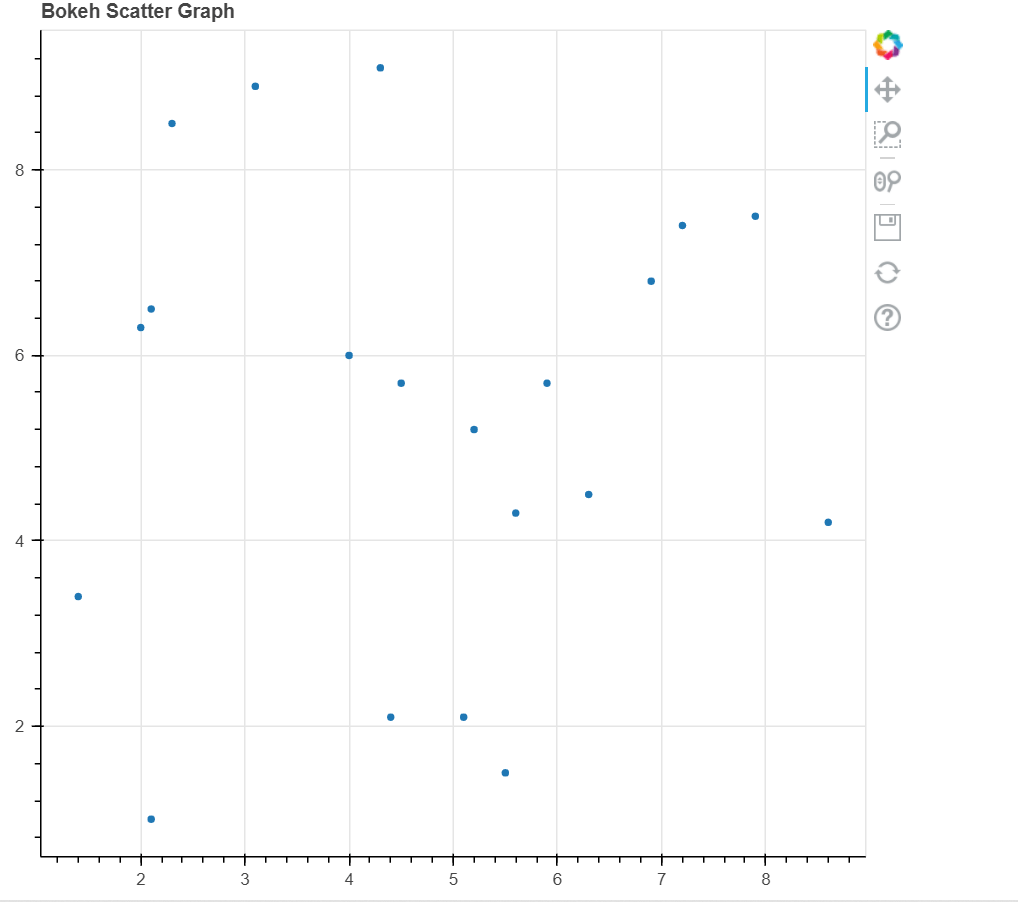
散点图用于绘制数据集中两个变量的值。它有助于找到所选择的两个变量之间的相关性。
示例:
# First, we will import the required modules
from bokeh.plotting import figure as fig
from bokeh.plotting import output_file as OF
from bokeh.plotting import show

# file for saving the model
OF("jtp.html")

# instantiate the figure object
graph1 = fig(title = "Bokeh Scatter Graph")

# the points to be plotted on Scatter Plot
x1 = [1.4, 5.1, 5.9, 2.3, 5.6, 8.6, 4.5, 2.1, 3.1, 4.3, 5.5, 4.4, 6.9, 2.1, 4, 5.2, 6.3, 7.2, 7.9, 2]
y1 = [3.4, 2.1, 5.7, 8.5, 4.3, 4.2, 5.7, 6.5, 8.9, 9.1, 1.5, 2.1, 6.8, 1, 6, 5.2, 4.5, 7.4, 7.5, 6.3]

# plott the graph
graph1.scatter(x1, y1)

# display the model
show(graph1)
输出:
结论
在本教程中,我们讨论了使用Python的bokeh库可以创建的各种类型的数据可视化,包括条形图、箱线图、散点标记、散点图和单一线条。
 极客笔记
极客笔记