Python 如何使用Scikit-learn实现随机投影
随机投影是一种降维和数据可视化方法,可以简化高维数据的复杂性。它主要应用于其他降维技术(例如 主成分分析(PCA) )无法处理的数据。
Python Scikit-learn提供了一个名为 sklearn.random_projection 的模块,实现了一种计算高效的数据降维方法。它实现了以下两种类型的非结构化随机矩阵:
- 高斯随机矩阵
- 稀疏随机矩阵
实现高斯随机投影
要实现高斯随机矩阵, random_projection模块使用GaussianRandomProjection()函数,通过将原始空间投影到随机生成的矩阵上来降低维数。
示例
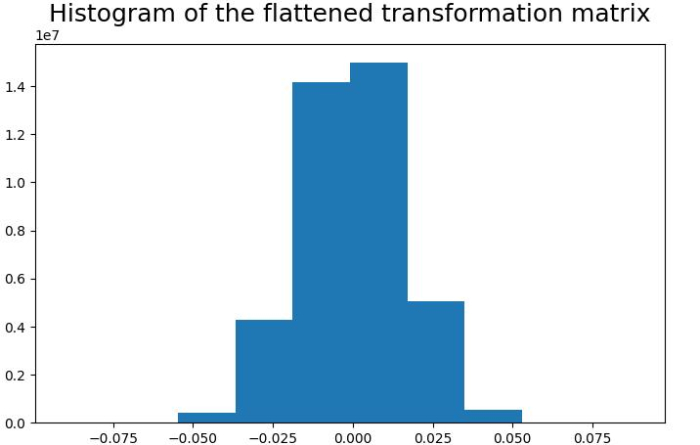
让我们看一个示例,使用高斯随机投影转换器并将投影矩阵的值可视化为直方图:
# Importing the necessary packages
import sklearn
from sklearn.random_projection import GaussianRandomProjection
import numpy as np
from matplotlib import pyplot as plt

# Random data and its transformation
X_random = np.random.RandomState(0).rand(100, 10000)
gauss_data = GaussianRandomProjection(random_state=0)
X_transformed = gauss_data.fit_transform(X_random)

# Get the size of the transformed data
print('Shape of transformed data is: ' + str(X_transformed.shape))

# Set the figure size
plt.figure(figsize=(7.50, 3.50))
plt.subplots_adjust(bottom=0.05, top=0.9, left=0.05, right=0.95)

# Histogram for visualizing the elements of the transformation matrix
plt.hist(gauss_data.components_.flatten())
plt.title('Histogram of the flattened transformation matrix', size ='18')
plt.show()
输出
它将产生以下输出
Shape of transformed data is: (100, 3947)

实现稀疏随机投影
为了实现稀疏随机矩阵,random_projection模块使用 GaussianRandomProjection() 函数通过将原始空间投影到稀疏随机矩阵上来降低维度。
示例
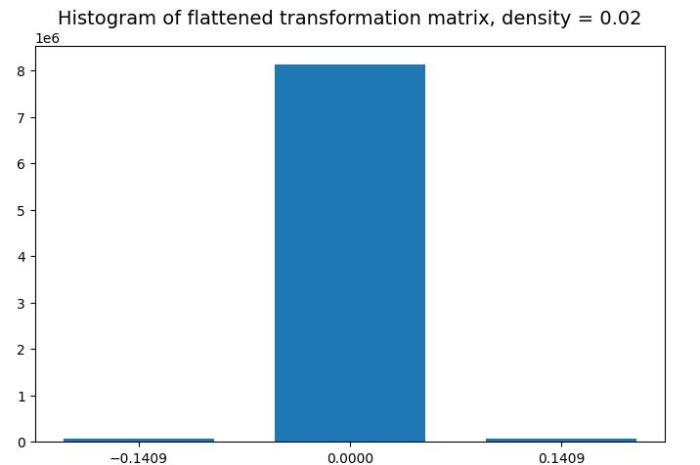
让我们看一个示例,其中我们使用稀疏随机投影转换器,并将投影矩阵的值可视化为直方图。
# Importing the necessary packages
import sklearn
from sklearn.random_projection import SparseRandomProjection
import numpy as np
from matplotlib import pyplot as plt

# Random data and its Sparse transformation
rng = np.random.RandomState(42)
X_rand = rng.rand(25, 3000)
sparse_data = SparseRandomProjection(random_state=0)
X_transformed = sparse_data.fit_transform(X_rand)

# Get the size of the transformed data
print('Shape of transformed data is: ' + str(X_transformed.shape))

# Getting data of the transformation matrix and storing it in s.
s = sparse_data.components_.data
total_elements = sparse_data.components_.shape[0] *\
sparse_data.components_.shape[1]
pos = s[s>0][0]
neg = s[s<0][0]
print('Shape of transformation matrix is: '+ str(sparse_data.components_.shape))
counts = (sum(s==neg), total_elements - len(s), sum(s==pos))

# Set the figure size
plt.figure(figsize=(7.16, 3.50))
plt.subplots_adjust(bottom=0.05, top=0.9, left=0.05, right=0.95)

# Histogram for visualizing the elements of the transformation matrix
plt.bar([neg, 0, pos], counts, width=0.1)
plt.xticks([neg, 0, pos])
plt.suptitle('Histogram of flattened transformation matrix, ' +
   'density = ' +
   '{:.2f}'.format(sparse_data.density_), size='14')
plt.show()
输出
它将产生以下输出−
Shape of transformed data is: (25, 2759)
Shape of transformation matrix is: (2759, 3000)

 极客笔记
极客笔记