在OpenCV Python中实现k-Nearest Neighbor
k-Nearest Neighbor( kNN )是一种简单的用于监督学习的分类算法。要在OpenCV中实现 kNN ,可以按照以下步骤进行操作−
- 导入所需的库 OpenCV,NumPy 和 Matplotlib 。
-
我们定义了两个类别Red和Blue,每个类别有25个数字。然后使用随机生成器为这两个类别生成训练数据。
-
接下来,我们为每个训练数据生成标签。Red类别的标签为0,Blue类别的标签为1。
-
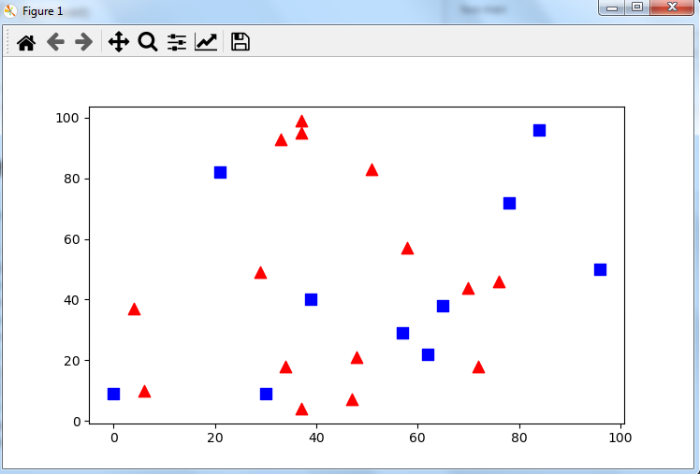
现在绘制Red和Blue类别的成员。
-
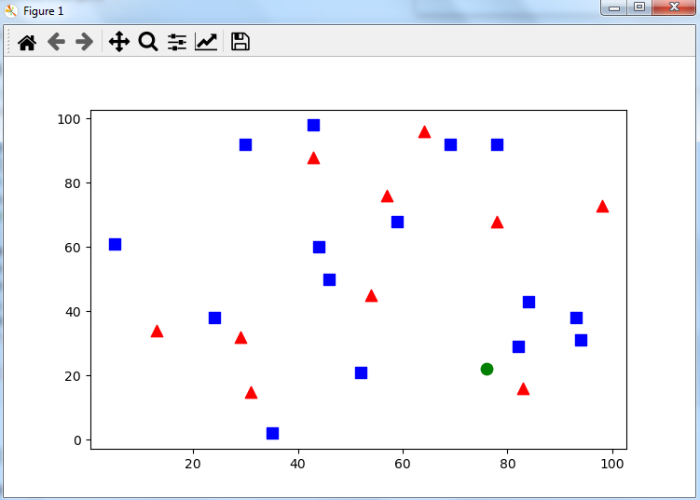
使用随机生成器生成一个新的数字并绘制它。
-
初始化一个KNearest对象 knn 并用训练数据对其进行训练。
-
最后,使用新数字计算 knn.findNearest() ,以找到新成员的类别标签、最近邻居的类别标签和距离。
让我们看一下下面的示例,以实现k-Nearest Neighbors。
示例
在这个示例中,我们为红色和蓝色家族分别生成和绘制了25个训练数据。
# import required libraries
import cv2
import numpy as np
import matplotlib.pyplot as plt

# Feature set containing (x,y) values of 25 known/training data
trainData = np.random.randint(0,100,(25,2)).astype(np.float32)

# Labels each one either Red or Blue with numbers 0 and 1
responses = np.random.randint(0,2,(25,1)).astype(np.float32)

# Take Red families and plot them
red = trainData[responses.ravel()==0]
plt.scatter(red[:,0],red[:,1],80,'r','^')

# Take Blue families and plot them
blue = trainData[responses.ravel()==1]
plt.scatter(blue[:,0],blue[:,1],80,'b','s')
plt.show()
输出
当您运行上述Python程序时,它将产生以下 输出 窗口−

示例
在此示例中,我们为红色和蓝色家族生成和绘制了25个训练数据。现在,我们生成一个新数字,并应用K最近邻算法将新数字分类为红色或蓝色家族。
# import required libraries
import cv2
import s numpy as np
import matplotlib.pyplot aplt

# Feature set containing (x,y) values of 25 known/training data
trainData = np.random.randint(0,100,(25,2)).astype(np.float32)

# Labels each one either Red or Blue with numbers 0 and 1
responses = np.random.randint(0,2,(25,1)).astype(np.float32)

# Take Red families and plot them
red = trainData[responses.ravel()==0]
plt.scatter(red[:,0],red[:,1],80,'r','^')

# Take Blue families and plot them
blue = trainData[responses.ravel()==1]
plt.scatter(blue[:,0],blue[:,1],80,'b','s')

# take new point
newcomer = np.random.randint(0,100,(1,2)).astype(np.float32)
plt.scatter(newcomer[:,0],newcomer[:,1],80,'g','o')
knn = cv2.ml.KNearest_create()
knn.train(trainData, cv2.ml.ROW_SAMPLE, responses)
ret, results, neighbors ,dist = knn.findNearest(newcomer, 3)
print("Label of New Member: {}\n".format(results) )
print("Nearest Neighbors: {}\n".format(neighbors) )
print("Distance of Each Neighbor: {}\n".format(dist) )
plt.show()
输出
当你运行以上的Python程序时,它将产生以下 输出 −
Label of New Member: [[1.]]
Nearest Neighbors: [[0. 1. 1.]]
Distance of Each Neighbor: [[ 85. 85. 405.]]
结果显示,新的数值属于蓝色家族,因为三个最近邻居中的两个属于蓝色家族。它还将显示以下内容 输出 窗口 –

 极客笔记
极客笔记