Matplotlib 如何调整轴标签的位置
在 Matplotlib 中使用子图或图表进行数据可视化时,正确标记轴并根据需要调整轴标签的位置非常重要,以确保它们不会与图表中的其他元素重叠。这样可以帮助用户更容易地理解所呈现的数据。
为了创建轴标签和调整标签位置,我们将使用 Matplotlib 库,该库用于创建高质量的数据可视化。本文将讨论在 Matplotlib 中调整轴标签位置的各种方法,并且我们将使用子图进行演示。
Matplotlib
Matplotlib 是主要用于绘制 Python 编程语言和数值数学的图形和图表的库。Tkinter、wxPython、Qt 和 GTK GUI 工具包可能会使用其面向对象的 API 来创建图表。
matplotlib.pyplot 是一组命令样式的方法,允许 matplotlib 的使用方式类似于 MATLAB。每个 pyplot 函数都会以某种方式更改图形,无论是添加绘图区域、绘制线条、添加标签等。当前图形和绘图区域在 matplotlib.pyplot 的函数调用之间被保存,并且绘图函数始终应用于活动的坐标轴集。
子图
Matplotlib 中的子图允许在单个图中显示多个图表或图表。借助子图,我们可以同时比较和分析多组数据,从而更容易地发现趋势、模式和关系。
子图是较大图中的一组较小图的网格。每个子图在网格中有自己的位置,该位置基于网格中的行数和列数以及子图在网格中的位置。
Matplotlib 的 “subplots” 方法允许我们创建子图。此函数返回一个图形对象和一组子图对象。我们可以使用这些子图对象在每个子图中绘制我们的数据。
语法
fig,ax=plt.subplots(nrows,ncolumns,index)
说明
- nrows - 此参数指定网格中子图的行数。
-
ncolumns - 此参数指定网格中子图的列数。
-
index - 此参数指定当前子图的索引。索引从 1 开始,并按行递增。
调整坐标轴标签的位置
Matplotlib 中有多种方法或函数可调整坐标轴标签在图表中的位置,包括:
- .set_label_coords() 函数
-
set_label_position() 函数
-
set_pad() 函数
.set_label_coords()
此方法用于设置子图的标签坐标。
刻度标签边界框确定 y 标签的 x 坐标和 x 标签的 y 坐标的默认值。然而,当有多个轴时,标签必须对齐时,就会出现问题。
标签的坐标也可以指定给转换。如果未指定,则使用轴坐标系统,其中 (0, 0) 是左下角,(0.5, 0.5) 是中间位置,等等。
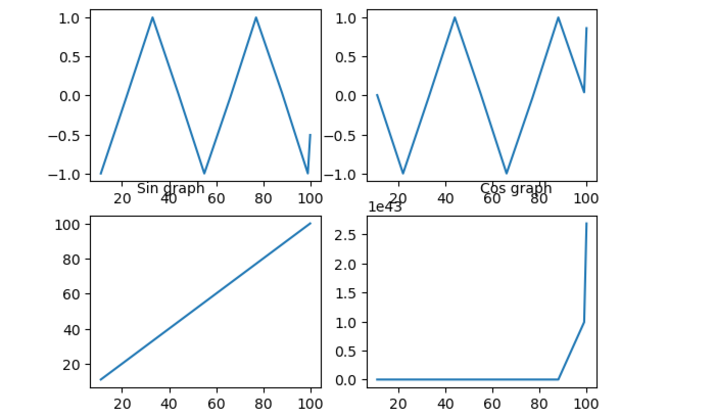
示例1
import matplotlib.pyplot as p
import numpy as n

# generate some data
x=n.array([11, 22,33, 44, 55,66,77,88,99,100])

# create a subplot and plot the data
f, a = p.subplots(2,2)
a[0,0].plot(x, n.sin(x))
a[0,1].plot(x,n.cos(x))
a[1, 0].plot(x, x)
a[1, 1].plot(x, n.exp(x))
# set the x-axis label and adjust the position
a[0,0].set_xlabel('Sin graph')
a[0,0].xaxis.set_label_coords(0.35, 0)

a[0,1].set_xlabel('Cos graph')
a[0,1].xaxis.set_label_coords(0.65,0)
a[1, 0].set_xlabel('Linear graph')
a[1,0].xaxis.set_label_coords(0.35,-0.24)
a[1, 1].set_xlabel('exponential graph')
a[1,1].xaxis.set_label_coords(0.65,-0.25)

# display the plot
p.show()
输出

set_label_position()函数
set_position()函数用于设置子图中轴的标签位置。该方法接受以下参数 –
位置 - ‘left’、’right’、’top’、’bottom’。
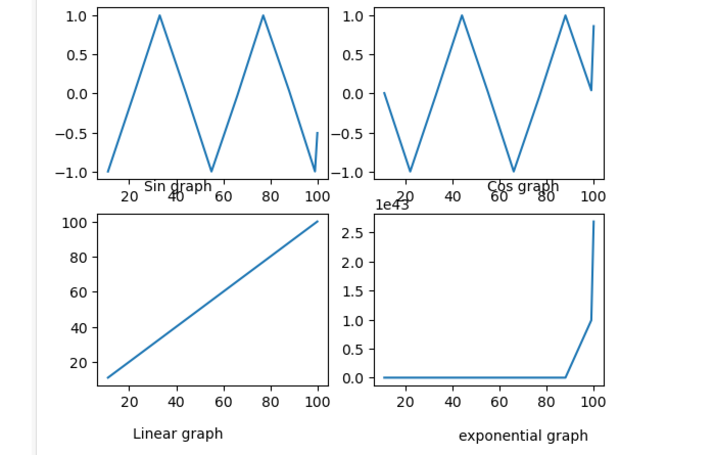
示例2
import matplotlib.pyplot as p
import numpy as n

# generate some data
x=n.array([11, 22,33, 44, 55,66,77,88,99,100])

# create a subplot and plot the data
f, a = p.subplots(2,2)
a[0,0].plot(x, n.sin(x))
a[0,1].plot(x,n.cos(x))
a[1, 0].plot(x, x)
a[1, 1].plot(x, n.exp(x))
# set the x-axis label and y label and adjust the position
a[0,0].set_xlabel('Sin graph')
a[0,0].xaxis.set_label_position('bottom')
a[0,0].yaxis.set_label_position('left')
a[0,0].xaxis.set_label_coords(0.35, 0)
a[0,0].yaxis.set_label_coords(0.35, 0)
a[0,1].set_xlabel('Cos graph')
a[0,1].xaxis.set_label_position('bottom')
a[0,0].yaxis.set_label_position('left')
a[0,1].xaxis.set_label_coords(0.65,0)
a[0,1].yaxis.set_label_coords(0.65,0)
a[1, 0].set_xlabel('Linear graph')
a[1,0].xaxis.set_label_position('bottom')
a[0,0].yaxis.set_label_position('left')
a[1,0].xaxis.set_label_coords(0.35,-0.24)
a[1,0].yaxis.set_label_coords(0.35,-0.24)
a[1, 1].set_xlabel('exponential graph')
a[1,1].xaxis.set_label_position('bottom')
a[0,0].yaxis.set_label_position('left')
a[1,1].xaxis.set_label_coords(0.65,-0.25)
a[1,1].yaxis.set_label_coords(0.65,-0.25)


# display the plot
p.show()
输出

set_pad()函数和set_label函数的labelpad参数
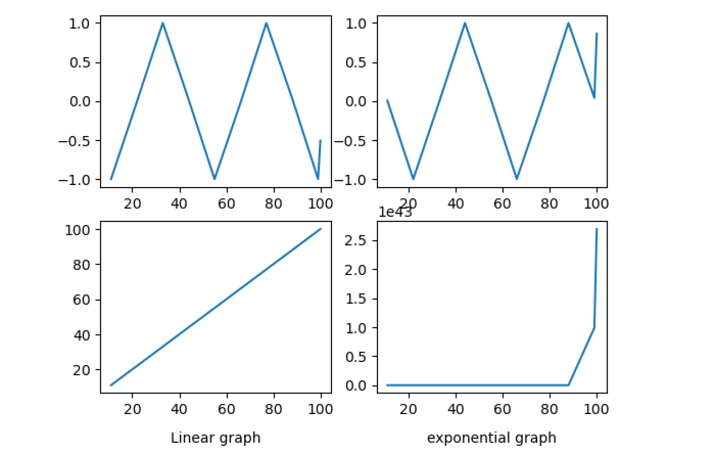
使用set_pad()函数,我们可以改变轴标签和轴刻度标签之间的间距。
例如,我们可以使用以下代码来改变子图中x轴标签周围的空间大小。
示例3
import matplotlib.pyplot as plt
import numpy as np

# generate some data
x=np.array([11, 22,33, 44, 55,66,77,88,99,100])

# create a subplot and plot the data
fig, ax = plt.subplots(2,2)
ax[0,0].plot(x, np.sin(x))
ax[0,1].plot(x,np.cos(x))
ax[1, 0].plot(x, x)
ax[1, 1].plot(x, np.exp(x))
# set the x-axis label and adjust the position

ax[1, 0].set_xlabel('Linear graph',labelpad=10)

ax[1, 1].set_xlabel('exponential graph',labelpad=10)


# display the plot
plt.show()
输出

结论
总之,调整轴标签的位置是使用Matplotlib绘制清晰准确图表的重要部分。set_label_coords()、set_position()和set_pad()是我们可以使用的一些方法,用于改变图表或子图中轴标签的位置。
 极客笔记
极客笔记