Python 绘制不同国家新冠病毒的增长曲线
通过Python探索COVID-19的动态世界,分析、可视化和预测不同国家病毒增长曲线。通过数据预处理、清洗和使用pandas和matplotlib等强大的库,在本文中,我们深入探讨绘制和预测这一大流行病影响的交互领域,为其轨迹和全球范围提供洞察。
使用Python绘制不同国家新冠病毒的增长曲线
我们将绘制给定国家的总病例数和总死亡人数的增长图,并打印可用国家的列表。本文使用的数据集可以从以下链接下载:https://ourworldindata.org/。
以下是我们使用Python绘制不同国家新冠病毒增长曲线的步骤:
- 导入所需的库 –
- 我们首先导入必要的库:pandas和plotly.express。
-
pandas用于数据操作和预处理。
-
plotly.express用于创建交互式可视化。
-
加载数据 –
- 程序使用pandas库的pd.read_csv()函数从’owid-covid-data.csv’文件加载COVID-19数据。
-
数据包含日期、位置和总病例的信息。
-
数据预处理和清洗 –
- 我们进行数据预处理和清洗,以准备数据进行分析。
- 我们选择进行分析的相关列,包括 ‘date’、’location’ 和 ‘total_cases’。
-
使用 dropna() 函数删除任何带有缺失值的行。
- 获取可用国家列表 –
- 使用 unique() 函数从数据的 ‘location’ 列中提取唯一的国家名称。
-
这将创建一个可用于后续使用的国家列表。
- 分析数据 –
- 使用 groupby() 函数将数据按照地点进行分组,并使用 max() 函数计算每个地点的最大总病例数。
-
根据总病例数对结果进行降序排序。
- 绘制增长曲线−
- 我们使用input()函数提示用户输入一个国家名称。
-
如果输入的国家名称有效(即存在于可用的国家列表中),我们将继续绘制该国家的增长曲线。
-
使用布尔索引(data[‘location’] country_name)筛选数据以提取与指定国家对应的行。
-
将筛选后的数据传递给plotly.express中的px.line()函数创建线型图。
-
将x参数设置为’date’,将y参数设置为’total_cases’。
图表的标题设置为包含选定国家名称的内容。
- 显示和保存图表 −
- 我们使用fig.show()函数显示交互式增长曲线图。
-
要将图表保存为HTML文件,我们使用fig.write_html()函数并提供所需的文件名(’growth_curve.html’)。
-
打印确认消息,表示图表已成功保存。
-
显示可用国家的列表 −
- 最后,我们显示可用国家的列表供用户参考。
-
使用循环遍历’countries’列表打印每个国家名称。
示例
下面是使用上述步骤的程序示例−
import pandas as pd
import plotly.express as px

# Step 1: Load the data
data = pd.read_csv('owid-covid-data.csv')

# Step 2: Data preprocessing and cleaning
# Select the relevant columns for analysis
data = data[['date', 'location', 'total_cases']]

# Remove rows with missing values
data = data.dropna()

# Get the list of available countries
countries = data['location'].unique()

# Step 3: Analyzing the data
# Group the data by location and calculate the total cases for each location
grouped_data = data.groupby('location')['total_cases'].max()

# Sort the data in descending order
sorted_data = grouped_data.sort_values(ascending=False)

# Step 4: Data prediction
# Fit a curve to the data using polynomial regression or any other suitable method

# Step 5: Plotting the growth curve
# Prompt the user to enter a country name
country_name = input("Enter a country name: ")

if country_name in countries:
   # Plot the growth curve for the specified country
   country_data = data[data['location'] == country_name]

   # Create the plot using Plotly
   fig = px.line(country_data, x='date', y='total_cases', title=f'COVID-19 Growth Curve in {country_name}')
   fig.show()

   # Save the plot as an HTML file
   fig.write_html('growth_curve.html')

   print(f"Graph saved as 'growth_curve.html'")
else:
   print("Invalid country name. Please try again.")

# Display the list of available countries
print("Available countries:")
for country in countries:
   print(country)
输出
当我们运行上述代码时,它会要求我们输入一个国家的名称 −

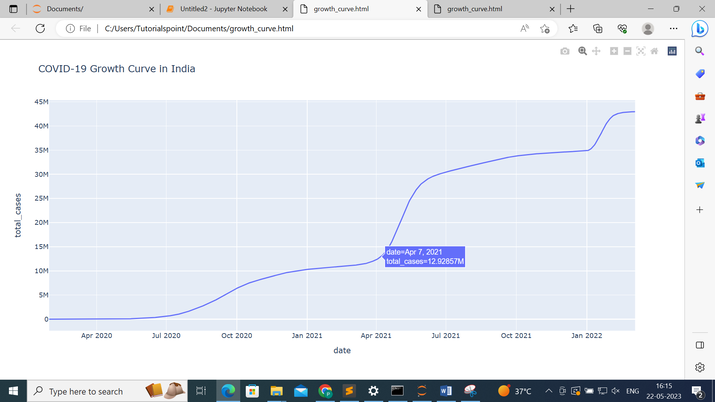
假设我们提供的国家名称是印度,然后按下回车键,它将给出以下输出 −

它会显示我们可以选择任何国家的图表和可用国家列表,并将图表保存为’growth_curve.html’。
以下是’growth_curve.html’,其中包含印度的增长曲线 −

结论
总之,Python以及像pandas和matplotlib这样的库为分析和可视化不同国家COVID-19的增长曲线提供了一个多功能平台。通过利用数据预处理、清理和可视化技术,我们可以获得有关这一大流行病全球影响的有价值的洞见,从而使我们能够做出明智的决策并采取必要的行动。
 极客笔记
极客笔记