如何改变使用Matplotlib绘制的图形的大小
在这个教程中,我们将讨论如何在Python中使用Matplotlib调整创建的图形的大小。Matplotlib库广泛用于创建图形。
介绍
Matplotlib用于创建代表数据的图形很受欢迎。我们可以用各种类型的数据填充图形,包括轴、图形绘制、几何形状等。我们可以对Matplotlib生成的图形执行各种操作,其中调整大小是一项常见任务。有时,我们需要将图形的大小设置为特定的大小。图形可以更宽、更高等。
matplotlib.figure() 提供了 figsize 属性,用于指定图形的宽度和高度,单位为英寸。让我们理解以下语法。
语法:
import matplotlib.pyplot as plt
figure_name = plt.figure(figsize=(width, height))
figsize是figure()方法的可选参数。默认情况下,图的尺寸为(6.4, 4.8)。
一般情况下,每个英寸的单位为80 x 80像素。然而,我们可以通过dpi参数来改变每个英寸的像素数,该参数可以在同一函数中指定。
我们将按照以下步骤进行操作。
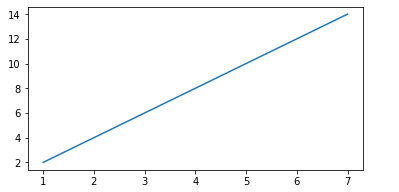
- 我们将定义一个名为val_1的变量,并将其设置为plt.figure(figsize=(6,3))。
- 它将创建一个宽度为6英寸,高度为3英寸的图形对象。
- figsize属性具有一个包含2个值的元组。
让我们理解以下示例。
示例
# We start by importing matplotlib
import matplotlib.pyplot as plt

# Plotting a figure of width 6 and height 3
plot_1 = plt.figure(figsize=(6, 3))

# Let's plot the equation y=2*x
x = [1, 2, 3, 4, 5, 6,7]

# y = [2,4,6,8,10, 12, 14]
y = [x*2 for x in x]

# plt.plot() specifies the arguments for x-axis
# and y-axis to be plotted
plt.plot(x, y)

# To show this figure object, we use the line,
# fig.show()
plt.show()
输出:
示例2:
# importing matplotlib library
import matplotlib.pyplot as plt

# Now we plot a figure of width 7 and height 12
plt_1 = plt.figure(figsize=(2, 5))

# Using the equation y=3*x
x = [1, 2, 3, 4, 5]

# y = [3,8,27,64,125]
y = [x*2 for x in x]

# plt.plot() determines the arguments for
# x-axis and y-axis to be plotted
plt.plot(x, y)

# To show this figure object, we use the line,
# fig.show()
plt.show()
输出:
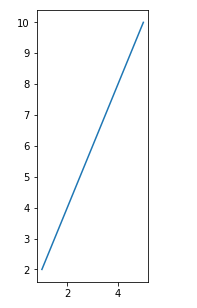
在以上代码中,我们将高度增大了,与宽度相比,并改变了图形的绘制。
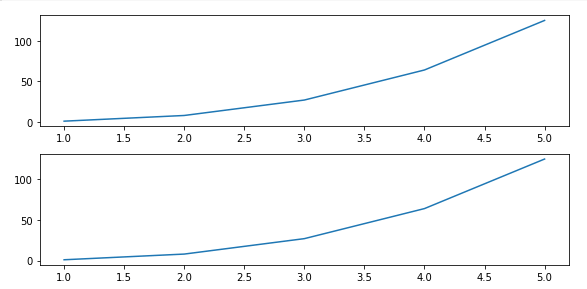
我们还可以使用相同的方法设置子图的大小。让我们来理解下面的示例。
示例
import matplotlib.pyplot as plt

fig, axes= plt.subplots(nrows=2, ncols=1,figsize=(8,4))

x= [1,2,3,4,5]

y=[x**3 for x in x]

axes[0].plot(x,y)
axes[1].plot(x,y)

plt.tight_layout()

plt.show()
输出:
设置Matplotlib中图形的高度和宽度
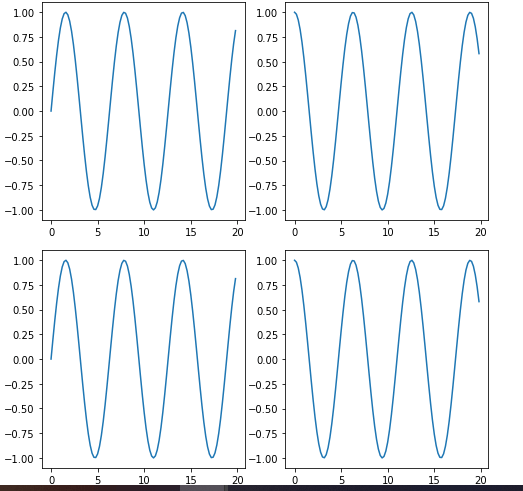
我们也可以设置图形的高度和宽度,而不使用figsize参数。可以使用 set() 函数来完成,其中包含figheight和figwidth参数。也可以使用 set_figheight() 和 set_figwidth() 函数来设置高度和宽度。
让我们来了解下面的示例。
示例
import matplotlib.pyplot as plt
import numpy as np

x = np.arange(0, 20, 0.2)
y = np.sin(x)
z = np.cos(x)

fig = plt.figure()

fig.set_figheight(4)
fig.set_figwidth(8)

# Adds subplot on position 1
ax = fig.add_subplot(121)
# Adds subplot on position 2
ax2 = fig.add_subplot(122)

ax.plot(x, y)
ax2.plot(x, z)
plt.show()
输出:
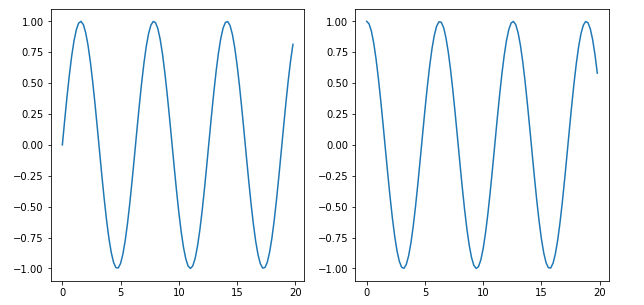
另一方面,我们也可以使用 set_size_inches() 。下面是一个示例。
示例2:
import matplotlib.pyplot as plt
import numpy as np

fig = plt.figure()

fig.set_size_inches(10, 5)

# Adds subplot on position 1
ax = fig.add_subplot(121)
# Adds subplot on position 2
ax2 = fig.add_subplot(122)

ax.plot(x, y)
ax2.plot(x, z)
plt.show()
输出:
修改图表
这是一种在不使用图形环境的情况下修改图表属性的方式。我们还可以更新matplotlib.rcParams,这是一个用于处理默认matplotlib值的RcParams实例。
让我们了解以下示例。
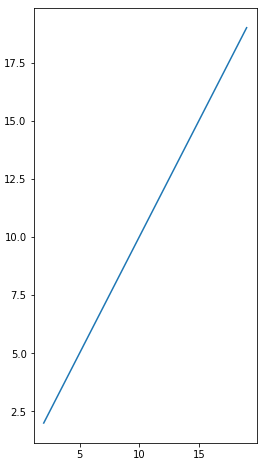
示例
import matplotlib.pyplot as plt
plt.rcParams['figure.figsize'] = (6, 12)
x = y = range(2, 20)
plt.plot(x, y)
plt.show()
输出:
结论
我们已经讨论了几种在matplotlib中改变图像大小的方法。这些图像对于数据可视化非常有用。您可以使用适合您要求的任何选项。
 极客笔记
极客笔记