如何在Matplotlib中更改图例位置
在本教程中,我们将讨论如何在Matplotlib中更改图例的位置。
首先,我们将讨论一些基本概念:
- Matplotlib是一个强大的数据可视化库,用于绘制2D数组的图表。它于2002年由John Hunter开发。Matplotlib是一个基于NumPy数组的跨平台数据可视化工具,旨在与更广泛的SciPy堆栈集成。
- 图例是描述组成图表的各种元素的空间。在Matplotlib库中,有一个名为legend()的函数,可以用来创建一个特定于坐标轴的图例。
- legend()中的Loc属性使用Loc属性来定义图例的精确位置。Loc的默认值为loc=”best”(左上角)。字符串”best”、”upper left”、”upper right”、”lower left”、”lower right”、”center left”、”center right”、”lower center”和”upper center”将把图例放置在坐标轴/图形的适当位置。
| Location String | Location String |
|---|---|
| Best | 0 |
| Upper right | 1 |
| Upper left | 2 |
| Lower left | 3 |
| Lower right | 4 |
| Right | 5 |
| Centre left | 6 |
| Centre right | 7 |
| Lower centre | 8 |
| Upper centre | 9 |
| centre | 10 |
方法
- 步骤1: 我们将导入所需的模块和库。
- 步骤2: 我们将导入或创建数据。
- 步骤3: 我们将绘制一个图表。
- 步骤4: 我们将添加图例。
- 步骤5: 我们将使用loc设置图例的位置。
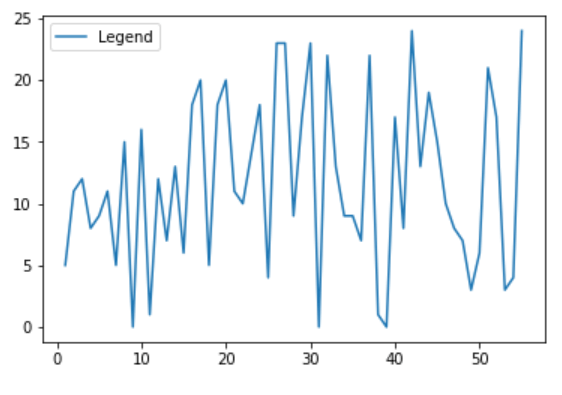
示例1
# First, we will import the required module
import numpy as npy
import matplotlib.pyplot as mplot

# Now, we will create data
x1 = npy.linspace(1, 55, 55)
npy.random.seed(1)
y1 = npy.random.randint(0, 25, 55)

# Then, we will plot graph
mplot.plot(x1, y1)

# Here, we will add legend
mplot.legend(['Legend'])
mplot.show()
输出:

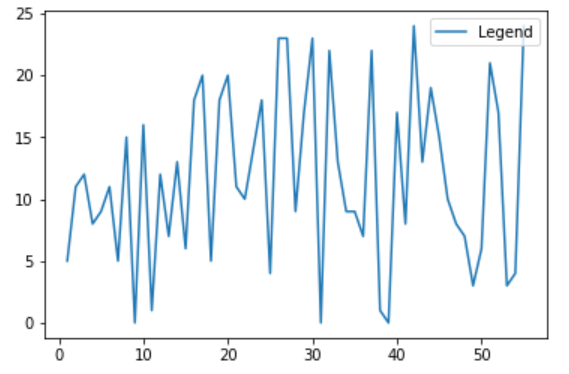
示例2:位置位于右上方
# First, we will import the required module
import numpy as npy
import matplotlib.pyplot as mplot

# Now, we will create data
x1 = npy.linspace(1, 55, 55)
npy.random.seed(1)
y1 = npy.random.randint(0, 25, 55)

# then, we will plot graph
mplot.plot(x1, y1)

# Here, we will add legend and set position to upper right
mplot.legend(['Legend'], loc = 'upper right')
mplot.show()
输出:

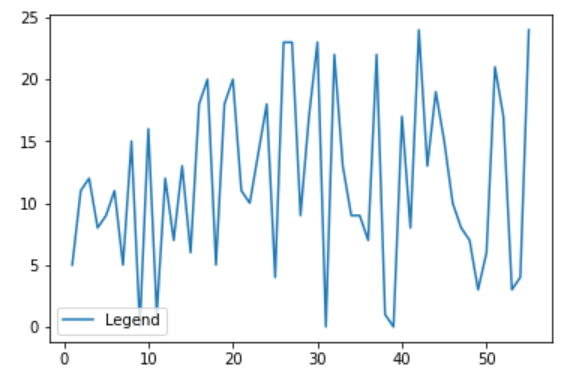
示例3:图例位于左下角,大小也为“3”
# First, we will import the required module
import numpy as npy
import matplotlib.pyplot as mplot

# Now, we will create data
x1 = npy.linspace(1, 55, 55)
npy.random.seed(1)
y1 = npy.random.randint(0, 25, 55)

# then, we will plot graph
mplot.plot(x1, y1)
# Here, we will add legend and set position to lower left That is: 3
mplot.legend(['Legend'], loc = 3)
mplot.show()
输出:

图例位于左下方
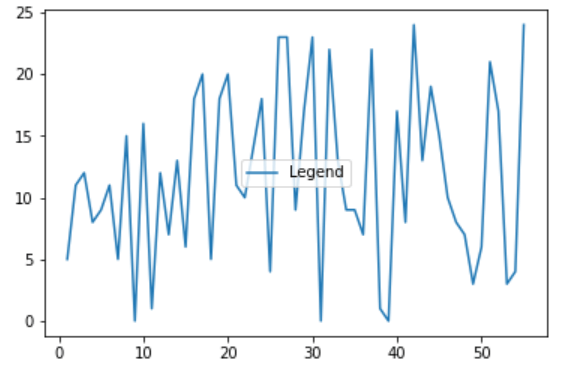
示例4:图例位置位于中心
# First, we will import the required module
import numpy as npy
import matplotlib.pyplot as mplot

# Now, we will create data
x1 = npy.linspace(1, 55, 55)
npy.random.seed(1)
y1 = npy.random.randint(0, 25, 55)

# then, we will plot graph
mplot.plot(x1, y1)

# Here, we will add legend and set position to upper left
mplot.legend(['Legend'], loc = 'center')
mplot.show()
输出:

结论
在本教程中,我们展示了如何使用Python中的Matplotlib更改图例的位置。
 极客笔记
极客笔记