如何使用Matplotlib自定义图例
在本教程中,我们将解释如何学习如何修改matplotlib的图例。Matplotlib是一种用于数据可视化的著名软件。这是一个用Python编写的图形库,并具有用于数值计算的NumPy扩展。
图例是一个说明图表上每个元素的区域。一个图表可能很直观,因为它。如果我们包括标题、X轴标签、Y轴标签和图例,那么就会更清晰。当我们查看名称时,我们可以很容易地确定图表代表什么和它表示的数据类型。
首先,让我们看看如何使用matplotlib创建一个图例。
语法:
Matplotlib中图例的语法是:
legend(*args, **kwargs)
可以通过以下术语进行描述:
- legend(): legend()函数会自动确定要显示的元素。它通过显示所有使用关键字参数”label”标记的图表来实现这一目标。
- legend(labels): 在图例中显示的X轴和Y轴的名称。
- legend(handles and labels): 添加到图例中的线条编号列表。结合labels和handles可以完全控制应在图例中包含的信息。建议legend和handles的长度相等。
代码:
# First, we will import the required modules
import matplotlib.pyplot as mplot

# Here, we will plot values
P = [2, 4, 3, 6, 5, 1]
Q = [6, 12, 19, 21, 10, 2]

# Now, we will plot using matplotlib
mplot.plot(P, label = "P")
mplot.plot(Q, label = "Q")

# Here, we will create the legend
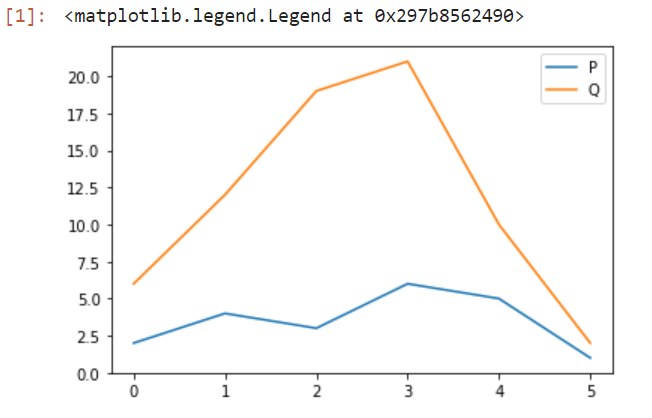
mplot.legend()
输出
如何自定义图例
图例为图表提供了含义。字体的添加,起源位置等使图例更加可见和易于识别。让我们来看看可以用来修改图例的各种程序。
位置
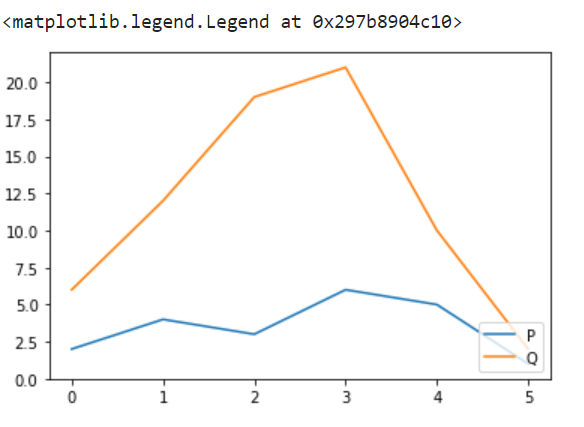
有时图例可能不正确或没有放置在正确的位置。Matplotlib允许我们指定图例的放置位置。这样,我们可以将图例放在不遮盖图表的位置。这意味着图表会显得更整洁和干净。
语法:
legend(loc = ")
以下是通过以下步骤传递它的可能性:
- “upper left”, “upper right”, “lower left”, “lower right” :它位于绘图的适当区域。
- “upper-center”, “lower center”, “center left”, “center right” :它位于中间的边缘。
- “center” :它位于地图的正中间。
- “Best” :它不与艺术家的交叉点放置。
代码:
# First, we will import the required modules
import matplotlib.pyplot as mplot

# Here, we will plot values
P = [2, 4, 3, 6, 5, 1]
Q = [6, 12, 19, 21, 10, 2]

# Now, we will plot using matplotlib
mplot.plot(P, label = "P")
mplot.plot(Q, label = "Q")

# Here, we will create the legend and add the location
mplot.legend(loc = 'lower right')
输出
字体大小
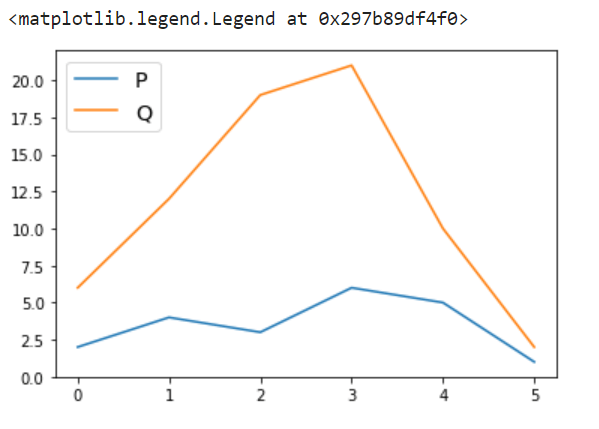
为了改善图例的外观,我们还可以改变图例的大小。通过将字体尺寸的参数与操作连接起来,我们可以像更改绘图标题一样改变图例框中的字体大小。
语法:
legend(fontsize = ")
这可以传递为’xx-small’,’x-small’,’small’,’medium’,’large’,’x-large’,’xx-large’
代码:
# First, we will import the required modules
import matplotlib.pyplot as mplot

# Here, we will plot values
P = [2, 4, 3, 6, 5, 1]
Q = [6, 12, 19, 21, 10, 2]

# Now, we will plot using matplotlib
mplot.plot(P, label = "P")
mplot.plot(Q, label = "Q")

# Here, we will create the legend and adjusting its fontsize.
mplot.legend(fontsize = 'x-large', loc = 'upper left')
输出
图例的颜色
有时候我们认为将图例框的颜色变得更加吸引人并且使其与图表区分开来会很好。Matplotlib也可以通过允许我们改变图例的外观来帮助我们,比如改变文本和背景的颜色,甚至是图例显示的边界。
语法:
legend(labelcolor = ")
- labelcolor :用于改变文本的颜色。
legend(facecolor = ")
- facecolor: 用于改变图例的背景颜色
legend(edgecolor=")
- edgecolor: 用于更改图例的边缘颜色
代码:
# First, we will import the required modules
import matplotlib.pyplot as mplot

# Here, we will plot values
P = [2, 4, 3, 6, 5, 1]
Q = [6, 12, 19, 21, 10, 2]

# Now, we will plot using matplotlib
mplot.plot(P, label = "P")
mplot.plot(Q, label = "Q")

# Here, we will create the legend and add the colour to it:
mplot.legend(labelcolor = 'Pink', facecolor = 'blue',
           edgecolor = 'Brown', fontsize = 'xx-large')
输出
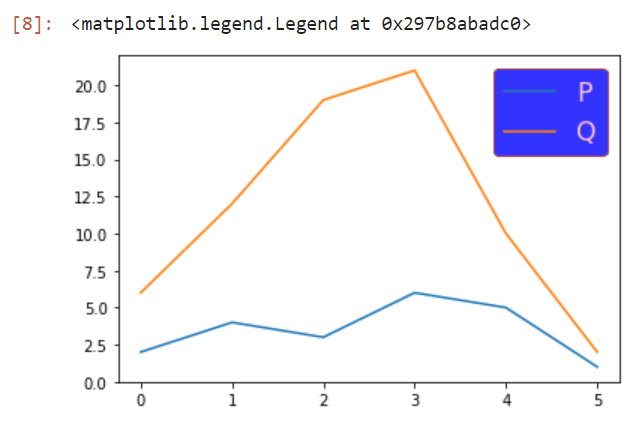
在上面的示例中,我们可以清楚地辨别出哪些参数为关键字的颜色添加到图例块中。
标记属性
这里,如果我们看到图例框,
语法:
legend(markerfirst = bool, default: True)
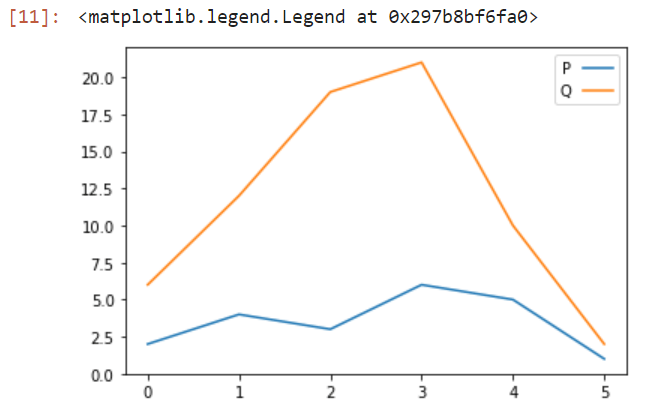
第一次放置标记,而第二次放置标签。 markerfirst参数允许我们改变标记的位置。 如果我们将其设置为False,则将交换标记和标签的位置。
代码:
# First, we will import the required modules
import matplotlib.pyplot as mplot

# Here, we will plot values
P = [2, 4, 3, 6, 5, 1]
Q = [6, 12, 19, 21, 10, 2]

# Now, we will plot using matplotlib
mplot.plot(P, label = "P")
mplot.plot(Q, label = "Q")

# Here, we will create the legend
mplot.legend(markerfirst = False)
输出
改变外观
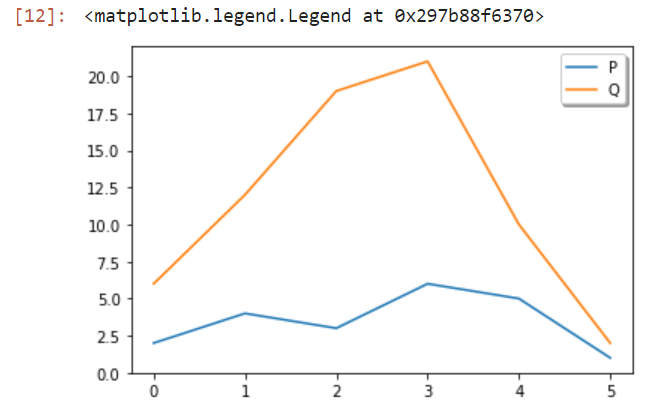
图例可以包括一些基本的CSS属性,如创建阴影、放入框架和圆角,并且让我们可以通过框架让图例成为透明的块,这样就不会遮挡细微的绘图细节。
shadow: 这个参数为图例创建阴影。
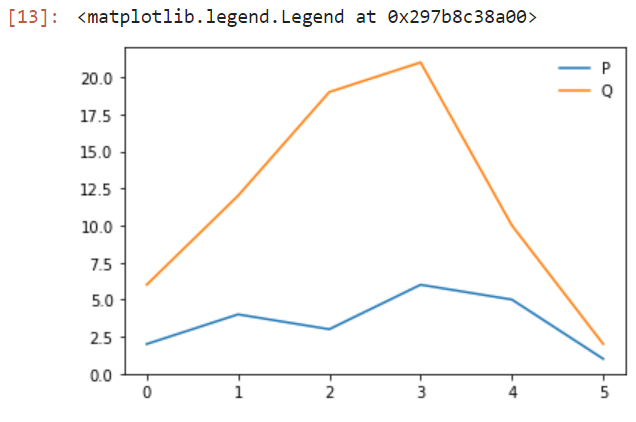
frameon: 为图例添加框架。
fancybox: 为标题提供平滑的边缘效果。
framealpha: 设置图例背景的透明度。
示例1: 为图例添加阴影和圆角:
# First, we will import the required modules
import matplotlib.pyplot as mplot

# Here, we will plot values
P = [2, 4, 3, 6, 5, 1]
Q = [6, 12, 19, 21, 10, 2]

# Now, we will plot using matplotlib
mplot.plot(P, label = "P")
mplot.plot(Q, label = "Q")
#Here, we will create the legend and adding shadow and fancybox to the legend
mplot.legend(shadow = True, fancybox = True)
输出
示例2: 移除图例框的边框:
# First, we will import the required modules
import matplotlib.pyplot as mplot

# Here, we will plot values
P = [2, 4, 3, 6, 5, 1]
Q = [6, 12, 19, 21, 10, 2]

# Now, we will plot using matplotlib
mplot.plot(P, label = "P")
mplot.plot(Q, label = "Q")
#Here, we will create the legend and removing frame
mplot.legend(frameon = False)
输出
图例标题
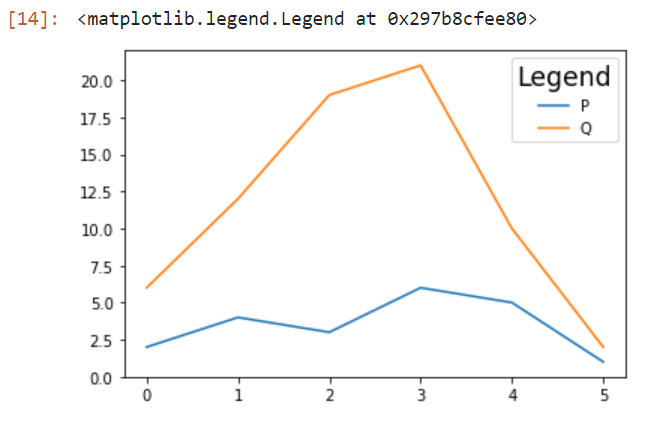
将标题添加到图例中对于包含在图例框中非常重要。标题参数让我们可以创建一个标题图例,而title_size参数可以让我们选择特定的名称字体大小。
语法:
legend(title= "" , title_fontsize = "")
标题: 它将为图例提供标题
标题字体大小: 它将为标题提供大小
可以是’xx-small’、’x-small’、’small’、’medium’、’large’、’x-large’、’xx-large’
代码:
# First, we will import the required modules
import matplotlib.pyplot as mplot

# Here, we will plot values
P = [2, 4, 3, 6, 5, 1]
Q = [6, 12, 19, 21, 10, 2]

# Now, we will plot using matplotlib
mplot.plot(P, label = "P")
mplot.plot(Q, label = "Q")
#Here, we will create the legend and give title and fontsize:
mplot.legend(title = "Legend", title_fontsize = 'xx-large')
输出
结论
在本教程中,我们讨论了如何自定义图例,如添加标题、阴影、删除边框、改变字体大小和颜色等。
 极客笔记
极客笔记