机器学习 学习曲线
机器学习的核心是教会计算机学习模式并进行无需明确编程的决策。它通过提供能够解决复杂问题的智能系统而在几个行业引起了革命。机器学习中经常被忽视的一个关键方面是学习曲线的概念。这些曲线反映了模型在时间推移中改进其预测能力的基本过程。在本文中,我们将使用创造性的示例和详细说明探索机器学习中学习曲线的有趣世界。
机器学习中的学习曲线
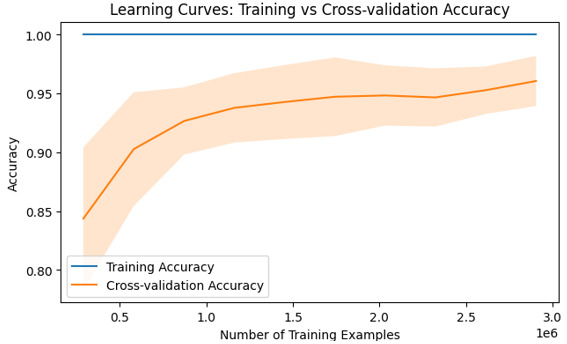
学习曲线是可视化的图形表示,显示模型性能随数据集大小增加或训练进展而变化。通常以绘制训练和测试数据上的模型错误率随各种样本大小或迭代次数变化的图表形式呈现,它们提供了有关模型泛化效果如何的有价值见解。
富有洞察力的旅程
想象一下踏上一场冒险,穿越未知领域的旅程。深入机器学习精彩领域的复杂算法和方法也是如此。
考虑使用越来越多的标记数据对图像分类算法进行训练,最初从少量数据开始,逐渐向由几千到数百万张图片组成的更大数据集尺寸发展。在这个旅程中,机器适应识别给定数据集中的模式,起初从简单开始,随着从附加样本获得更多知识的进展而逐渐发展为更复杂的模式。
初始阶段 – 高偏差(欠拟合)
当我们的虚构图像分类器只使用有限数量的观察结果(比如100张图片)来处理初始任务时,由于高偏差或欠拟合问题,它可能会表现出较差的泛化能力。过于简单的表示无法捕捉更大数据集中存在的重要细微差别,就像试探性地沿着未知路径导航,由于信息不足而无法得出准确的预测或分类。
中期阶段 – 最佳平衡
在进一步深入远征中,需要向算法提供逐渐增加的标记数据集,包括数以千计(如10,000)的图像。在这个阶段,学习者努力在捕捉内在模式和避免过度概括或过于复杂之间找到最佳平衡。随着模型吸收更多知识,它的学习曲线逐渐趋于平稳,训练错误率趋于平台,而测试错误率逐渐减少。这个阶段代表了一个重要的里程碑,意味着模型具有良好的泛化能力,能够处理新的未知数据。
高级阶段 – 高方差(过拟合)
进入机器学习奥德赛的最深部分,将面临由数百万(或更多)标记图像组成的高度多样化的数据集带来的新挑战。
Python代码 – 在机器学习中使用学习曲线
学习曲线是机器学习工具包中不可缺少的工具,可以释放算法性能的真正潜力。
步骤
步骤1: 导入必要的库(scikit-learn,matplotlib)。
步骤2: 使用scikit-learn的load_digits()函数加载数字数据集。
步骤3: 将特征和标签分别赋给X和Y。
步骤4: 使用scikit-learn的learning_curve()函数生成学习曲线。
- 使用线性核函数作为支持向量分类器(SVC)
-
使用10倍交叉验证
-
使用准确率作为评分指标
-
将训练集样本大小从10%变化到100%
步骤5: 计算每个训练大小在交叉验证中的训练集得分和测试集得分的均值和标准差
步骤6: 绘制平均训练准确率与训练样本数量的图形,用标准差进行阴影(以增加透明度)
步骤7: 绘制平均交叉验证准确率与训练样本数量的图形,用标准差进行阴影(以增加透明度)
步骤8: 添加坐标轴标签和图标题,显示图形
例子
#Importing the required libraries that is load_digits, learning_curve, SVC (Support Vector Classifier), matplotlib
from sklearn.datasets import load_digits
from sklearn.model_selection import learning_curve
from sklearn.svm import SVC
import matplotlib.pyplot as plt
import numpy as np

#Loading the digits dataset and storing in digits variable
digits = load_digits()
#Storing the features to the variables
X, y = digits.data, digits.target

#The learning curve is generated using the required function
train_sizes, train_scores, test_scores = learning_curve(
#linear kernel is used for SVC
    SVC(kernel='linear'), X, y,
#cv is assigned with value 10-fold cross validation
    cv=10,
#Scoring variable is assigned to hold scoring metric
    scoring='accuracy',
#Using the parallel processing
    n_jobs=-1,
#By interchanging the training size from 10% to 100%
    train_sizes=np.linspace(0.1, 1.0, 10),
)
#To get the mean of the training scores
train_mean = np.mean(train_scores, axis=1)
#To get the standard deviation of the training scores
train_std = np.std(train_scores, axis=1)
#To get the mean test scores across folds
test_mean = np.mean(test_scores, axis=1)
#To get the standard deviation test scores across folds
test_std = np.std(test_scores, axis=1)
#It plots the graph between training accuracy vs number of training examples
plt.plot(train_sizes * len(y), train_mean,label="Training Accuracy")
#filling the area between mean and standard deviation with alpha 0.2
plt.fill_between(train_sizes * len(y), train_mean - train_std,
                 train_mean + train_std,alpha=0.2)
#It plots the graph between cross-validation accuracy vs number of training examples
plt.plot(train_sizes * len(y), test_mean,label="Cross-validation Accuracy")
# filling the area between mean and standard deviation with alpha 0.2
plt.fill_between(train_sizes * len(y), test_mean - test_std,
                 test_mean + test_std,alpha=0.2)
#Plotting the x axis with Number of training examples
plt.xlabel("Number of Training Examples")
#Plotting the y axis with accuracy
plt.ylabel("Accuracy")
#The plot with title “Learning curves: Training vs Cross-Validation Accuracy”
plt.title("Learning Curves: Training vs Cross-validation Accuracy")
#Adding the legends and displaying the output
plt.legend()
plt.show()
输出

结论
在机器学习中,理解学习曲线是至关重要的,因为它们可以洞察我们的模型在不同数据集大小或复杂性水平下的性能趋势。通过使用上述Python代码可视化错误率与样本大小之间的关系,研究人员可以诊断常见的问题,如过拟合或欠拟合,并在优化模型方面做出明智的决策。
 极客笔记
极客笔记