如何在Matplotlib中更改绘图大小
在数据可视化中,绘图是以视觉形式呈现数据的最有效方法。如果绘制不够详细,可能会显得复杂。Python有 Matplotlib 用于以绘图形式表示数据。
用户在创建绘图时应优化绘图的大小。在本教程中,我们将讨论根据用户的要求尺寸更改默认绘图大小的各种方法,或者调整给定的绘图大小。
方法1:使用set_figheight()和set_figwidth()
用户可以使用 set_figheight() 来更改绘图的高度, set_figwidth() 来更改绘图的宽度。
示例:
# first, import the matplotlib library
import matplotlib.pyplot as plot

# The values on x-axis
x_axis = [10, 20, 30, 40, 50, 60, 70, 80, 90, 100]
# The values on y-axis
y_axis = [10, 20, 30, 40, 50, 60, 70, 80, 90, 100]

# Now, name the x and y axis
plot.xlabel('X - AXIS')
plot.ylabel('Y - AXIS')

#Then, plot the line plot with its default size
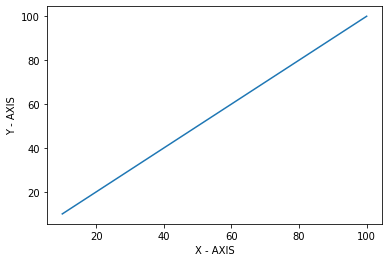
print ("The plot is plotted in its default size: ")
plot.plot(x_axis, y_axis)
plot.show()

# Now, plot the line plot after changing the size of its width and height
K = plot.figure()
K.set_figwidth(5)
K.set_figheight(2)

print ("The plot is plotted after changing its size: ")
plot.plot(x_axis, y_axis)
plot.show()
输出:
The plot is plotted in its default size:

The plot is plotted after changing its size:

方法2:使用figsize()函数
figsize() 函数接受两个参数,即宽度和高度(以英寸为单位)。默认情况下,宽度的值为 6.4英寸 ,高度的值为 4.8英寸 。
语法:
Plot.figure(figsize = (x_axis, y_axis)
在这里, x_axis 代表宽度, y_axis 代表高度,单位为英寸。
示例:
# First, import the matplotlib library
import matplotlib.pyplot as plot

# The values on x-axis
x_axis = [10, 20, 30, 40, 50, 60, 70, 80, 90, 100]
# The values on y-axis
y_axis = [10, 20, 30, 40, 50, 60, 70, 80, 90, 100]

#Then, plot the line plot with its default size
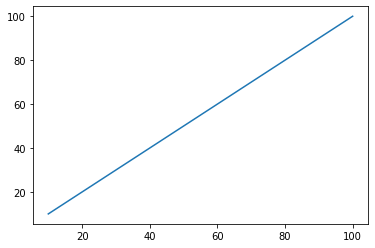
print ("The plot is plotted in its default size: ")
plot.plot(x_axis, y_axis)
plot.show()

# Now, plot the line plot after changing the size of figure to 3 X 3
plot.figure(figsize = (3, 3))
print ("The plot is plotted after changing its size: ")
plot.plot(x_axis, y_axis)
plot.show()
输出:
The plot is plotted in its default size:

The plot is plotted after changing its size:

方法3:通过更改默认的rcParams
用户可以根据自己的需求通过设置figure.figsize来永久性地更改图形的默认大小。
示例:
# First, import the matplotlib library
import matplotlib.pyplot as plot

# The values on x-axis
x_axis = [10, 20, 30, 40, 50, 60, 70, 80, 90, 100]
# The values on y-axis
y_axis = [10, 20, 30, 40, 50, 60, 70, 80, 90, 100]

# now, name the x axis
plot.xlabel('X - AXIS')
# name the y axis
plot.ylabel('Y - AXIS')

#Then, plot the line plot with its default size
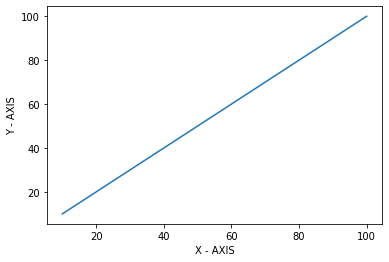
print ("The plot is plotted in its default size: ")
plot.plot(x_axis, y_axis)
plot.show()

# Now, change the rc parameters and plot the line plot after changing the size.
plot.rcParams['figure.figsize'] = [3, 3]

print ("The plot is plotted after changing its size: ")
plot.plot(x_axis, y_axis)
plot.show()

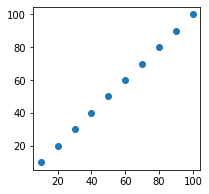
plot.scatter(x_axis, y_axis)
plot.show()
输出:
The plot is plotted in its default size:

The plot is plotted after changing its size:


 极客笔记
极客笔记