以Python实现的DBSCAN算法
在本教程中,我们将学习如何在Python中实现和使用DBSCAN算法。
1996年,密度聚类算法DBSCAN(Density-Based Spatial Clustering of Applications with Noise)首次提出,并于2014年获得“时光考验”奖。DBSCAN在数据挖掘会议KDD上获得了“时光考验”奖。我们将不在这里学习DBSCAN算法,只讨论其在Python中的实现。但是,如果我们要理解DBSCAN算法的实现,我们至少应该对它有一个基本的了解。因此,如果您不知道DBSCAN算法是什么或者它是如何工作的,请先了解DBSCAN算法及其工作原理。
Python中DBSCAN算法的实现
我们将在这一部分中执行DBSCAN算法的实现操作,并且我们将按步骤进行,以便于理解和学习。在这个实现过程中,我们将使用一个数据集执行各种操作(包括在DBSCAN算法中进行的操作)。在我们开始实现过程之前,我们应该满足实现DBSCAN算法的先决条件。
实现DBSCAN算法的先决条件
在本教程中,我们在进行DBSCAN算法的实现部分之前需要满足以下先决条件:
1. Numpy库: 我们应确保我们的系统已安装numpy库,并且是最新版本,因为我们将在实现过程中对numpy库上的数据集使用函数。如果我们的系统中没有numpy库,或者之前没有安装过,我们可以在命令提示符终端中使用以下命令来安装它:
pip install numpy

当我们按下回车键时,numpy库开始在我们的系统中安装。

在一段时间后,我们会发现numpy库已经成功安装在我们的系统中(在这里,我们已经在我们的系统中安装了numpy库)。
2. Panda库: 与numpy库类似,panda库也是我们系统中必须存在的库,如果在我们的系统中没有安装它,我们可以使用以下命令在命令提示符终端中使用pip安装它:
pip install pandas
3. matplotlib 库: 在 DBSCAN 算法的实现过程中,matplotlib 库也是一个重要的库,该库的函数可以帮助我们显示数据集的结果。如果我们的系统中没有安装 matplotlib 库,我们可以使用以下命令在命令提示符终端中使用 pip 安装它:
pip install matplotlib
4. Sklearn库: Sklearn库将会成为DBSCAN算法实施操作中的主要需求之一,因为我们需要从Sklearn库中导入各种模块,如预处理、分解等。因此,我们应该确保Sklearn库是否存在于我们的系统中,如果没有,则可以使用以下命令在命令提示符终端中使用pip安装:
pip install matplotlib
5. 最后但同样重要的是,我们还应该了解 DBSCAN 算法(是什么以及它的工作原理),正如我们已经讨论过的,这样我们就能轻松理解其在 Python 中的实现。
在我们继续之前,我们应该确保我们已经满足了上面列出的先决条件,这样我们在按照实现步骤进行操作时就不会遇到任何问题。
DBSCAN 算法的实现步骤
现在,我们将在 Python 中执行 DBSCAN 算法的实现。然而,我们将按照之前提到的步骤进行操作,这样实现部分就不会变得复杂,我们可以很容易地理解它。为了实现 DBSCAN 算法和其逻辑,我们必须按照以下步骤在 Python 程序中进行操作:
步骤1:导入所有必需的库:
首先,我们必须导入在先决条件部分中安装的所有必需库,这样我们在实现 DBSCAN 算法时就可以使用它们的函数。
在这里,我们首先导入了程序中所有必需的库或库的模块:
# Importing numpy library as nmp
import numpy as nmp
# Importing pandas library as pds
import pandas as pds
# Importing matplotlib library as pplt
import matplotlib.pyplot as pplt
# Importing DBSCAN from cluster module of Sklearn library
from sklearn.cluster import DBSCAN
# Importing StandardSclaer and normalize from preprocessing module of Sklearn library
from sklearn.preprocessing import StandardScaler
from sklearn.preprocessing import normalize
# Importing PCA from decomposition module of Sklearn
from sklearn.decomposition import PCA
步骤2:加载数据:
在这一步中,我们需要加载数据,我们可以通过在程序中导入或加载需要在DBSCAN算法上工作的数据集来实现。要在程序中加载数据集,我们将使用pandas库的 read.csv() 函数,并打印数据集的信息,如下所示:
# Loading the data inside an initialized variable
M = pds.read_csv('sampleDataset.csv') # Path of dataset file
# Dropping the CUST_ID column from the dataset with drop() function
M = M.drop('CUST_ID', axis = 1)
# Using fillna() function to handle missing values
M.fillna(method ='ffill', inplace = True)
# Printing dataset head in output
print(M.head())
输出:
       BALANCE  BALANCE_FREQUENCY  ...  PRC_FULL_PAYMENT  TENURE
0    40.900749           0.818182  ...          0.000000      12
1  3202.467416           0.909091  ...          0.222222      12
2  2495.148862           1.000000  ...          0.000000      12
3  1666.670542           0.636364  ...          0.000000      12
4   817.714335           1.000000  ...          0.000000      12

[5 rows x 17 columns]
数据将在我们运行程序时打印出来,并且我们将在从加载的数据集文件中处理这些数据。
步骤3:数据预处理:
现在,我们将在这一步中使用Sklearn库的预处理模块的函数来预处理数据集的数据。在使用Sklearn库函数进行数据预处理时,我们必须使用以下技术:
# Initializing a variable with the StandardSclaer() function
scalerFD = StandardScaler()
# Transforming the data of dataset with Scaler
M_scaled = scalerFD.fit_transform(M)
# To make sure that data will follow gaussian distribution
# We will normalize the scaled data with normalize() function
M_normalized = normalize(M_scaled)
# Now we will convert numpy arrays in the dataset into dataframes of panda
M_normalized = pds.DataFrame(M_normalized)
步骤4:减少数据的维度:
在这一步骤中,我们将减少经过缩放和归一化的数据维度,以便在程序内可以轻松地可视化数据。为了转换数据并减少其维度,我们必须以以下方式使用PCA函数:
# Initializing a variable with the PCA() function
pcaFD = PCA(n_components = 2) # components of data
# Transforming the normalized data with PCA
M_principal = pcaFD.fit_transform(M_normalized)
# Making dataframes from the transformed data
M_principal = pds.DataFrame(M_principal)
# Creating two columns in the transformed data
M_principal.columns = ['C1', 'C2']
# Printing the head of the transformed data
print(M_principal.head())
输出:
         C1        C2
0 -0.489949 -0.679976
1 -0.519099  0.544828
2  0.330633  0.268877
3 -0.481656 -0.097610
4 -0.563512 -0.482506
如我们在输出中所看到的,我们使用PCA将归一化的数据转换成了两个分量,即两列(我们可以在输出中看到它们)。然后,我们使用panda库 dataframe() 函数从转换后的数据创建了数据框。
步骤5:构建聚类模型:
现在,这是实施中最重要的一步,因为我们需要建立一个聚类模型来处理数据(我们对其进行操作)。我们可以通过使用Sklearn库中的DBSCAN函数来实现这一点,如下所示:
# Creating clustering model of the data using the DBSCAN function and providing parameters in it
db_default = DBSCAN(eps = 0.0375, min_samples = 3).fit(M_principal)
# Labelling the clusters we have created in the dataset
labeling = db_default.labels_
步骤6:可视化聚类模型:
# Visualization of clustering model by giving different colours
colours = {}
# First colour in visualization is green
colours[0] = 'g'
# Second colour in visualization is black
colours[1] = 'k'
# Third colour in visualization is red
colours[2] = 'r'
# Last colour in visualization is blue
colours[-1] = 'b'
# Creating a colour vector for each data point in the dataset cluster
cvec = [colours[label] for label in labeling]
# Construction of the legend
# Scattering of green colour
g = pplt.scatter(M_principal['C1'], M_principal['C2'], color ='g');
# Scattering of black colour
k = pplt.scatter(M_principal['C1'], M_principal['C2'], color ='k');
# Scattering of red colour
r = pplt.scatter(M_principal['C1'], M_principal['C2'], color ='r');
# Scattering of green colour
b = pplt.scatter(M_principal['C1'], M_principal['C2'], color ='b');
# Plotting C1 column on the X-Axis and C2 on the Y-Axis
# Fitting the size of the figure with figure function
pplt.figure(figsize =(9, 9))
# Scattering the data points in the Visualization graph
pplt.scatter(M_principal['C1'], M_principal['C2'], c = cvec)
# Building the legend with the coloured data points and labelled
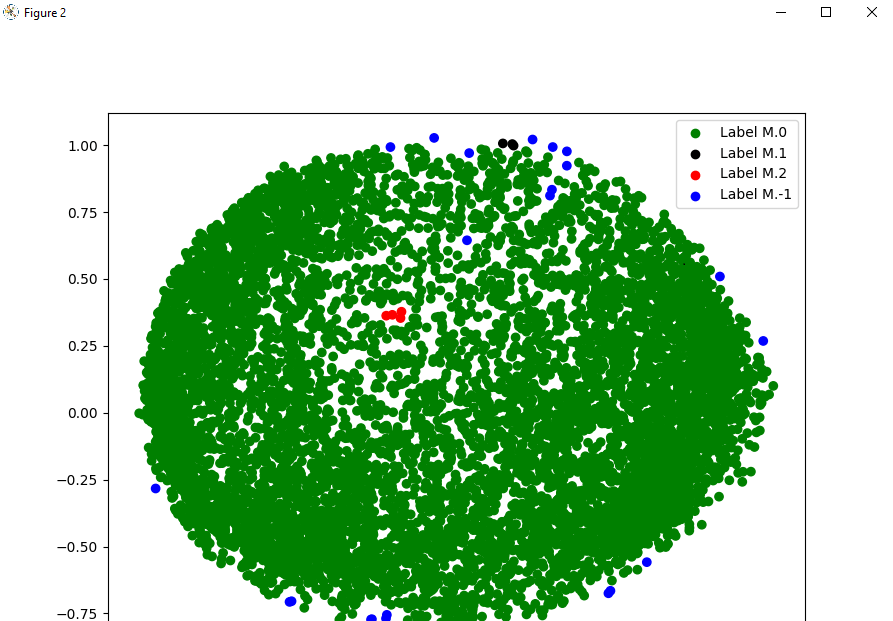
pplt.legend((g, k, r, b), ('Label M.0', 'Label M.1', 'Label M.2', 'Label M.-1'))
# Showing Visualization in the output
pplt.show()
输出:

正如我们在输出中所看到的,我们使用数据集的数据点绘制了图形,并通过使用不同颜色为数据点进行标记来可视化聚类。
步骤7:调整参数:
在这一步中,我们将通过更改之前在DBSCAN函数中给定的参数来调整模块的参数,具体如下:
# Tuning the parameters of the model inside the DBSCAN function
dts = DBSCAN(eps = 0.0375, min_samples = 50).fit(M_principal)
# Labelling the clusters of data points
labeling = dts.labels_
步骤8:可视化变化:
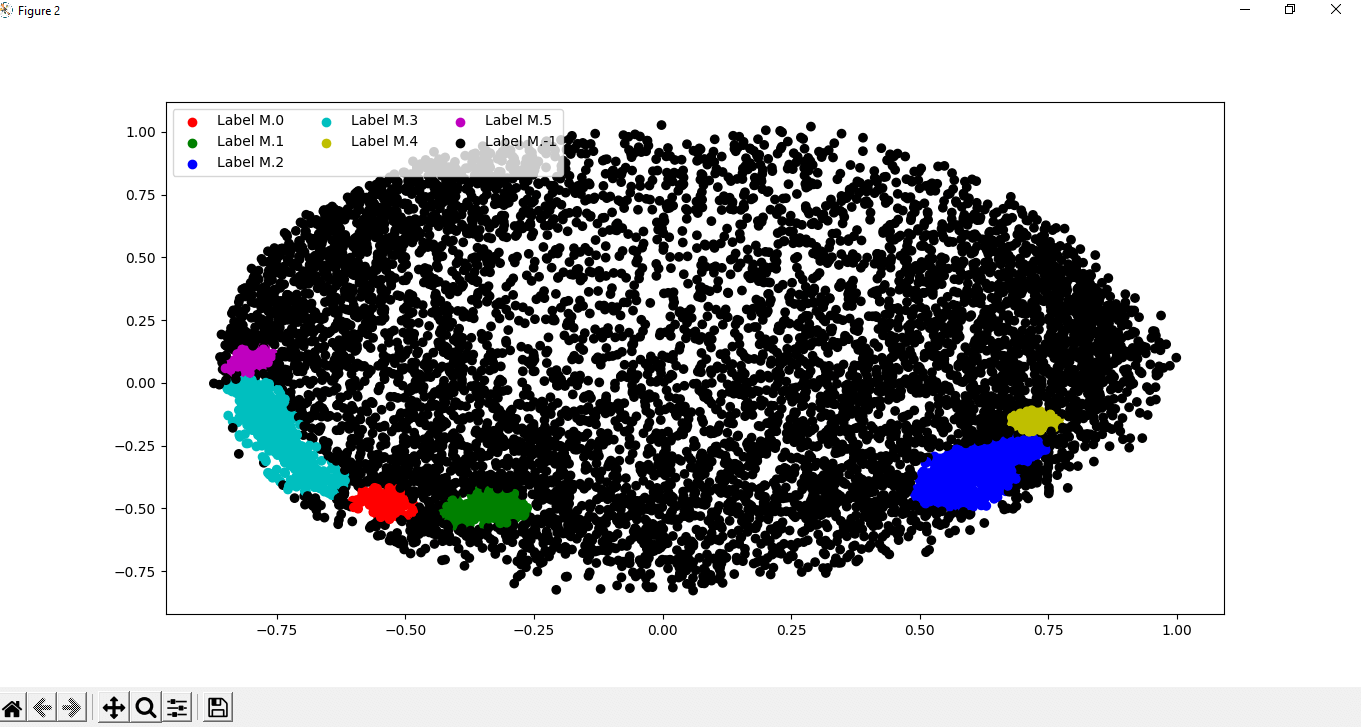
现在,在调整我们创建的聚类模型的参数之后,我们将通过将数据点在数据集中标记为不同的颜色来可视化聚类中的变化,就像我们之前做过的那样。
# Labelling with different colours
colours1 = {}
# labelling with Red colour
colours1[0] = 'r'
# labelling with Green colour
colours1[1] = 'g'
# labelling with Blue colour
colours1[2] = 'b'
colours1[3] = 'c'
# labelling with Yellow colour
colours1[4] = 'y'
# Magenta colour
colours1[5] = 'm'
# labelling with Black colour
colours1[-1] = 'k'
# Labelling the data points with the colour variable we have defined
cvec = [colours1[label] for label in labeling]
# Defining all colour that we will use
colors = ['r', 'g', 'b', 'c', 'y', 'm', 'k' ]
# Scattering the colours onto the data points
r = pplt.scatter(
        M_principal['C1'], M_principal['C2'], marker ='o', color = colors[0])
g = pplt.scatter(
        M_principal['C1'], M_principal['C2'], marker ='o', color = colors[1])
b = pplt.scatter(
        M_principal['C1'], M_principal['C2'], marker ='o', color = colors[2])
c = pplt.scatter(
        M_principal['C1'], M_principal['C2'], marker ='o', color = colors[3])
y = pplt.scatter(
        M_principal['C1'], M_principal['C2'], marker ='o', color = colors[4])
m = pplt.scatter(
        M_principal['C1'], M_principal['C2'], marker ='o', color = colors[5])
k = pplt.scatter(
        M_principal['C1'], M_principal['C2'], marker ='o', color = colors[6])
# Fitting the size of the figure with figure function
pplt.figure(figsize =(9, 9))
# Scattering column 1 into X-axis and column 2 into y-axis
pplt.scatter(M_principal['C1'], M_principal['C2'], c = cvec)
# Constructing a legend with the colours we have defined
pplt.legend((r, g, b, c, y, m, k),
           ('Label M.0', 'Label M.1', 'Label M.2', 'Label M.3', 'Label M.4','Label M.5', 'Label M.-1'), # Using different labels for data points
           scatterpoints = 1, # Defining the scatter point
           loc ='upper left', # Location of cluster scattering
           ncol = 3, # Number of columns
           fontsize = 10) # Size of the font
# Displaying the visualisation of changes in cluster scattering
pplt.show()
结果:

通过调整DBSCAN函数的参数并观察输出,我们可以清楚地观察到数据点的聚类散射发生的变化。通过观察这些变化,我们还可以了解DBSCAN算法的工作原理以及它在数据集中可视化数据点的聚类散射方面的帮助。
 极客笔记
极客笔记