在画布里创建多个子图,有很多方法,但常常使用这两个subplots和subplot函数来创建多个子图,它们都能实现相同的功能,但是它们的使用上还是有点区别。
matplotlib.pyplot.subplots(nrows=1, ncols=1, *, sharex=False, sharey=False, squeeze=True, subplot_kw=None, gridspec_kw=None, **fig_kw)创建一个画布和一个或多个子图返回。
matplotlib.pyplot.subplot(*args, **kwargs)添加一个子图到当前画布,它会删除前面覆盖的子图。
如果想一次性地创建多个子图,就使用subplots函数,如果想一个一个地添加子图,就使用subplot函数,这是它们的主要区别。下面通过例子来演示两个函数使用,实现相同的功能。
先来看subplots函数的例子:
import numpy as np
import matplotlib.pyplot as plt

x1 = np.linspace(0.0, 5.0)
x2 = np.linspace(0.0, 2.0)

y1 = np.cos(2 * np.pi * x1) * np.exp(-x1)
y2 = np.cos(2 * np.pi * x2)

fig, (ax1, ax2) = plt.subplots(2, 1)
fig.suptitle('A tale of 2 subplots')

ax1.plot(x1, y1, 'o-')
ax1.set_ylabel('Damped oscillation')

ax2.plot(x2, y2, '.-')
ax2.set_xlabel('time (s)')
ax2.set_ylabel('Undamped')

plt.show()
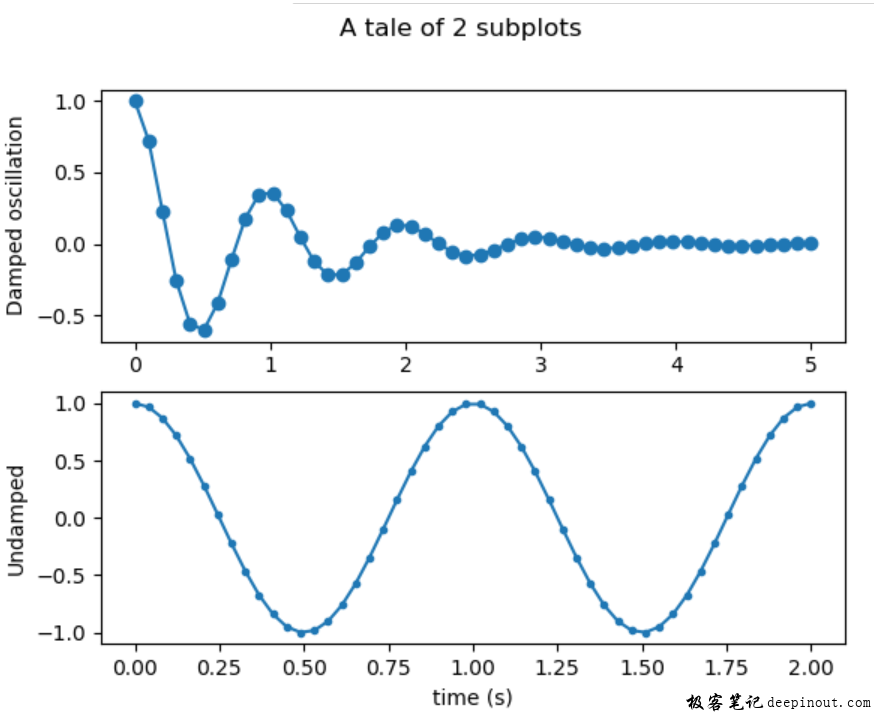
在上面的例子里,先用numpy的分割函数创建两个X轴的坐标,然后构造两个余弦波形数据,这样就完成了显示数据的准备工作。
接着通过下面这行创建多个子图:
fig, (ax1, ax2) = plt.subplots(2, 1)紧接着添加一个标题到画布中间,绘制两条曲线,依次设置坐标轴的标题。最后结果显示如下:

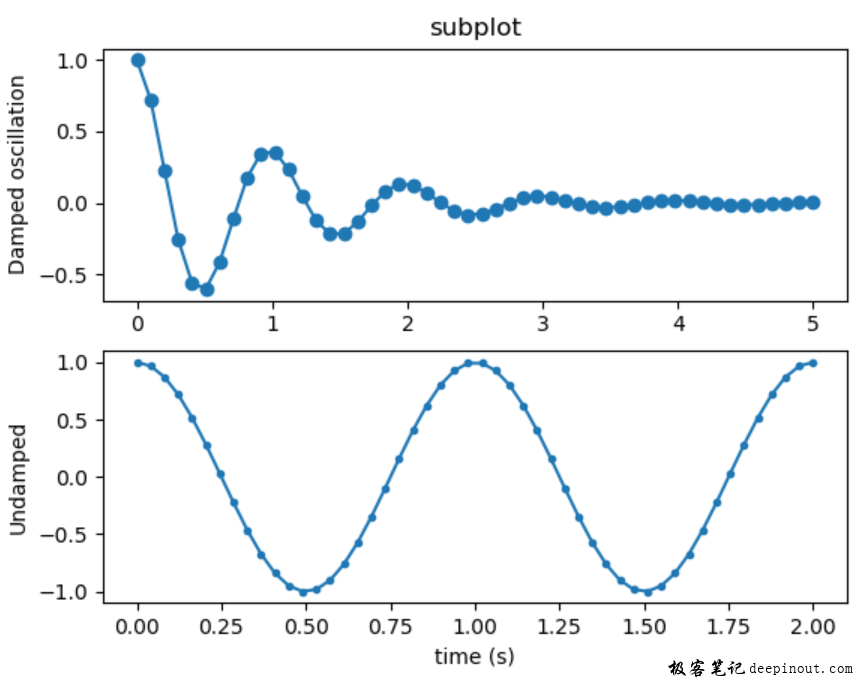
现在来看subplot()函数的例子,其实现显示的内容跟前面的例子是一样的,整个代码如下:
import numpy as np
import matplotlib.pyplot as plt

x1 = np.linspace(0.0, 5.0)
x2 = np.linspace(0.0, 2.0)

y1 = np.cos(2 * np.pi * x1) * np.exp(-x1)
y2 = np.cos(2 * np.pi * x2)

plt.subplot(2, 1, 1)
plt.plot(x1, y1, 'o-')
plt.title('subplot')
plt.ylabel('Damped oscillation')

plt.subplot(2, 1, 2)
plt.plot(x2, y2, '.-')
plt.xlabel('time (s)')
plt.ylabel('Undamped')

plt.show()
结果如下:

 极客笔记
极客笔记