Matplotlib 函数xlabel()——设置x轴的标签文本。
Matplotlib 函数xlabel() 功能描述
设置x轴的标签文本。
Matplotlib 函数xlabel() 用法
plt.xlabel(string)参数说明
- string:标签文本内容。
- 平移性:上面的函数功能,调用签名和参数说明同样可以平移到函数ylabel()上。
Matplotlib 函数xlabel() 示例
import matplotlib.pyplot as plt
import numpy as np
x = np.linspace(0.05,10,1000)
y = np.sin(x)
plt.figure('deepinout.com 极客笔记')
plt.plot(x,y,ls="-.",lw=2,c="c",label="plot figure")
plt.legend()
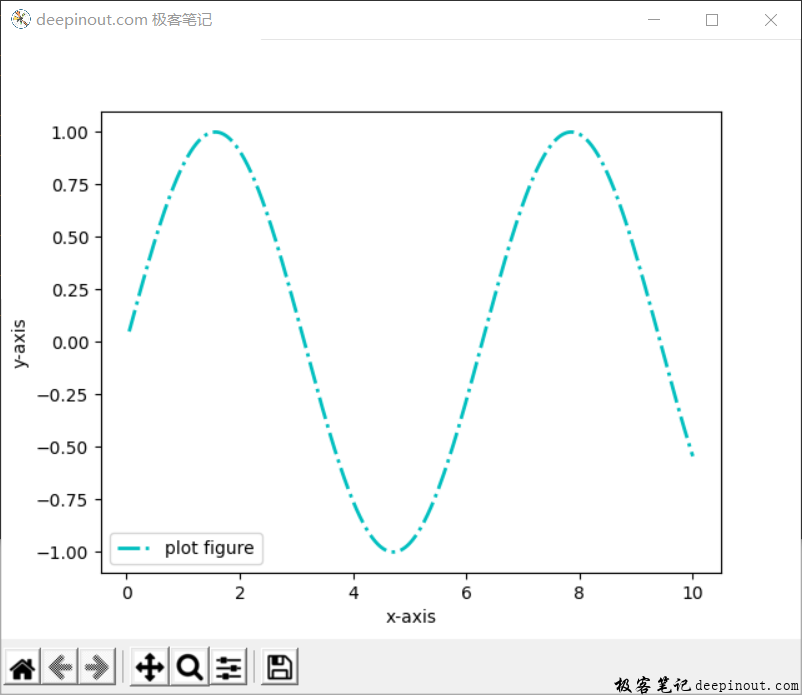
plt.xlabel("x-axis")
plt.ylabel("y-axis")
plt.show()
运行结果:

 极客笔记
极客笔记