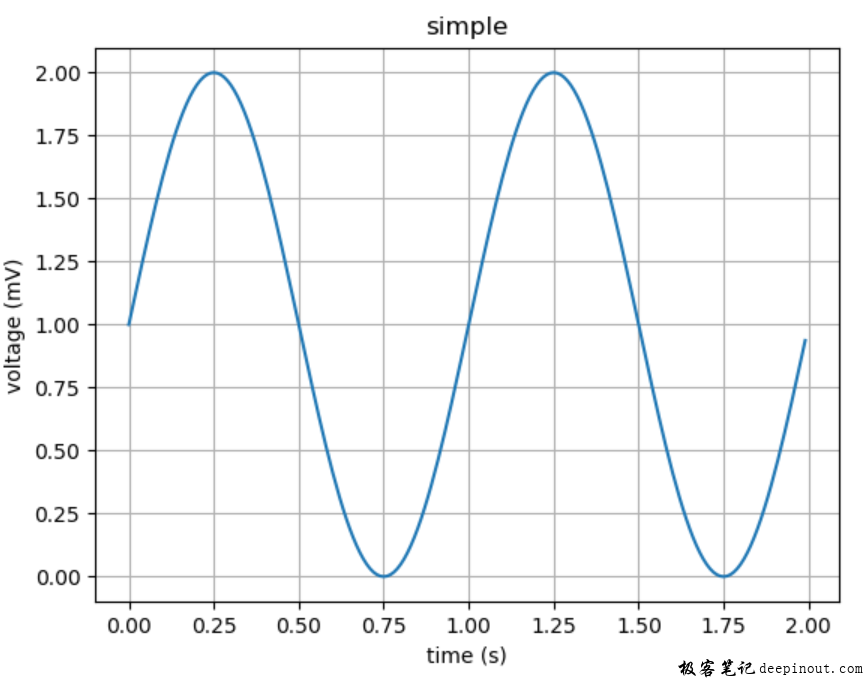
怎么样使用函数plot()来创建一个带有文本标签的折线图?下面这个例子就来解决这个问题。
这里使用到的相关函数有:
matplotlib.axes.Axes.plot
matplotlib.pyplot.plot
matplotlib.pyplot.subplots
matplotlib.figure.Figure.savefig
先来显示结果图:

这个例子非常简单,先调用用numpy的函数生成一个数组,然后调用正弦函数对数组进行计算,这样就准备好数据了,接着下来就调用subplots函数创建画布和坐标系,进而调用plot函数画出折线图。为了显示坐标轴里的网格,调用函数grid()。最后调用函数savefig保存png文件,这样就可以永久保存了。
整个例子代码如下:
import matplotlib.pyplot as plt
import numpy as np

# 创建画折线图的数据
t = np.arange(0.0, 2.0, 0.01)
s = 1 + np.sin(2 * np.pi * t)

fig, ax = plt.subplots()
ax.plot(t, s)

ax.set(xlabel='time (s)', ylabel='voltage (mV)',
       title='simple')
ax.grid()

fig.savefig("test.png")
plt.show() 极客笔记
极客笔记