Matplotlib 函数hist()——用于绘制直方图。
Matplotlib 函数hist() 功能描述
在x轴上绘制定量数据的分布特征。
Matplotlib 函数hist() 用法
plt.hist(x)参数说明
- x:在x轴上绘制箱体的定量数据输入值。
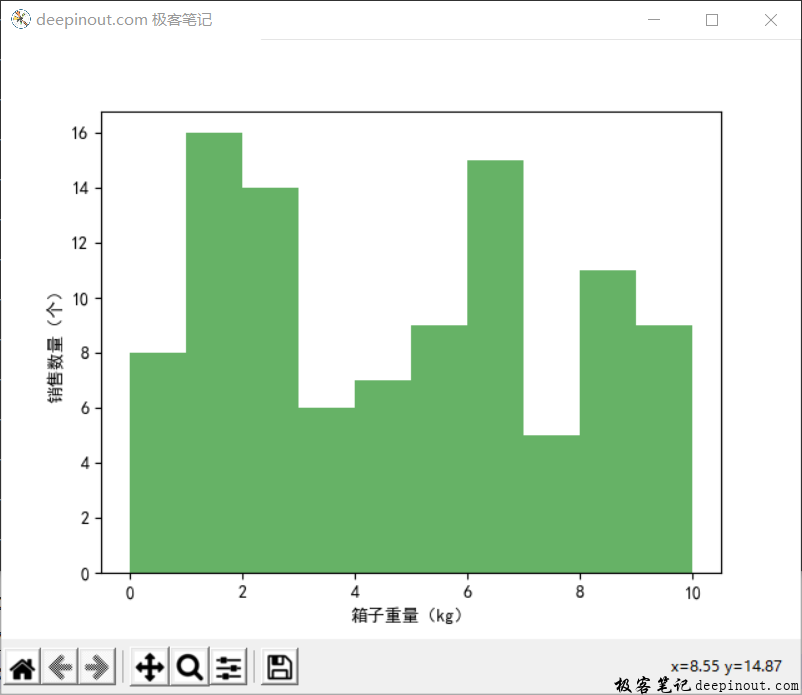
Matplotlib 函数hist() 示例
# -*- coding:utf-8 -*
import matplotlib as mpl
mpl.rcParams["font.sans-serif"]=["SimHei"]
mpl.rcParams["axes.unicode_minus"]=False
import matplotlib.pyplot as plt
import numpy as np
# set test scores
boxWeight = np.random.randint(0,10,100)
x = boxWeight
# plot histogram
bins = range(0,11,1)
plt.figure('deepinout.com 极客笔记')
plt.hist(x,bins=bins,
color="g",
histtype="bar",
rwidth=1,
alpha=0.6)
# set x,y-axis label
plt.xlabel("箱子重量(kg)")
plt.ylabel("销售数量(个)")
plt.show()
运行结果如图所示。

 极客笔记
极客笔记