Matplotlib 使用patches绘制几何图形学习了patches模块,也知道了一些简单使用,但是知识要在应用中才发现它的好处。本文就来演示Wedge的使用,使用它来实现饼图。饼图最合适用来表示百分比了,因为一个圆就表示百分之百,某一部分就可以使用扇形来表示,这样看起来就比较明了,占得多的面积的就是百分比大的。当然,也可以直接使用matplotlib里的饼图来实现,但是这里主要是演示Wedge模块。当你需自定义一些数据图时,就可以采用类似的方法来实现,也就是实现自定义图表,这样灵活性更大。如果你掌握了这种方法,应付各种实验的论文,各种课堂演示的稿件,都会得心应手,真正做到图文并茂。
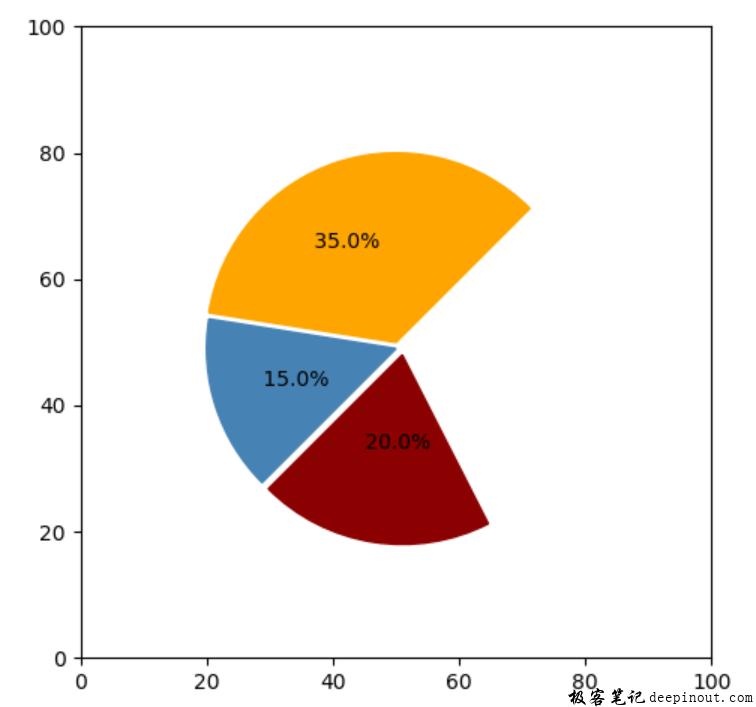
这里演示的例子结果如下图:

在这个例子里,使用了三个扇形来表示百分比,还有一块没有画出来,为什么这样呢,因为这一块留给大家做作业的,只要大家学完本文之后,把第四块画出来了,就算学会并过关了。
在整个代码,它的思路非常简单,就是对数据进行计算出来百分比,再通过百分比来计算扇形的角度,这样扇形就有起点的角度和终止的角度。最后在扇形合并的位置把百分比文本显示出来,当然还需要调整一下每个扇形的圆心坐标,让它们分解一些,看起来就更加舒服了。
sample = [350, 150, 200, 300]

total = sum(sample)

per = [i/float(total) for i in sample]

angles = [360*i for i in per]
这几行代码就是计算百分比和角度占比。
wedge1 = mpatches.Wedge((50, 50), 30, delta, delta + sum(angles[0:1]), color = 'orange')

host.add_patch(p = wedge1)

host.text(36, 65, f"{per[0]* 100 : 3.1f}%")
这几行代码,就是画第一个桔红色的扇形,(50, 50)是表示圆心,30是表示半径大小,delta是表示角度的起点,delta + sum(angles[0:1])是表示角度终点,color = ‘orange’是表示颜色设置。
后面接着的代码,都跟上面的是一样的,只是变化了角度和百分比。
整个完整的代码如下:
import numpy as np
import matplotlib.pyplot as plt
import matplotlib.patches as mpatches

#

fig, host = plt.subplots()  #创建子图

host.grid(False)

host.set_aspect("equal")

host.set_xlim(0, 100)

host.set_ylim(0, 100)

#

sample = [350, 150, 200, 300]

total = sum(sample)

per = [i/float(total) for i in sample]

angles = [360*i for i in per]

delta = 45

wedge1 = mpatches.Wedge((50, 50), 30, delta, delta + sum(angles[0:1]), color = 'orange')

host.add_patch(p = wedge1)

host.text(36, 65, f"{per[0]* 100 : 3.1f}%")

#

wedge2 = mpatches.Wedge((50, 49), 30, delta + sum(angles[0:1]), delta + sum(angles[0:2]), color = 'steelblue')

host.add_patch(p = wedge2)

host.text(28, 43, f"{per[1]* 100 : 3.1f}%")

#

wedge3 = mpatches.Wedge((51, 48), 30, delta + sum(angles[0:2]), delta + sum(angles[0:3]), color = 'darkred')

host.add_patch(p = wedge3)

host.text(44, 33, f"{per[2]* 100 : 3.1f}%")

plt.tight_layout()

plt.show() 极客笔记
极客笔记