使用Python实现线性回归
线性回归是一种统计技术,用于描述依赖变量与多个独立变量之间的关系。本教程将讨论线性回归的基本概念以及其在Python中的应用。
为了理解线性回归概念的基础知识,我们从最基本的形式——”简单线性回归”开始。
简单线性回归
简单线性回归(SLR)是一种使用一个特征来预测响应的方法。人们认为这两个变量之间存在线性关系。因此,我们努力寻找一个线性方程,能够尽量准确地预测特征或独立推导变量(x)相对于答案值(y)的值。
让我们考虑一个数据集,其中我们有多个响应值 y 对应每个特征 x :

为简化起见,我们定义:
x为特征向量,即x=[x1, x2, x3, …., xn]
y为响应向量,即y=[y1, y2, y3…., yn]
对于n个观测值(在上面的示例中,n=10)。
上述数据集的散点图如下所示:-
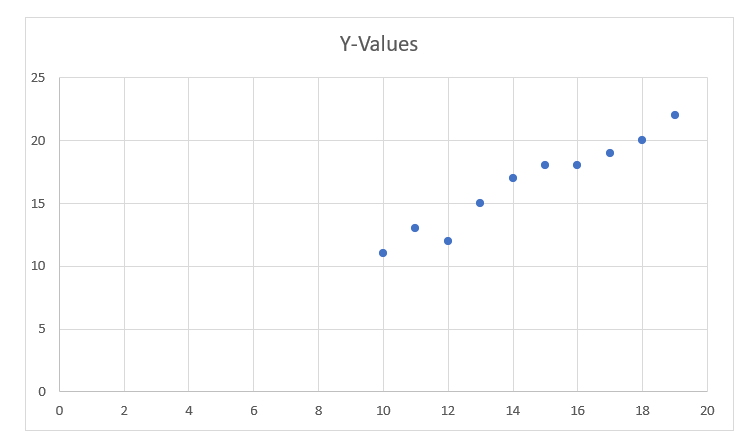
下一步是找出在这个散点图中最适合的直线,以便我们可以预测任何一个特征的新值的响应(即不在数据集中的x的值)。
这条直线被称为回归线。
回归线的方程可以表示如下:

这里,
- h(x i )表示第i个样本的 预测响应值
- ? 0 和 ? 1x i )是回归系数,分别代表回归线的 截距 和 斜率
为了构建我们的模型,我们需要“学习”或估计回归系数的值。在确定这些系数之后,我们就能够利用这个模型来预测响应值!
在本教程中,我们将使用最小二乘法的概念。
让我们考虑:
y i = ? 0 + ? 1x i + ? i =h(x i )+ ? i ? ? i = y i - h(x i )
这里,? i 是第i个观测值的 残差 。
因此,我们的目标是使总残差尽可能小。
我们定义了代价函数或平方误差, J 如下:

我们的使命是找到使得 J(? 0 ,? 1 )最小的? 0 和? 1 的值。
不详细解释数学细节,我们将结果呈现如下:

其中,ssxy是”y”和”x”的交叉偏差之和:

并且 ssxx 是” x “的平方偏差和

代码:
import numpy as nmp
import matplotlib.pyplot as mtplt

def estimate_coeff(p, q):
# Here, we will estimate the total number of points or observation
    n1 = nmp.size(p)
# Now, we will calculate the mean of a and b vector
    m_p = nmp.mean(p)
    m_q = nmp.mean(q)

# here, we will calculate the cross deviation and deviation about a
    SS_pq = nmp.sum(q * p) - n1 * m_q * m_p
    SS_pp = nmp.sum(p * p) - n1 * m_p * m_p

# here, we will calculate the regression coefficients
    b_1 = SS_pq / SS_pp
    b_0 = m_q - b_1 * m_p

    return (b_0, b_1)

def plot_regression_line(p, q, b):
# Now, we will plot the actual points or observation as scatter plot
    mtplt.scatter(p, q, color = "m",
            marker = "o", s = 30)

# here, we will calculate the predicted response vector
    q_pred = b[0] + b[1] * p

# here, we will plot the regression line
    mtplt.plot(p, q_pred, color = "g")

# here, we will put the labels
    mtplt.xlabel('p')
    mtplt.ylabel('q')

# here, we will define the function to show plot
    mtplt.show()

def main():
# entering the observation points or data
    p = np.array([10, 11, 12, 13, 14, 15, 16, 17, 18, 19])
    q = np.array([11, 13, 12, 15, 17, 18, 18, 19, 20, 22])

# now, we will estimate the coefficients
    b = estimate_coeff(p, q)
    print("Estimated coefficients are :\nb_0 = {} \
        \nb_1 = {}".format(b[0], b[1]))

# Now, we will plot the regression line
    plot_regression_line(p, q, b)

if __name__ == "__main__":
    main()
输出:
Estimated coefficients are :
b_0 = -0.4606060606060609
b_1 = 1.1696969696969697

多重线性回归
多重线性回归试图解释多个元素之间的关系,并通过应用线性方程来回应数据。显然,它只是线性回归的扩展。
想象一组具有一个或多个特征(或自变量)以及一个响应(或因变量)的数据集。
数据集还包含额外的n行/观察值。
我们定义:
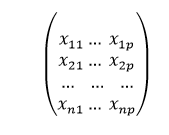
X (特征矩阵)= 它是一个大小为 “n * p” 的矩阵,其中”xij”表示第i个观察值的第j个属性的值。
因此,
同时,
y (响应向量)= 它是大小为 n 的向量,其中表示第 i 个观测的响应值。
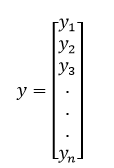
回归线对于“p”个特征如下所示:

其中h(xi)是第i个观测点的预测响应值,而β0、β1、β2、….,βp是回归系数。
我们也可以写成:

在这里,? i 表示第i个观测点的残差误差。
我们还可以通过将属性矩阵“X”表示为更一般的形式来推广我们的线性模型:
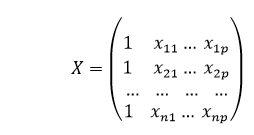
因此,线性模型可以用矩阵的形式表示如下:
y=Xβ+ε
其中,
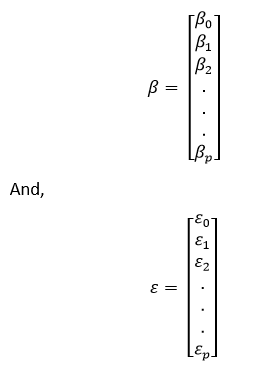
我们现在通过一个叫做最小二乘法的算法确定b的估计值,即b’。正如之前提到的,最小二乘法是用于找到总残差误差最小化情况下的b’的方法。
我们将会如下展示结果:

其中’表示矩阵的转置,-1表示矩阵的倒数。
借助最小二乘估计的最低平方估计b’的帮助,现在通过多元线性回归模型来计算:

其中 y’ 是估算的响应向量。
代码:
import matplotlib.pyplot as mtpplt
import numpy as nmp
from sklearn import datasets as DS
from sklearn import linear_model as LM
from sklearn import metrics as mts

# First, we will load the boston dataset
boston1 = DS.load_boston(return_X_y = False)

# Here, we will define the feature matrix(H) and response vector(f)
H = boston1.data
f = boston1.target

# Now, we will split X and y datasets into training and testing sets
from sklearn.model_selection import train_test_split as tts
H_train, H_test, f_train, f_test = tts(H, f, test_size = 0.4,
                                                    random_state = 1)

# Here, we will create linear regression object
reg1 = LM.LinearRegression()

# Now, we will train the model by using the training sets
reg1.fit(H_train, f_train)

# here, we will print the regression coefficients
print('Regression Coefficients are: ', reg1.coef_)

# Here, we will print the variance score: 1 means perfect prediction
print('Variance score is: {}'.format(reg1.score(H_test, f_test)))

# Here, we will plot for residual error

# here, we will set the plot style
mtpplt.style.use('fivethirtyeight')

# here we will plot the residual errors in training data
mtpplt.scatter(reg1.predict(H_train), reg1.predict(H_train) - f_train,
            color = "green", s = 10, label = 'Train data')

# Here, we will plot the residual errors in test data
mtpplt.scatter(reg1.predict(H_test), reg1.predict(H_test) - f_test,
            color = "blue", s = 10, label = 'Test data')

# Here, we will plot the line for zero residual error
mtpplt.hlines(y = 0, xmin = 0, xmax = 50, linewidth = 2)

# here, we will plot the legend
mtpplt.legend(loc = 'upper right')

# now, we will plot the title
mtpplt.title("Residual errors")

# here, we will define the method call for showing the plot
mtpplt.show()
输出:
Regression Coefficients are: [-8.95714048e-02 6.73132853e-02 5.04649248e-02 2.18579583e+00
-1.72053975e+01 3.63606995e+00 2.05579939e-03 -1.36602886e+00
2.89576718e-01 -1.22700072e-02 -8.34881849e-01 9.40360790e-03
-5.04008320e-01]
Variance score is: 0.7209056672661751

在上面的示例中,我们使用解释方差分数来计算准确率分数。
我们定义:
explained_variance_score = 1 – Var{y – y’}/Var{y}
其中y’是估计的输出目标值,y是目标的等价(正确)的输出值,Var是方差,它是标准差的平方。
最理想的分数是1.0。较低的分数表示较差的结果。
假设:
以下是线性回归模型基于数据集的主要假设:
- 线性关系: 特征与响应变量之间的关系必须是线性的。线性关系的假设可以通过散点图进行测试。正如我们可以看到,第一个图表示线性相关的变量,而第三个和第二个图表示可能是非线性的。因此,第一个图可以通过使用线性回归进行更准确的预测。

- 很少或没有多重共线性: 这个假设是数据中存在最少或没有多重共线性。当特征(或自变量)之间不独立时,会发生多重共线性。
-
很少或没有自相关性: 另一个假设是数据中几乎没有或没有自相关性。自相关性是指残差误差不独立。
-
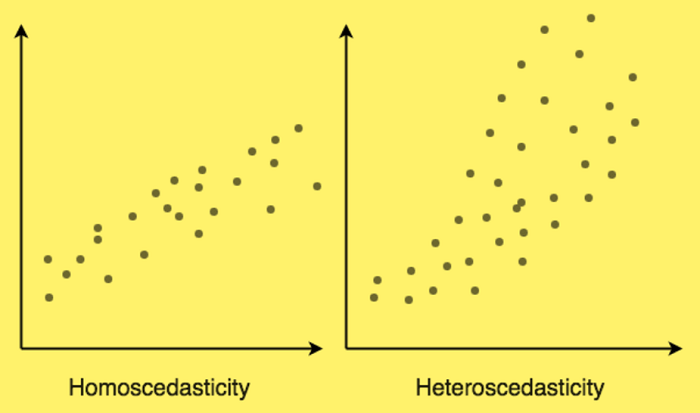
同方差性: 是指误差是一个因素(即,自变量和因变量之间关系的“噪音”或随机干扰),对所有自变量都保持不变。图1是同方差的,而图2显示异方差性。
在本教程的最后,我们将讨论线性回归的一些应用。
应用:
以下是基于线性回归的应用领域:
- 趋势线: 用于说明随时间推移数据数量的变化(如GDP或油价)。它们通常具有线性关系。因此,线性回归可以用于预测未来值。然而,在可能出现其他变化可能改变数据的情况下,该方法无法满足科学可信度的要求。
- 经济学: 线性回归是经济学中使用的主要工具。它可用于预测消费者支出、固定投资支出、库存投资、国家的出口购买、进口支出、储备流动资产需求、劳动需求和供应等。
- 金融: 资本价值资产模型利用线性回归来研究和量化投资的风险因素。
- 生物学: 线性回归是解释生物系统中变量之间因果关系的方法。
 极客笔记
极客笔记