Matplotlib中使用plt.subplots和调整子图间距的全面指南
Matplotlib是Python中最流行的数据可视化库之一,它提供了强大的绘图功能。在创建复杂的图表布局时,plt.subplots函数和子图间距调整是非常重要的工具。本文将深入探讨如何使用plt.subplots创建子图,以及如何通过调整padding来优化子图布局,使您的数据可视化更加清晰和美观。
1. plt.subplots函数简介
plt.subplots是Matplotlib库中的一个核心函数,用于创建一个图形和一组子图。这个函数非常灵活,可以帮助我们轻松地创建多个子图,并在同一个图形中组织它们。
1.1 基本用法
让我们从一个简单的例子开始,创建一个2×2的子图网格:
import matplotlib.pyplot as plt
import numpy as np

fig, axs = plt.subplots(2, 2, figsize=(10, 8))
fig.suptitle('How2matplotlib.com - Basic Subplots Example')

for i in range(2):
    for j in range(2):
        axs[i, j].plot(np.random.rand(10))
        axs[i, j].set_title(f'Subplot {i+1},{j+1}')

plt.tight_layout()
plt.show()
Output:
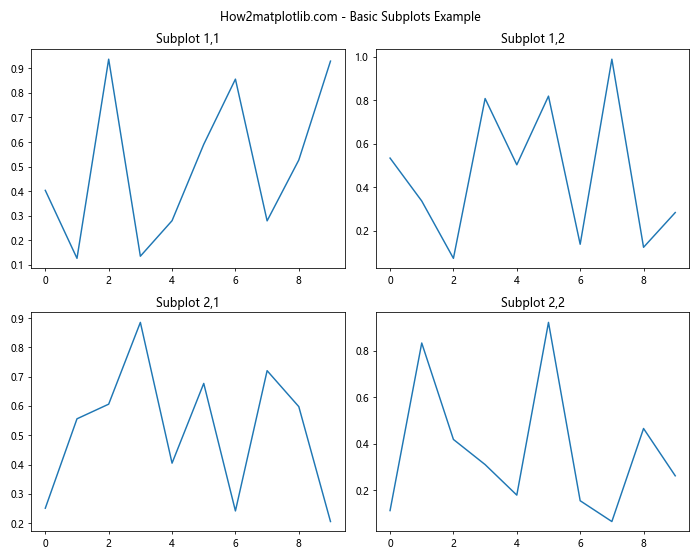
在这个例子中,我们创建了一个2×2的子图网格。figsize参数设置了整个图形的大小。我们使用嵌套循环为每个子图添加随机数据和标题。tight_layout()函数自动调整子图之间的间距。
1.2 子图的索引和访问
当使用plt.subplots创建多个子图时,返回的axs是一个NumPy数组。我们可以使用索引来访问特定的子图:
import matplotlib.pyplot as plt
import numpy as np

fig, axs = plt.subplots(2, 3, figsize=(12, 8))
fig.suptitle('How2matplotlib.com - Accessing Subplots')

# 访问第一行第二列的子图
axs[0, 1].plot(np.random.rand(10), 'r-')
axs[0, 1].set_title('Row 1, Column 2')

# 访问第二行第三列的子图
axs[1, 2].scatter(np.random.rand(10), np.random.rand(10))
axs[1, 2].set_title('Row 2, Column 3')

plt.tight_layout()
plt.show()
Output:
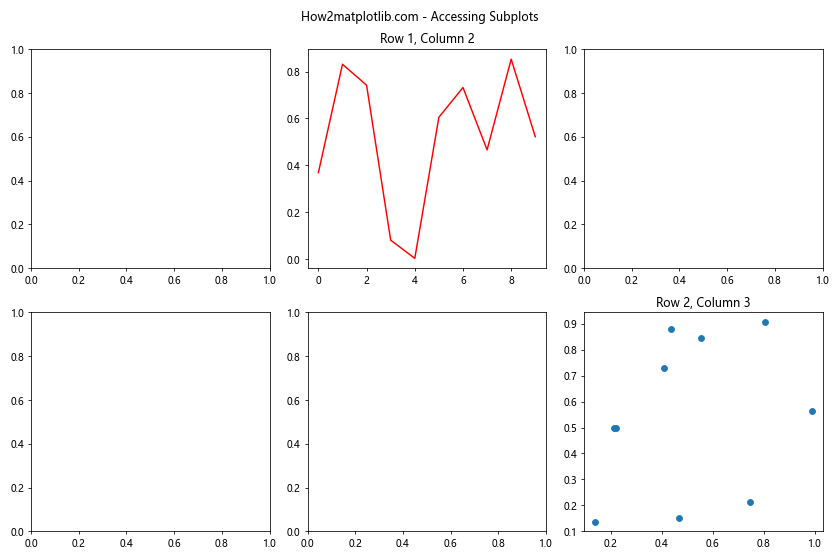
这个例子展示了如何使用索引访问特定的子图。我们可以对每个子图单独进行操作,如添加不同类型的图表或设置不同的标题。
2. 调整子图间距(Padding)
虽然tight_layout()函数可以自动调整子图间距,但有时我们需要更精细的控制。Matplotlib提供了多种方法来调整子图之间的间距和边距。
2.1 使用plt.subplots_adjust
plt.subplots_adjust函数允许我们手动调整子图的布局:
import matplotlib.pyplot as plt
import numpy as np

fig, axs = plt.subplots(2, 2, figsize=(10, 8))
fig.suptitle('How2matplotlib.com - Adjusting Subplots')

for ax in axs.flat:
    ax.plot(np.random.rand(10))

plt.subplots_adjust(left=0.1, right=0.9, top=0.9, bottom=0.1, wspace=0.4, hspace=0.4)
plt.show()
Output:
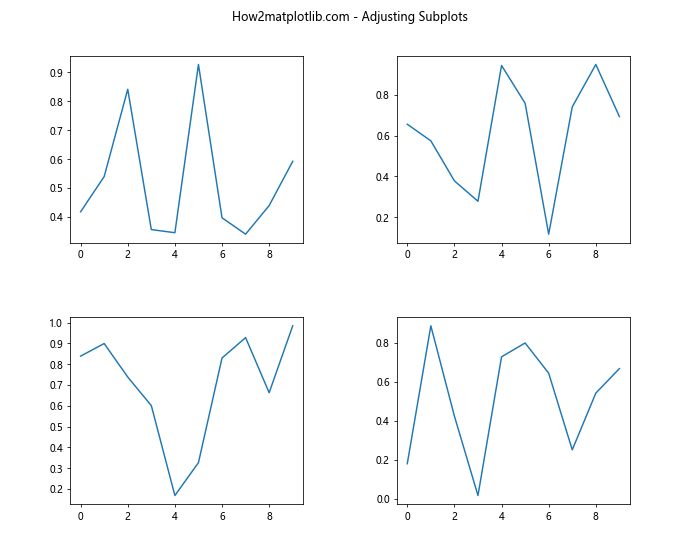
在这个例子中,我们使用plt.subplots_adjust来设置子图的位置和间距。left、right、top和bottom参数控制整个图形的边距,而wspace和hspace分别控制子图之间的水平和垂直间距。
2.2 使用gridspec
对于更复杂的布局,我们可以使用gridspec模块:
import matplotlib.pyplot as plt
import matplotlib.gridspec as gridspec
import numpy as np

fig = plt.figure(figsize=(12, 8))
fig.suptitle('How2matplotlib.com - GridSpec Example')

gs = gridspec.GridSpec(2, 2, width_ratios=[2, 1], height_ratios=[1, 2])

ax1 = fig.add_subplot(gs[0, 0])
ax2 = fig.add_subplot(gs[0, 1])
ax3 = fig.add_subplot(gs[1, :])

ax1.plot(np.random.rand(10))
ax2.scatter(np.random.rand(10), np.random.rand(10))
ax3.bar(range(10), np.random.rand(10))

plt.tight_layout()
plt.show()
Output:
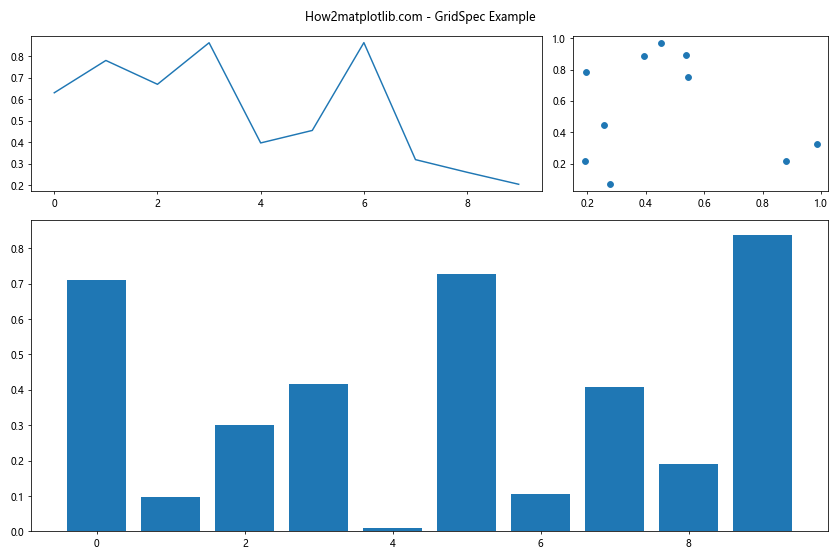
这个例子展示了如何使用gridspec创建不同大小的子图。我们设置了不同的宽度比和高度比,并创建了一个跨越整个底部的子图。
3. 高级布局技巧
3.1 嵌套子图
有时我们需要在一个子图内创建更多的子图。这可以通过嵌套的plt.subplots调用来实现:
import matplotlib.pyplot as plt
import numpy as np

fig, axs = plt.subplots(2, 2, figsize=(12, 10))
fig.suptitle('How2matplotlib.com - Nested Subplots')

# 在右上角的子图中创建嵌套的子图
nested_fig, nested_axs = plt.subplots(2, 2, figsize=(4, 4))
axs[0, 1].remove()  # 移除原来的子图
axs[0, 1] = fig.add_subplot(2, 2, 2)
axs[0, 1].set_title('Nested Subplots')
axs[0, 1].axis('off')

for ax in nested_axs.flat:
    ax.plot(np.random.rand(10))

nested_fig.tight_layout()
axs[0, 1].figure.add_axes(axs[0, 1].get_position(), frameon=False)
axs[0, 1].figure.figimage(nested_fig.canvas.renderer.buffer_rgba(), axs[0, 1].get_position().x0, axs[0, 1].get_position().y0)

# 为其他子图添加内容
axs[0, 0].plot(np.random.rand(10))
axs[1, 0].scatter(np.random.rand(10), np.random.rand(10))
axs[1, 1].bar(range(10), np.random.rand(10))

plt.tight_layout()
plt.show()
Output:
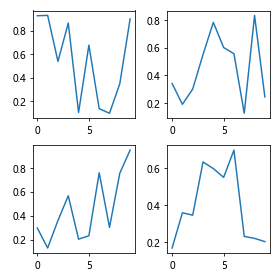
这个复杂的例子展示了如何在一个子图内创建嵌套的子图。我们首先创建了一个2×2的主布局,然后在右上角的子图中嵌入了另一个2×2的子图集。
3.2 不规则布局
有时我们需要创建不规则的子图布局。这可以通过gridspec模块实现:
import matplotlib.pyplot as plt
import matplotlib.gridspec as gridspec
import numpy as np

fig = plt.figure(figsize=(12, 8))
fig.suptitle('How2matplotlib.com - Irregular Layout')

gs = gridspec.GridSpec(3, 3)

ax1 = fig.add_subplot(gs[0, :])
ax2 = fig.add_subplot(gs[1, :-1])
ax3 = fig.add_subplot(gs[1:, -1])
ax4 = fig.add_subplot(gs[-1, 0])
ax5 = fig.add_subplot(gs[-1, -2])

ax1.plot(np.random.rand(10))
ax2.scatter(np.random.rand(10), np.random.rand(10))
ax3.bar(range(5), np.random.rand(5))
ax4.pie(np.random.rand(4))
ax5.hist(np.random.randn(100))

plt.tight_layout()
plt.show()
Output:
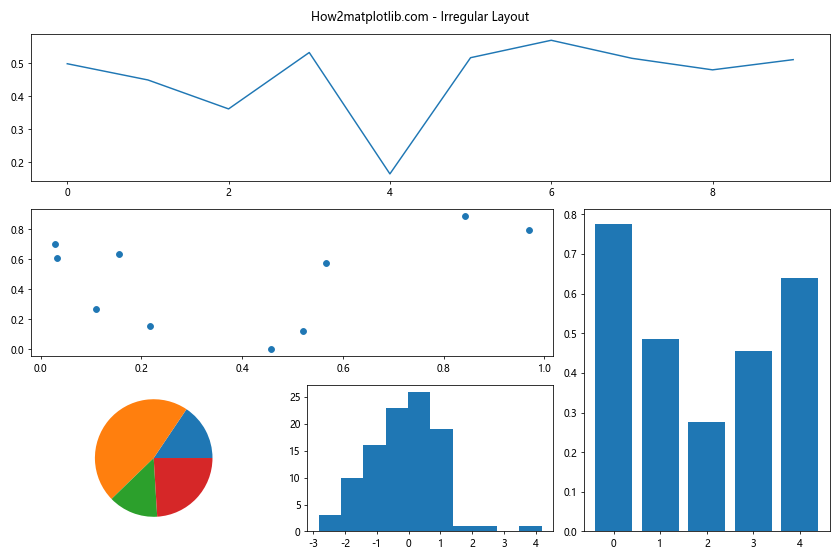
这个例子创建了一个不规则的布局,包括一个跨越整个顶部的子图,一个占据中间两列的子图,一个占据右侧两行的子图,以及底部的两个小子图。
4. 子图间距的微调
有时,自动调整可能不能完全满足我们的需求。在这种情况下,我们可以使用一些高级技巧来微调子图间距。
4.1 使用constrained_layout
constrained_layout是一个更新的自动布局调整器,通常比tight_layout效果更好:
import matplotlib.pyplot as plt
import numpy as np

fig, axs = plt.subplots(2, 2, figsize=(10, 8), constrained_layout=True)
fig.suptitle('How2matplotlib.com - Constrained Layout')

for ax in axs.flat:
    ax.plot(np.random.rand(10))
    ax.set_title('Subplot Title')
    ax.set_xlabel('X Label')
    ax.set_ylabel('Y Label')

plt.show()
Output:
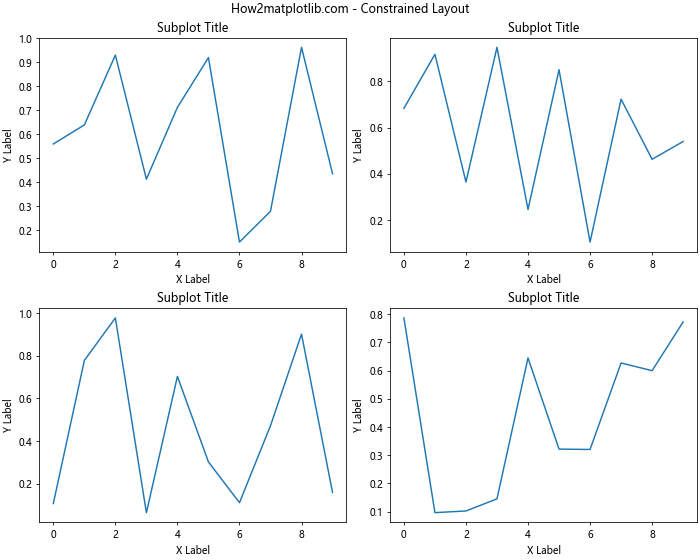
在这个例子中,我们在创建子图时直接使用constrained_layout=True参数。这会自动调整子图之间的间距,以及子图与整个图形边缘的距离,通常能得到更好的布局效果。
4.2 手动调整子图位置
对于需要精确控制的情况,我们可以手动调整每个子图的位置:
import matplotlib.pyplot as plt
import numpy as np

fig, axs = plt.subplots(2, 2, figsize=(10, 8))
fig.suptitle('How2matplotlib.com - Manual Adjustment')

for ax in axs.flat:
    ax.plot(np.random.rand(10))

# 手动调整每个子图的位置
axs[0, 0].set_position([0.1, 0.6, 0.35, 0.35])  # [left, bottom, width, height]
axs[0, 1].set_position([0.55, 0.6, 0.35, 0.35])
axs[1, 0].set_position([0.1, 0.1, 0.35, 0.35])
axs[1, 1].set_position([0.55, 0.1, 0.35, 0.35])

plt.show()
Output:
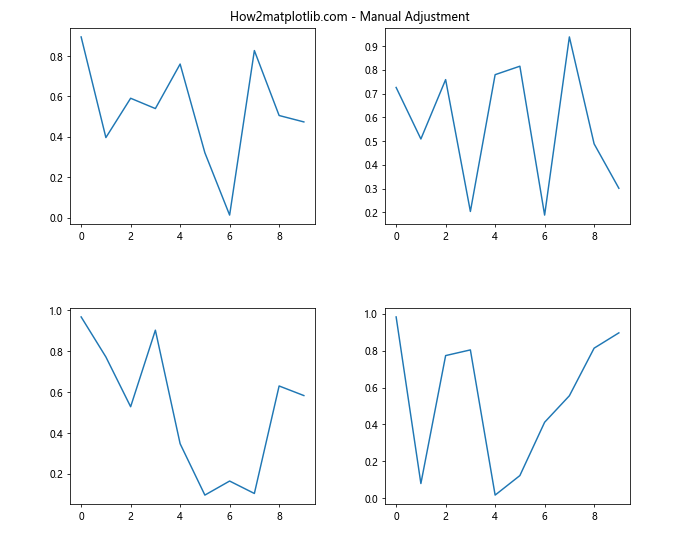
在这个例子中,我们使用set_position方法来精确设置每个子图的位置和大小。这种方法给予了我们最大的灵活性,但也需要更多的手动计算和调整。
5. 处理不同大小的子图
有时,我们可能需要在同一个图形中创建不同大小的子图。这可以通过组合gridspec和手动调整来实现:
import matplotlib.pyplot as plt
import matplotlib.gridspec as gridspec
import numpy as np

fig = plt.figure(figsize=(12, 8))
fig.suptitle('How2matplotlib.com - Different Sized Subplots')

gs = gridspec.GridSpec(2, 3)

ax1 = fig.add_subplot(gs[0, :2])
ax2 = fig.add_subplot(gs[0, 2])
ax3 = fig.add_subplot(gs[1, :])

ax1.plot(np.random.rand(20))
ax1.set_title('Large Subplot')

ax2.scatter(np.random.rand(10), np.random.rand(10))
ax2.set_title('Small Subplot')

ax3.bar(range(15), np.random.rand(15))
ax3.set_title('Wide Subplot')

plt.tight_layout()
plt.show()
Output:
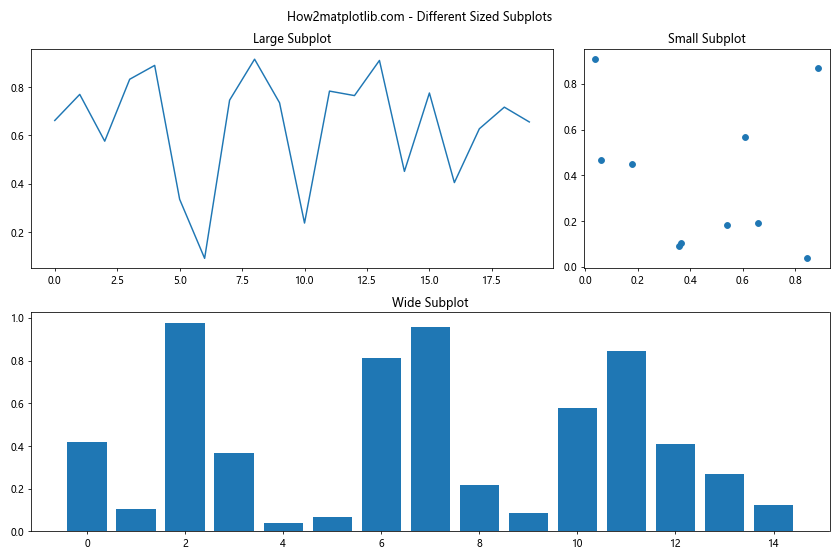
这个例子创建了三个不同大小的子图:一个大的子图占据上半部分的两列,一个小的子图在右上角,以及一个宽的子图占据整个底部。
6. 子图标题和整体标题的调整
当我们有多个子图时,管理子图标题和整体标题的位置变得很重要:
import matplotlib.pyplot as plt
import numpy as np

fig, axs = plt.subplots(2, 2, figsize=(12, 10))
fig.suptitle('How2matplotlib.com - Title Adjustments', fontsize=16, y=0.95)

for i, ax in enumerate(axs.flat):
    ax.plot(np.random.rand(10))
    ax.set_title(f'Subplot {i+1}', fontsize=12, pad=10)

plt.tight_layout(rect=[0, 0.03, 1, 0.95])  # [left, bottom, right, top]
plt.show()
Output:
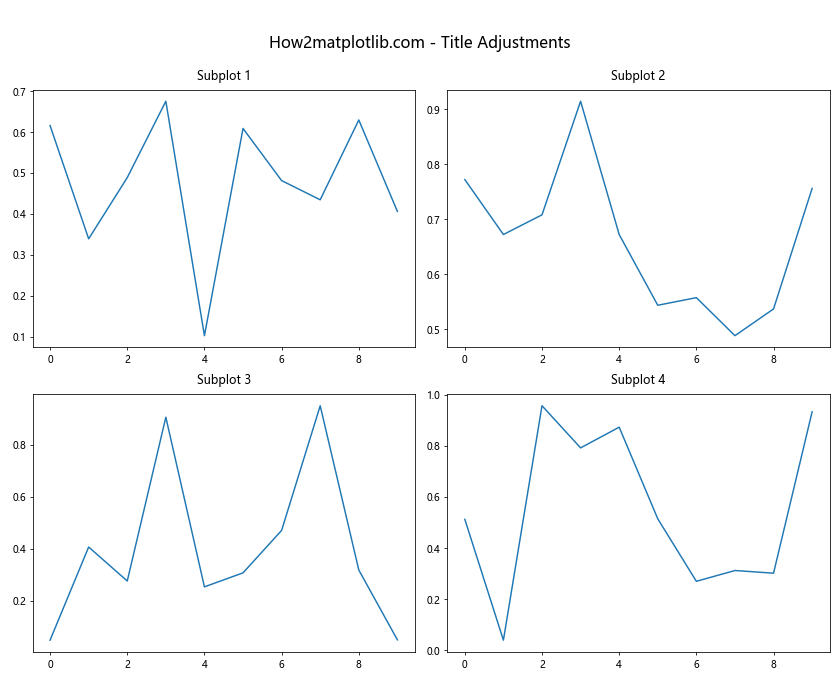
在这个例子中,我们使用fig.suptitle设置了整体标题,并通过y参数调整其垂直位置。对于每个子图,我们使用set_title设置标题,并通过pad参数调整标题与子图的距离。tight_layout函数的rect参数用于为整体标题留出空间。
7. 处理长标签和刻度标签
当子图中有长标签或大量刻度标签时,可能需要特别调整以避免重叠:
import matplotlib.pyplot as plt
import numpy as np

fig, axs = plt.subplots(2, 2, figsize=(12, 10))
fig.suptitle('How2matplotlib.com - Handling Long Labels', fontsize=16)

# 长x轴标签
axs[0, 0].bar(['Category A', 'Category B', 'Very Long Category C'], np.random.rand(3))
axs[0, 0].set_title('Long X Labels')
axs[0, 0].tick_params(axis='x', rotation=45)

# 长y轴标签
axs[0, 1].barh(['Short', 'Medium Length', 'Very Long Label Here'], np.random.rand(3))
axs[0, 1].set_title('Long Y Labels')

# 多个x轴刻度
x =np.linspace(0, 10, 20)
axs[1, 0].plot(x, np.sin(x))
axs[1, 0].set_title('Many X Ticks')
axs[1, 0].set_xticks(x)
axs[1, 0].tick_params(axis='x', rotation=90)

# 多个y轴刻度
y = np.linspace(0, 1, 15)
axs[1, 1].plot(np.random.rand(15), y)
axs[1, 1].set_title('Many Y Ticks')
axs[1, 1].set_yticks(y)

plt.tight_layout()
plt.show()
Output:
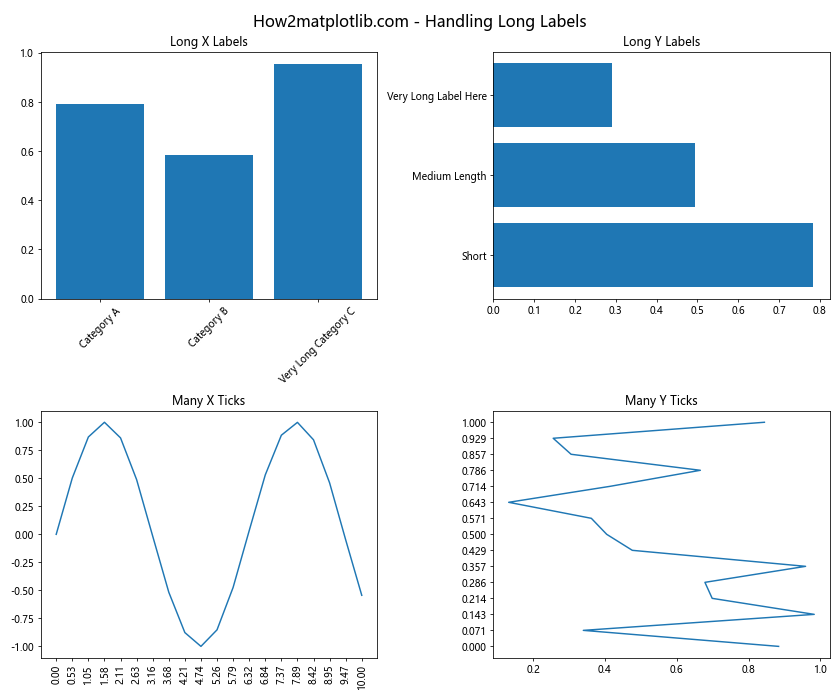
在这个例子中,我们展示了如何处理不同类型的长标签和多刻度情况:
– 对于长x轴标签,我们使用tick_params旋转标签。
– 对于长y轴标签,我们使用水平条形图来更好地展示。
– 对于多个x轴刻度,我们同样使用旋转来避免重叠。
– 对于多个y轴刻度,我们保持默认设置,因为垂直方向通常有更多空间。
8. 子图中的图例位置调整
当子图中包含多个数据系列时,图例的位置变得很重要:
import matplotlib.pyplot as plt
import numpy as np

fig, axs = plt.subplots(2, 2, figsize=(12, 10))
fig.suptitle('How2matplotlib.com - Legend Positioning', fontsize=16)

x = np.linspace(0, 10, 100)

# 图例在子图内部
axs[0, 0].plot(x, np.sin(x), label='sin(x)')
axs[0, 0].plot(x, np.cos(x), label='cos(x)')
axs[0, 0].set_title('Legend Inside')
axs[0, 0].legend(loc='best')

# 图例在子图外部
axs[0, 1].plot(x, x**2, label='x^2')
axs[0, 1].plot(x, x**3, label='x^3')
axs[0, 1].set_title('Legend Outside')
axs[0, 1].legend(loc='center left', bbox_to_anchor=(1, 0.5))

# 多列图例
axs[1, 0].plot(x, np.sin(x), label='sin(x)')
axs[1, 0].plot(x, np.cos(x), label='cos(x)')
axs[1, 0].plot(x, np.tan(x), label='tan(x)')
axs[1, 0].set_title('Multi-column Legend')
axs[1, 0].legend(loc='upper center', ncol=3)

# 共享图例
line1, = axs[1, 1].plot(x, np.sin(x), label='sin(x)')
line2, = axs[1, 1].plot(x, np.cos(x), label='cos(x)')
axs[1, 1].set_title('Shared Legend')

fig.legend([line1, line2], ['sin(x)', 'cos(x)'], loc='lower center', ncol=2)

plt.tight_layout()
plt.subplots_adjust(bottom=0.1)  # 为共享图例留出空间
plt.show()
Output:
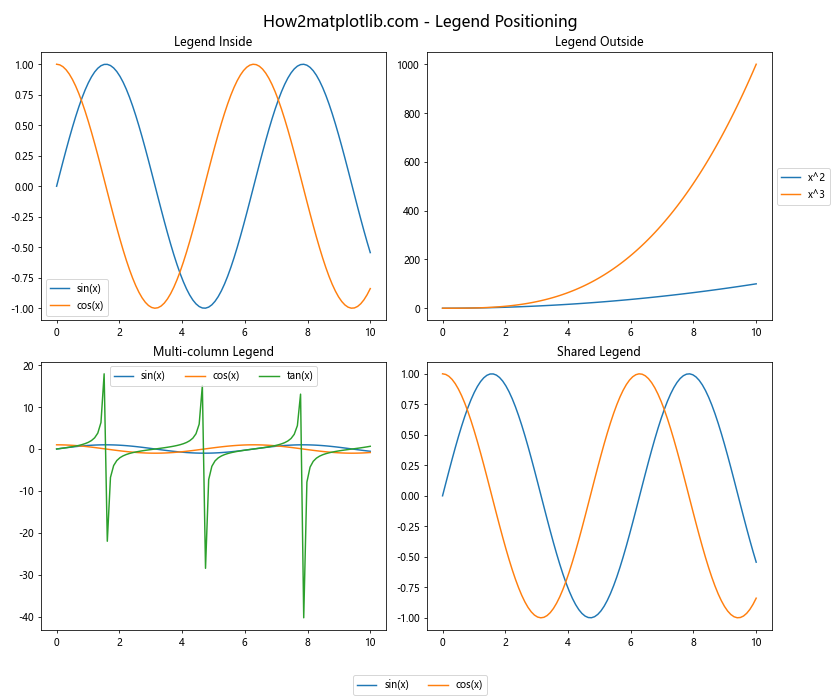
这个例子展示了几种不同的图例位置策略:
– 在子图内部:使用legend(loc='best')自动选择最佳位置。
– 在子图外部:使用bbox_to_anchor将图例放在子图右侧。
– 多列图例:使用ncol参数创建多列图例。
– 共享图例:使用fig.legend为整个图形创建一个共享的图例。
9. 子图中的颜色条(Colorbar)
当使用颜色映射(如热图)时,添加颜色条是很重要的:
import matplotlib.pyplot as plt
import numpy as np

fig, axs = plt.subplots(2, 2, figsize=(12, 10))
fig.suptitle('How2matplotlib.com - Colorbars', fontsize=16)

# 单个子图的颜色条
data = np.random.rand(10, 10)
im = axs[0, 0].imshow(data, cmap='viridis')
axs[0, 0].set_title('Individual Colorbar')
fig.colorbar(im, ax=axs[0, 0])

# 共享颜色条
im1 = axs[0, 1].imshow(data, cmap='plasma')
im2 = axs[1, 0].imshow(data, cmap='plasma')
axs[0, 1].set_title('Shared Colorbar')
axs[1, 0].set_title('Shared Colorbar')
fig.colorbar(im1, ax=[axs[0, 1], axs[1, 0]], label='Values')

# 水平颜色条
im3 = axs[1, 1].imshow(data, cmap='coolwarm')
axs[1, 1].set_title('Horizontal Colorbar')
fig.colorbar(im3, ax=axs[1, 1], orientation='horizontal', pad=0.2)

plt.tight_layout()
plt.show()
Output:
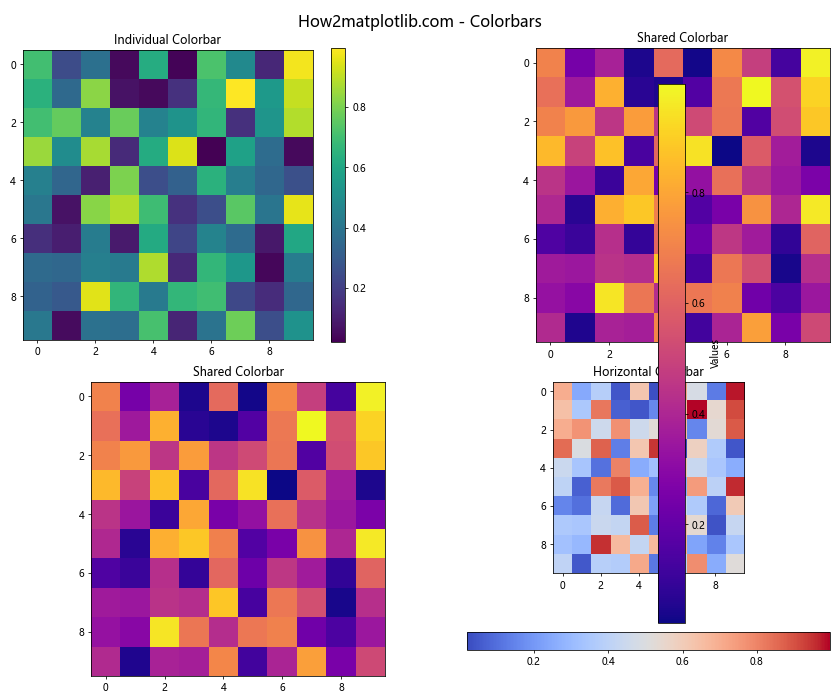
这个例子展示了三种不同的颜色条配置:
– 单个子图的颜色条:使用fig.colorbar(im, ax=ax)为单个子图添加颜色条。
– 共享颜色条:使用fig.colorbar(im, ax=[ax1, ax2])为多个子图添加共享的颜色条。
– 水平颜色条:使用orientation='horizontal'创建水平颜色条,并使用pad参数调整位置。
10. 子图中的双轴(Twin Axes)
有时我们需要在同一个子图中显示具有不同刻度的两组数据:
import matplotlib.pyplot as plt
import numpy as np

fig, axs = plt.subplots(2, 2, figsize=(12, 10))
fig.suptitle('How2matplotlib.com - Twin Axes', fontsize=16)

x = np.linspace(0, 10, 100)

# 共享x轴的双y轴
ax1 = axs[0, 0]
ax2 = ax1.twinx()
ax1.plot(x, np.sin(x), 'b-', label='sin(x)')
ax2.plot(x, np.exp(x), 'r-', label='exp(x)')
ax1.set_ylabel('Sin', color='b')
ax2.set_ylabel('Exp', color='r')
ax1.tick_params(axis='y', colors='b')
ax2.tick_params(axis='y', colors='r')
ax1.set_title('Shared X-axis')

# 共享y轴的双x轴
ax3 = axs[0, 1]
ax4 = ax3.twiny()
ax3.plot(x, x**2, 'g-')
ax4.plot(x, x**3, 'm-')
ax3.set_xlabel('X', color='g')
ax4.set_xlabel('X^2', color='m')
ax3.tick_params(axis='x', colors='g')
ax4.tick_params(axis='x', colors='m')
ax3.set_title('Shared Y-axis')

# 四个轴
ax5 = axs[1, 0]
ax6 = ax5.twinx()
ax7 = ax5.twiny()
ax8 = ax7.twinx()
ax5.plot(x, np.sin(x), 'b-')
ax6.plot(x, np.cos(x), 'r-')
ax7.plot(x, np.tan(x), 'g-')
ax8.plot(x, np.log(x), 'm-')
ax5.set_title('Four Axes')

# 极坐标图
ax9 = axs[1, 1]
r = np.linspace(0, 2, 100)
theta = 4 * np.pi * r
ax9.plot(theta, r)
ax9.set_rticks([0.5, 1, 1.5, 2])
ax9.set_title('Polar Plot')
ax9.set_theta_zero_location('N')
ax9.set_theta_direction(-1)

plt.tight_layout()
plt.show()
这个例子展示了几种使用双轴的情况:
– 共享x轴的双y轴:使用twinx()创建共享x轴的两个y轴。
– 共享y轴的双x轴:使用twiny()创建共享y轴的两个x轴。
– 四个轴:结合使用twinx()和twiny()创建四个轴。
– 极坐标图:展示了如何在子图中创建极坐标图。
结论
通过本文,我们深入探讨了Matplotlib中plt.subplots函数的使用以及如何调整子图间距(padding)。我们学习了如何创建基本的子图布局,如何调整子图之间的间距,以及如何处理各种复杂的布局情况。我们还探讨了处理长标签、多刻度、图例位置、颜色条和双轴等高级主题。
掌握这些技巧将使您能够创建更加复杂和专业的数据可视化图表。记住,创建好的可视化不仅仅是展示数据,还要确保信息清晰、易读,并能有效传达您想要表达的信息。通过灵活运用plt.subplots和调整子图间距,您可以确保您的图表不仅内容丰富,而且布局合理,美观大方。
在实际应用中,您可能需要根据具体的数据和需求来调整这些技巧。不断实践和实验将帮助您找到最适合您数据的可视化方式。希望本文能为您的数据可视化之旅提供有价值的指导和灵感。
 极客笔记
极客笔记