Python使用Matplotlib绘制2D直方图:全面指南与实例
参考:Plot 2-D Histogram in Python using Matplotlib
在数据可视化领域,2D直方图是一种强大而直观的工具,用于展示二维数据的分布情况。本文将深入探讨如何使用Python的Matplotlib库绘制2D直方图,涵盖基础概念、多种绘图方法、自定义选项以及实际应用场景。
1. 2D直方图简介
2D直方图,也称为二维直方图或热图,是一种用于可视化二维数据分布的图表。它将数据点分配到二维网格的单元格中,并使用颜色或高度来表示每个单元格中的数据点数量或密度。
1.1 2D直方图的应用场景
- 分析两个变量之间的关系
- 识别数据集中的模式和聚类
- 可视化大规模数据集的分布
- 探索数据的密度和频率
1.2 Matplotlib中的2D直方图函数
Matplotlib提供了多种方法来创建2D直方图:
plt.hist2d(): 最常用的2D直方图函数plt.hexbin(): 创建六边形bin的2D直方图ax.pcolormesh(): 用于创建更灵活的2D直方图
接下来,我们将详细介绍这些方法的使用,并提供丰富的示例代码。
2. 使用plt.hist2d()绘制基本2D直方图
plt.hist2d()是Matplotlib中最直接的2D直方图绘制函数。它将数据分配到矩形bin中,并使用颜色来表示每个bin的数据点数量。
2.1 基本用法
以下是使用plt.hist2d()的基本示例:
import numpy as np
import matplotlib.pyplot as plt

# 生成示例数据
np.random.seed(0)
x = np.random.randn(1000)
y = np.random.randn(1000)

# 绘制2D直方图
plt.figure(figsize=(10, 8))
plt.hist2d(x, y, bins=30, cmap='viridis')
plt.colorbar(label='Count')
plt.xlabel('X-axis (how2matplotlib.com)')
plt.ylabel('Y-axis (how2matplotlib.com)')
plt.title('Basic 2D Histogram (how2matplotlib.com)')
plt.show()
Output:
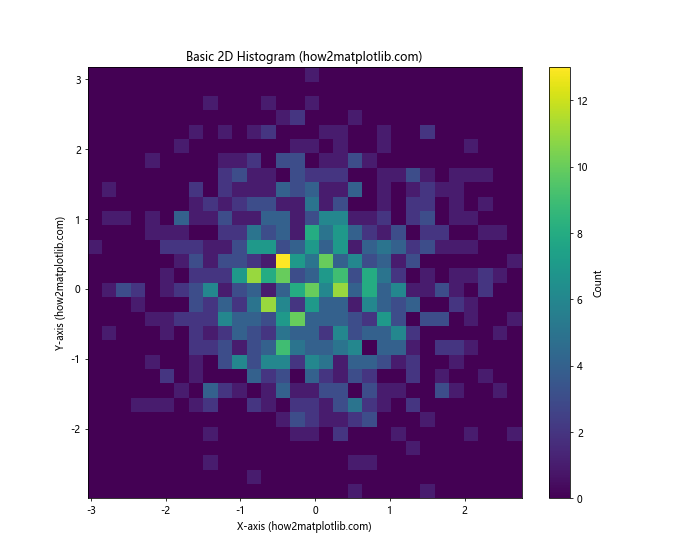
在这个例子中,我们生成了1000个随机数据点,并使用plt.hist2d()函数将它们绘制成2D直方图。bins参数指定了每个维度上的bin数量,cmap参数设置了颜色映射。
2.2 自定义bin数量和范围
我们可以更精细地控制bin的数量和范围:
import numpy as np
import matplotlib.pyplot as plt

np.random.seed(1)
x = np.random.normal(0, 1, 1000)
y = np.random.normal(0, 1, 1000)

plt.figure(figsize=(10, 8))
plt.hist2d(x, y, bins=[20, 15], range=[[-3, 3], [-3, 3]], cmap='YlOrRd')
plt.colorbar(label='Count')
plt.xlabel('X-axis (how2matplotlib.com)')
plt.ylabel('Y-axis (how2matplotlib.com)')
plt.title('2D Histogram with Custom Bins and Range (how2matplotlib.com)')
plt.show()
Output:
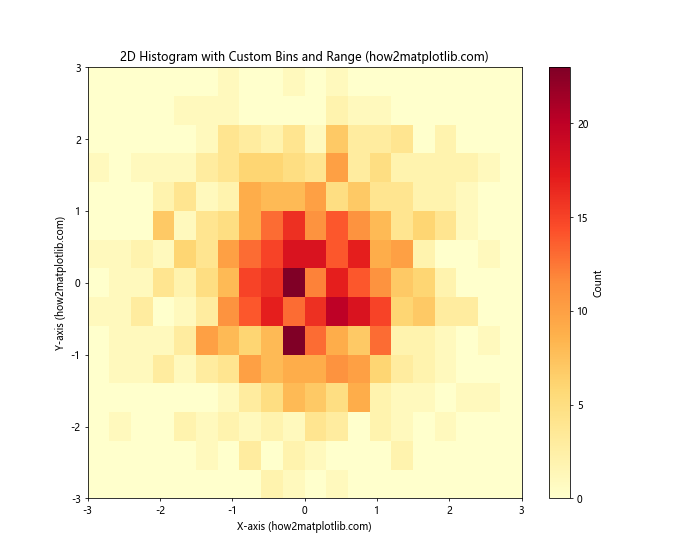
这个例子展示了如何为x轴和y轴分别设置不同的bin数量,以及如何限制数据的范围。
2.3 使用权重
plt.hist2d()还支持为每个数据点添加权重:
import numpy as np
import matplotlib.pyplot as plt

np.random.seed(2)
x = np.random.normal(0, 1, 1000)
y = np.random.normal(0, 1, 1000)
weights = np.random.uniform(0, 2, 1000)

plt.figure(figsize=(10, 8))
hist, xedges, yedges, im = plt.hist2d(x, y, bins=30, weights=weights, cmap='plasma')
plt.colorbar(im, label='Weighted Count')
plt.xlabel('X-axis (how2matplotlib.com)')
plt.ylabel('Y-axis (how2matplotlib.com)')
plt.title('Weighted 2D Histogram (how2matplotlib.com)')
plt.show()
Output:
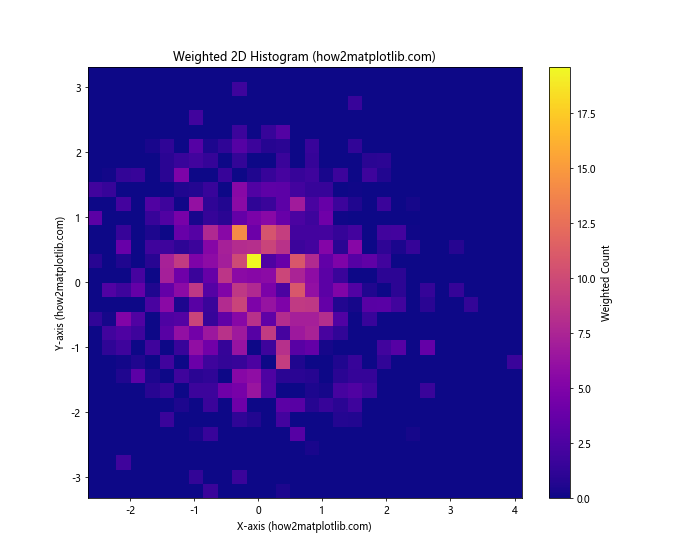
在这个例子中,我们为每个数据点分配了一个随机权重,这会影响每个bin的颜色强度。
3. 使用plt.hexbin()创建六边形bin的2D直方图
plt.hexbin()函数创建的是六边形bin的2D直方图,这种形状在某些情况下可以更好地表示数据分布。
3.1 基本用法
以下是plt.hexbin()的基本用法:
import numpy as np
import matplotlib.pyplot as plt

np.random.seed(3)
x = np.random.standard_normal(1000)
y = np.random.standard_normal(1000)

plt.figure(figsize=(10, 8))
plt.hexbin(x, y, gridsize=20, cmap='Blues')
plt.colorbar(label='Count')
plt.xlabel('X-axis (how2matplotlib.com)')
plt.ylabel('Y-axis (how2matplotlib.com)')
plt.title('Basic Hexbin Plot (how2matplotlib.com)')
plt.show()
Output:
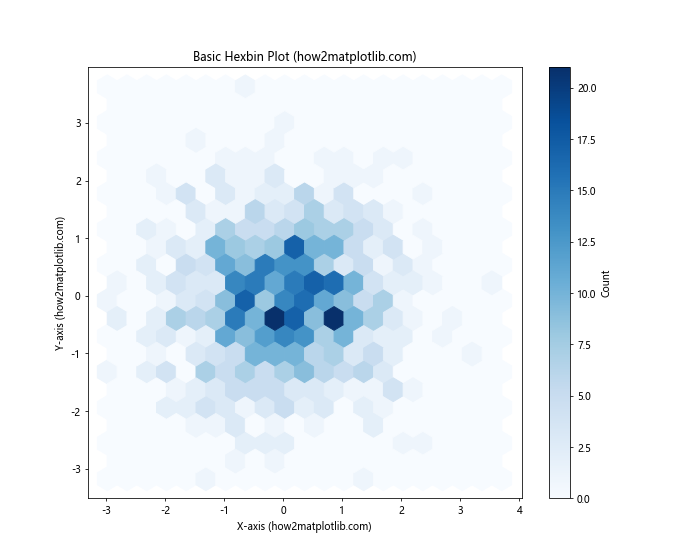
这个例子创建了一个基本的六边形bin直方图,gridsize参数控制了六边形的大小和数量。
3.2 使用不同的统计方法
plt.hexbin()支持多种统计方法来计算每个bin的值:
import numpy as np
import matplotlib.pyplot as plt

np.random.seed(4)
x = np.random.normal(0, 1, 1000)
y = x + np.random.normal(0, 0.5, 1000)

plt.figure(figsize=(10, 8))
plt.hexbin(x, y, gridsize=20, reduce_C_function=np.mean, cmap='viridis')
plt.colorbar(label='Mean Value')
plt.xlabel('X-axis (how2matplotlib.com)')
plt.ylabel('Y-axis (how2matplotlib.com)')
plt.title('Hexbin Plot with Mean Values (how2matplotlib.com)')
plt.show()
Output:
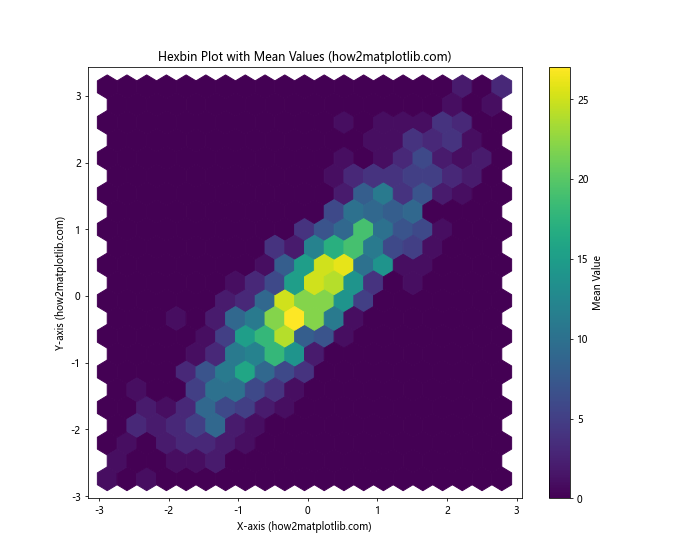
在这个例子中,我们使用reduce_C_function=np.mean来计算每个六边形bin中数据点的平均值,而不是默认的计数。
3.3 对数刻度
对于分布不均匀的数据,使用对数刻度可能会更有帮助:
import numpy as np
import matplotlib.pyplot as plt

np.random.seed(5)
x = np.random.standard_normal(100000)
y = np.random.standard_normal(100000)

plt.figure(figsize=(10, 8))
plt.hexbin(x, y, gridsize=50, bins='log', cmap='inferno')
plt.colorbar(label='log10(Count)')
plt.xlabel('X-axis (how2matplotlib.com)')
plt.ylabel('Y-axis (how2matplotlib.com)')
plt.title('Hexbin Plot with Logarithmic Scale (how2matplotlib.com)')
plt.show()
Output:
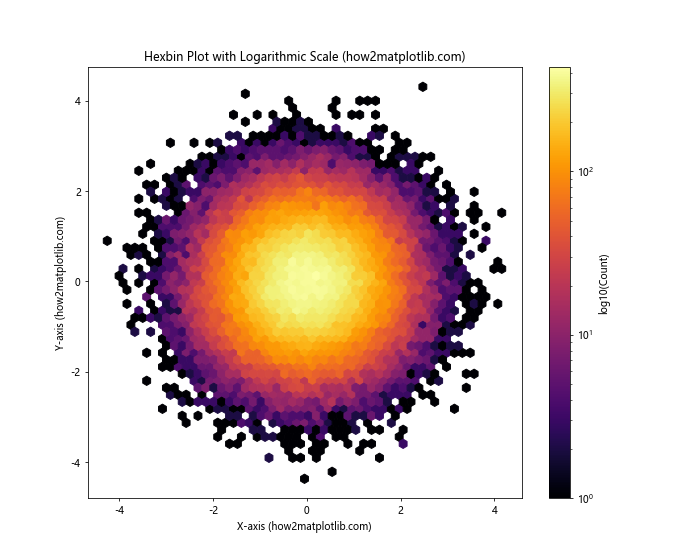
这个例子使用bins='log'参数来应用对数刻度,这对于可视化具有大范围值的数据特别有用。
4. 使用ax.pcolormesh()创建更灵活的2D直方图
ax.pcolormesh()函数提供了更多的灵活性,允许我们精确控制每个单元格的颜色。
4.1 基本用法
以下是使用pcolormesh()创建2D直方图的基本示例:
import numpy as np
import matplotlib.pyplot as plt

np.random.seed(6)
x = np.random.normal(0, 1, 1000)
y = np.random.normal(0, 1, 1000)

hist, xedges, yedges = np.histogram2d(x, y, bins=20)

fig, ax = plt.subplots(figsize=(10, 8))
im = ax.pcolormesh(xedges, yedges, hist.T, cmap='YlGnBu')
fig.colorbar(im, ax=ax, label='Count')
ax.set_xlabel('X-axis (how2matplotlib.com)')
ax.set_ylabel('Y-axis (how2matplotlib.com)')
ax.set_title('2D Histogram using pcolormesh (how2matplotlib.com)')
plt.show()
Output:
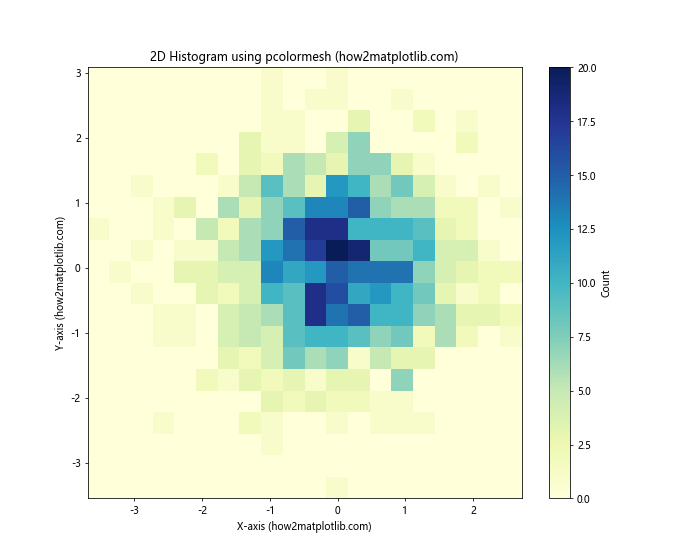
这个例子首先使用np.histogram2d()计算2D直方图数据,然后使用pcolormesh()将其可视化。
4.2 自定义颜色映射
我们可以创建自定义的颜色映射来突出特定的数据范围:
import numpy as np
import matplotlib.pyplot as plt
from matplotlib.colors import LinearSegmentedColormap

np.random.seed(7)
x = np.random.normal(0, 1, 1000)
y = np.random.normal(0, 1, 1000)

hist, xedges, yedges = np.histogram2d(x, y, bins=20)

# 创建自定义颜色映射
colors = ['white', 'yellow', 'orange', 'red']
n_bins = 100
cmap = LinearSegmentedColormap.from_list('custom_cmap', colors, N=n_bins)

fig, ax = plt.subplots(figsize=(10, 8))
im = ax.pcolormesh(xedges, yedges, hist.T, cmap=cmap, norm=plt.Normalize(0, hist.max()))
fig.colorbar(im, ax=ax, label='Count')
ax.set_xlabel('X-axis (how2matplotlib.com)')
ax.set_ylabel('Y-axis (how2matplotlib.com)')
ax.set_title('2D Histogram with Custom Colormap (how2matplotlib.com)')
plt.show()
Output:
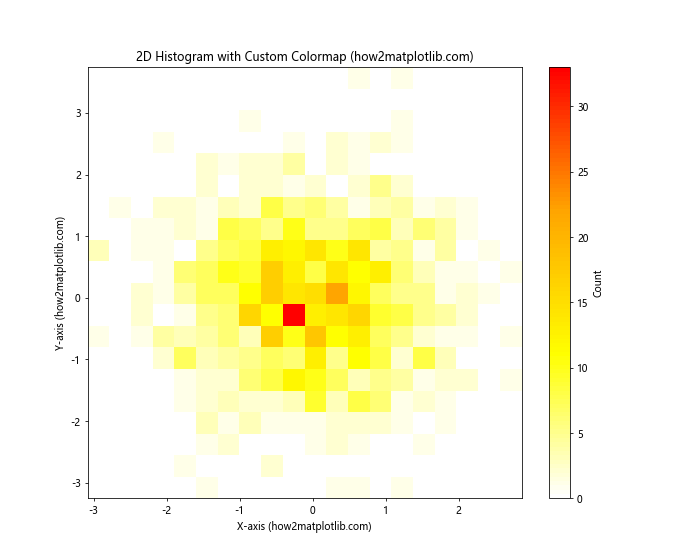
这个例子创建了一个从白色到红色的自定义颜色映射,可以更好地突出高密度区域。
4.3 添加轮廓线
我们可以在2D直方图上添加轮廓线来突出特定的密度水平:
import numpy as np
import matplotlib.pyplot as plt

np.random.seed(8)
x = np.random.normal(0, 1, 10000)
y = np.random.normal(0, 1, 10000)

hist, xedges, yedges = np.histogram2d(x, y, bins=50)

fig, ax = plt.subplots(figsize=(10, 8))
im = ax.pcolormesh(xedges, yedges, hist.T, cmap='viridis')
cs = ax.contour(xedges[:-1] + np.diff(xedges)/2,
                yedges[:-1] + np.diff(yedges)/2,
                hist.T, colors='white', alpha=0.5)
ax.clabel(cs, inline=True, fontsize=10)
fig.colorbar(im, ax=ax, label='Count')
ax.set_xlabel('X-axis (how2matplotlib.com)')
ax.set_ylabel('Y-axis (how2matplotlib.com)')
ax.set_title('2D Histogram with Contour Lines (how2matplotlib.com)')
plt.show()
Output:
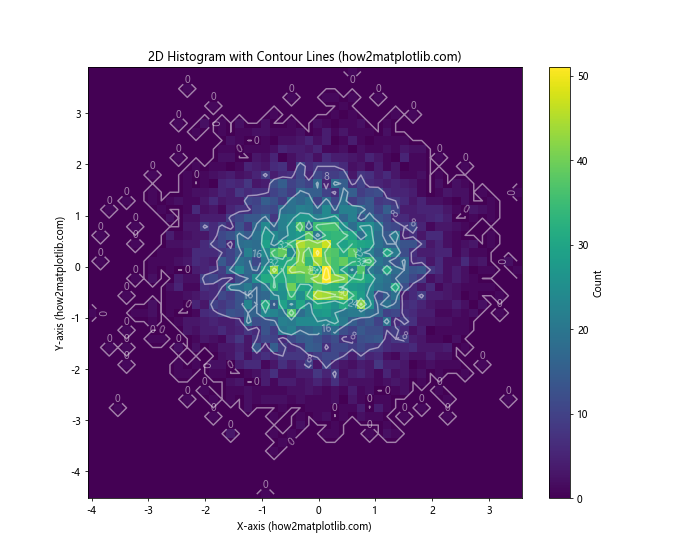
这个例子在2D直方图上添加了白色的轮廓线,并标注了轮廓线的值,这有助于识别数据的密度水平。
5. 高级技巧和自定义
5.1 子图比较
有时我们需要比较多个2D直方图。以下是如何在一个图中创建多个子图:
import numpy as np
import matplotlib.pyplot as plt

np.random.seed(9)
x1 = np.random.normal(0, 1, 1000)
y1 = np.random.normal(0, 1, 1000)
x2 = np.random.normal(1, 1.5, 1000)
y2 = np.random.normal(-1, 1.5, 1000)

fig, (ax1, ax2) = plt.subplots(1, 2, figsize=(16, 6))

hist1 = ax1.hist2d(x1, y1, bins=30, cmap='Blues')
fig.colorbar(hist1[3], ax=ax1, label='Count')
ax1.set_title('Distribution 1 (how2matplotlib.com)')
ax1.set_xlabel('X-axis')
ax1.set_ylabel('Y-axis')

hist2 = ax2.hist2d(x2, y2, bins=30, cmap='Reds')
fig.colorbar(hist2[3], ax=ax2, label='Count')
ax2.set_title('Distribution 2 (how2matplotlib.com)')
ax2.set_xlabel('X-axis')
ax2.set_ylabel('Y-axis')

plt.tight_layout()
plt.show()
Output:
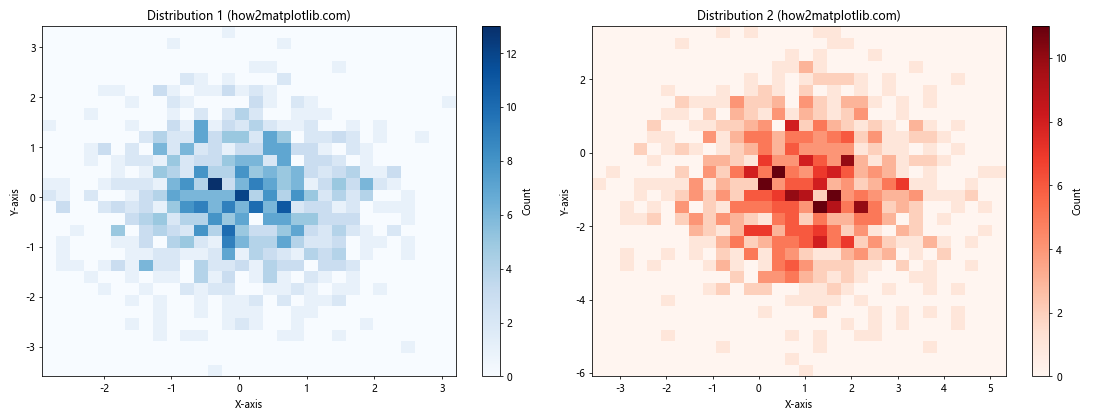
这个例子创建了两个并排的2D直方图,用于比较两个不同的数据分布。
5.2 3D表面图
我们可以将2D直方图数据转换为3D表面图,以提供另一种视角:
import numpy as np
import matplotlib.pyplot as plt
from mpl_toolkits.mplot3d import Axes3D

np.random.seed(10)
x = np.random.normal(0, 1, 1000)
y = np.random.normal(0, 1, 1000)

hist, xedges, yedges = np.histogram2d(x, y, bins=20)
xpos, ypos = np.meshgrid(xedges[:-1] + 0.25, yedges[:-1] + 0.25, indexing="ij")
xpos = xpos.ravel()
ypos = ypos.ravel()
zpos = 0

dx = dy = 0.5 * np.ones_like(zpos)
dz = hist.ravel()

fig = plt.figure(figsize=(10, 8))
ax = fig.add_subplot(111, projection='3d')
ax.bar3d(xpos, ypos, zpos, dx, dy, dz, zsort='average',cmap='viridis')
ax.set_xlabel('X-axis (how2matplotlib.com)')
ax.set_ylabel('Y-axis (how2matplotlib.com)')
ax.set_zlabel('Count')
ax.set_title('3D Histogram (how2matplotlib.com)')
plt.show()
Output:
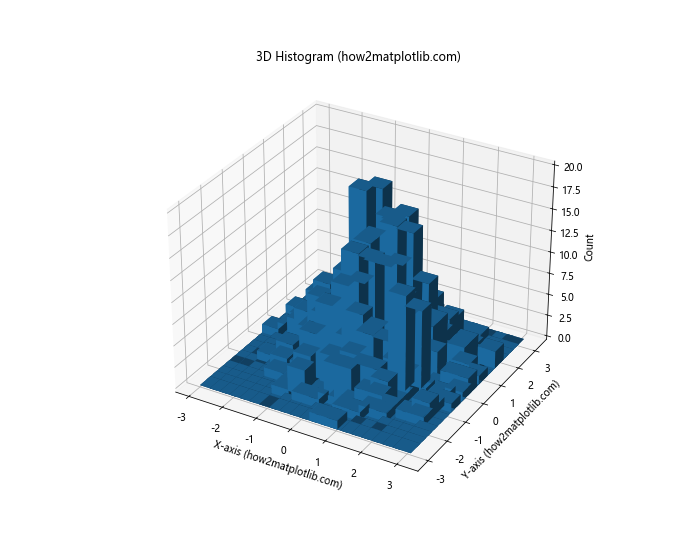
这个例子将2D直方图数据转换为3D柱状图,提供了数据分布的立体视图。
5.3 动态调整颜色范围
有时我们需要动态调整颜色范围以突出特定的数据特征:
import numpy as np
import matplotlib.pyplot as plt
from matplotlib.colors import LogNorm

np.random.seed(11)
x = np.random.normal(0, 1, 10000)
y = np.random.normal(0, 1, 10000)

fig, (ax1, ax2) = plt.subplots(1, 2, figsize=(16, 6))

hist1 = ax1.hist2d(x, y, bins=50, norm=LogNorm(), cmap='viridis')
fig.colorbar(hist1[3], ax=ax1, label='Log Count')
ax1.set_title('Log-scaled 2D Histogram (how2matplotlib.com)')
ax1.set_xlabel('X-axis')
ax1.set_ylabel('Y-axis')

hist2 = ax2.hist2d(x, y, bins=50, cmap='viridis', vmin=0, vmax=50)
fig.colorbar(hist2[3], ax=ax2, label='Count (capped at 50)')
ax2.set_title('2D Histogram with Capped Color Scale (how2matplotlib.com)')
ax2.set_xlabel('X-axis')
ax2.set_ylabel('Y-axis')

plt.tight_layout()
plt.show()
Output:
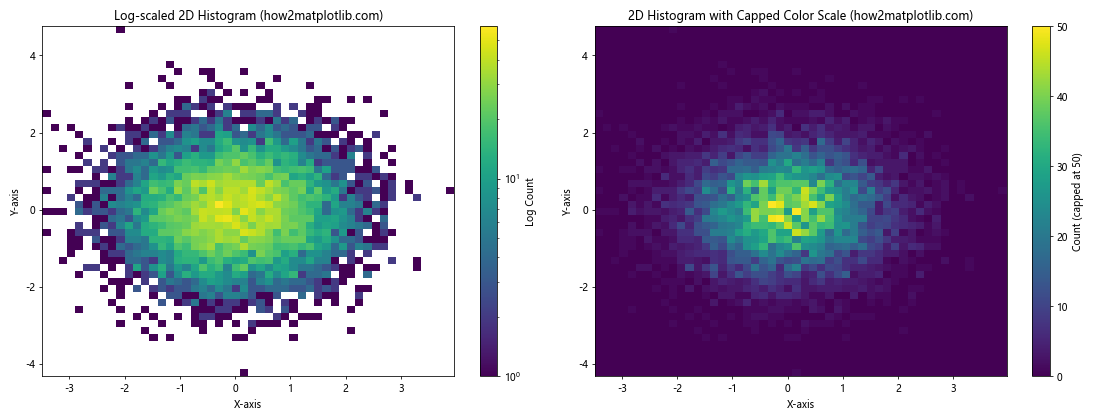
这个例子展示了两种调整颜色范围的方法:使用对数刻度和设置最大值。
6. 实际应用场景
6.1 气象数据可视化
2D直方图在气象数据分析中非常有用,例如可视化温度和湿度的关系:
import numpy as np
import matplotlib.pyplot as plt

np.random.seed(12)
temperature = np.random.normal(25, 5, 1000)  # 模拟温度数据
humidity = 50 + 0.5 * temperature + np.random.normal(0, 10, 1000)  # 模拟湿度数据

plt.figure(figsize=(10, 8))
plt.hist2d(temperature, humidity, bins=30, cmap='YlOrRd')
plt.colorbar(label='Frequency')
plt.xlabel('Temperature (°C) (how2matplotlib.com)')
plt.ylabel('Humidity (%) (how2matplotlib.com)')
plt.title('Temperature vs Humidity Distribution (how2matplotlib.com)')
plt.show()
Output:
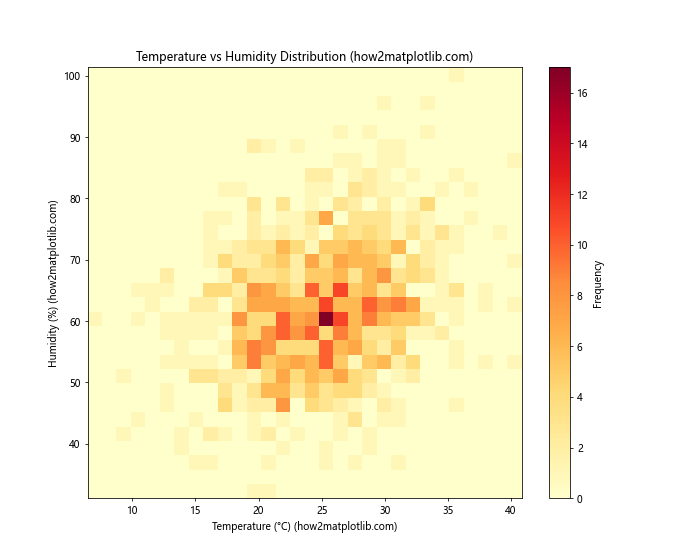
这个例子模拟了温度和湿度的关系,并使用2D直方图来可视化它们的分布。
6.2 图像处理
2D直方图也可以用于图像处理,例如分析图像的颜色分布:
import numpy as np
import matplotlib.pyplot as plt

# 创建一个模拟的彩色图像
np.random.seed(13)
image = np.random.randint(0, 256, (100, 100, 3), dtype=np.uint8)

r = image[:,:,0].flatten()
g = image[:,:,1].flatten()

plt.figure(figsize=(10, 8))
plt.hist2d(r, g, bins=50, cmap='viridis')
plt.colorbar(label='Pixel Count')
plt.xlabel('Red Channel (how2matplotlib.com)')
plt.ylabel('Green Channel (how2matplotlib.com)')
plt.title('Color Distribution: Red vs Green (how2matplotlib.com)')
plt.show()
Output:
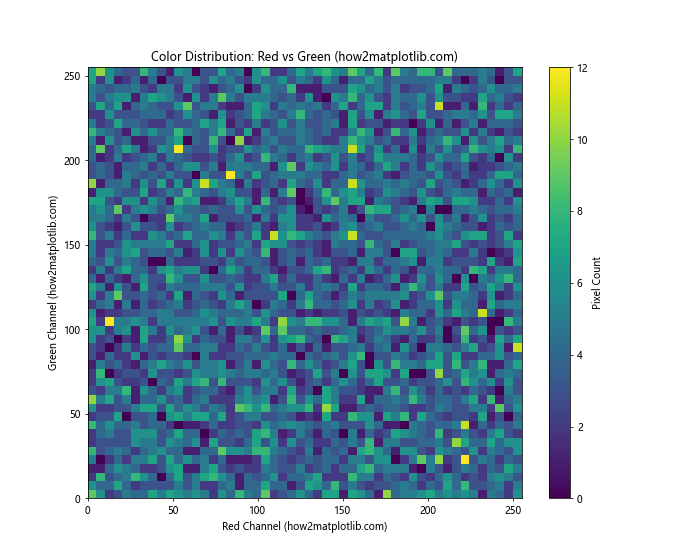
这个例子分析了一个模拟图像中红色和绿色通道的分布情况。
6.3 金融数据分析
在金融领域,2D直方图可以用来分析不同资产的回报率关系:
import numpy as np
import matplotlib.pyplot as plt

np.random.seed(14)
asset1_returns = np.random.normal(0.05, 0.1, 1000)  # 资产1的回报率
asset2_returns = 0.03 + 0.5 * asset1_returns + np.random.normal(0, 0.05, 1000)  # 资产2的回报率

plt.figure(figsize=(10, 8))
plt.hexbin(asset1_returns, asset2_returns, gridsize=20, cmap='coolwarm')
plt.colorbar(label='Frequency')
plt.xlabel('Asset 1 Returns (how2matplotlib.com)')
plt.ylabel('Asset 2 Returns (how2matplotlib.com)')
plt.title('Asset Returns Correlation (how2matplotlib.com)')
plt.show()
Output:
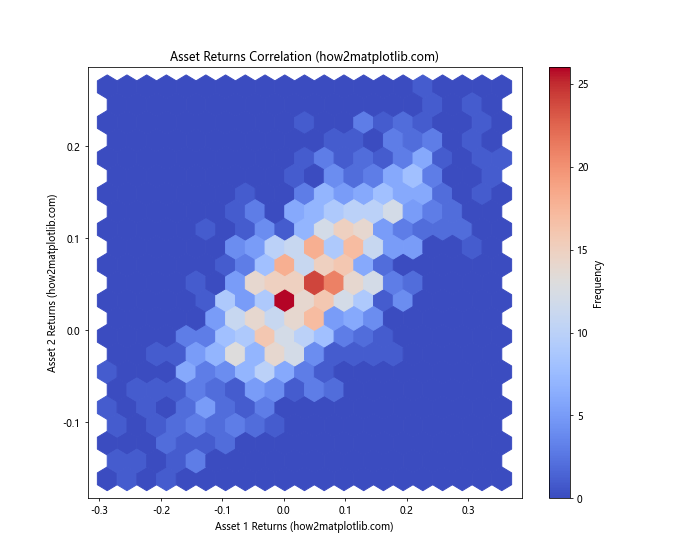
这个例子展示了如何使用六边形bin来可视化两种资产回报率之间的关系。
7. 性能优化和大数据处理
当处理大量数据点时,2D直方图的绘制可能会变得很慢。以下是一些优化建议:
7.1 使用 datashader 库
对于非常大的数据集,可以考虑使用 datashader 库:
import datashader as ds
import datashader.transfer_functions as tf
import pandas as pd
import numpy as np
import matplotlib.pyplot as plt

np.random.seed(15)
df = pd.DataFrame({
    'x': np.random.randn(1000000),
    'y': np.random.randn(1000000)
})

canvas = ds.Canvas(plot_width=400, plot_height=400)
agg = canvas.points(df, 'x', 'y')
img = tf.shade(agg, cmap=['white', 'navy'])

plt.figure(figsize=(10, 8))
plt.imshow(img.to_pil())
plt.title('Large Dataset Visualization with Datashader (how2matplotlib.com)')
plt.xlabel('X-axis')
plt.ylabel('Y-axis')
plt.show()
这个例子使用 datashader 来高效地处理和可视化100万个数据点。
7.2 数据降采样
对于大型数据集,可以考虑在绘图之前进行降采样:
import numpy as np
import matplotlib.pyplot as plt

np.random.seed(16)
x = np.random.randn(1000000)
y = np.random.randn(1000000)

# 随机选择10%的数据点
sample_size = len(x) // 10
indices = np.random.choice(len(x), sample_size, replace=False)
x_sample = x[indices]
y_sample = y[indices]

plt.figure(figsize=(10, 8))
plt.hist2d(x_sample, y_sample, bins=100, cmap='viridis')
plt.colorbar(label='Count')
plt.xlabel('X-axis (how2matplotlib.com)')
plt.ylabel('Y-axis (how2matplotlib.com)')
plt.title('Downsampled 2D Histogram (how2matplotlib.com)')
plt.show()
Output:
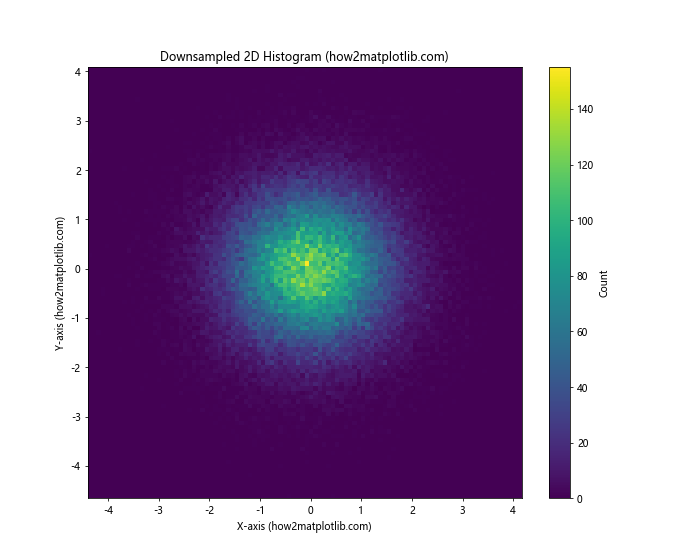
这个例子演示了如何通过随机抽样来减少数据点的数量,从而加快绘图速度。
8. 总结
2D直方图是一种强大的数据可视化工具,可以帮助我们理解二维数据的分布和关系。通过Matplotlib,我们可以创建各种类型的2D直方图,包括矩形bin、六边形bin,以及更灵活的网格图。
本文详细介绍了使用plt.hist2d()、plt.hexbin()和ax.pcolormesh()等函数创建2D直方图的方法,并提供了多个实际应用场景的示例。我们还讨论了如何自定义颜色映射、添加轮廓线、创建3D表面图等高级技巧,以及如何处理大型数据集的性能优化问题。
在实际应用中,2D直方图可以用于各种领域,如气象数据分析、图像处理和金融数据可视化等。通过合理选择bin的数量、颜色映射和统计方法,我们可以有效地揭示数据中的模式和关系。
最后,对于大规模数据集,我们还介绍了使用datashader库和数据降采样等技术来提高绘图效率。这些方法可以帮助我们在处理海量数据时仍能保持良好的可视化效果和性能。
通过掌握这些技巧和方法,你将能够更加灵活和高效地使用Matplotlib创建2D直方图,从而更好地理解和展示你的数据。
 极客笔记
极客笔记