Matplotlib中的axis.Axis.properties()函数:全面解析与应用
参考:Matplotlib.axis.Axis.properties() function in Python
Matplotlib是Python中最流行的数据可视化库之一,它提供了丰富的绘图功能和自定义选项。在Matplotlib中,axis.Axis.properties()函数是一个强大的工具,用于获取和设置坐标轴的各种属性。本文将深入探讨这个函数的用法、特性以及在实际绘图中的应用。
1. axis.Axis.properties()函数简介
axis.Axis.properties()函数是Matplotlib库中Axis类的一个方法。它允许用户查询和修改坐标轴的各种属性,如标签、刻度、颜色等。这个函数不仅可以返回当前坐标轴的所有属性,还可以用于设置新的属性值。
1.1 基本语法
import matplotlib.pyplot as plt

fig, ax = plt.subplots()
axis_properties = ax.xaxis.properties()
print("Axis properties:", axis_properties)
plt.title("How2matplotlib.com - Axis Properties Example")
plt.show()
Output:
在这个例子中,我们创建了一个简单的图形,并使用properties()方法获取x轴的所有属性。这个函数不需要任何参数,它会返回一个包含所有属性及其当前值的字典。
1.2 返回值解析
properties()函数返回的字典包含了大量信息,涵盖了坐标轴的几乎所有方面。一些常见的属性包括:
label:坐标轴标签major_locator:主刻度定位器minor_locator:次刻度定位器major_formatter:主刻度格式化器minor_formatter:次刻度格式化器tick_params:刻度参数gridlines:网格线设置
2. 查询特定属性
虽然properties()函数返回所有属性,但有时我们只需要查看特定的属性。这可以通过直接访问返回字典中的特定键来实现。
import matplotlib.pyplot as plt

fig, ax = plt.subplots()
axis_props = ax.xaxis.properties()
print("X-axis label:", axis_props['label'])
print("Major tick locator:", axis_props['major_locator'])
plt.title("How2matplotlib.com - Specific Axis Properties")
plt.show()
Output:
这个例子展示了如何获取x轴的标签和主刻度定位器。这种方法使得我们可以快速查看我们最关心的属性,而不必处理整个属性字典。
3. 修改坐标轴属性
properties()函数不仅可以用于查询属性,还可以用于修改属性。虽然直接修改返回的字典不会改变实际的坐标轴属性,但我们可以使用这个函数来了解可以修改哪些属性,然后使用相应的setter方法来更新这些属性。
import matplotlib.pyplot as plt

fig, ax = plt.subplots()
ax.set_xlabel("X-axis")
ax.set_ylabel("Y-axis")

# 修改x轴属性
ax.xaxis.label.set_color('red')
ax.xaxis.label.set_fontsize(14)

# 修改y轴属性
ax.yaxis.label.set_color('blue')
ax.yaxis.label.set_fontsize(14)

plt.title("How2matplotlib.com - Modified Axis Properties")
plt.show()
Output:
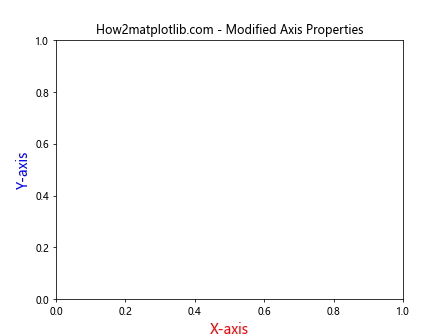
在这个例子中,我们修改了x轴和y轴标签的颜色和字体大小。虽然我们没有直接使用properties()函数,但了解可用的属性有助于我们知道可以修改哪些方面。
4. 自定义刻度
坐标轴的一个重要方面是刻度的设置。properties()函数可以帮助我们了解当前的刻度设置,然后我们可以根据需要进行自定义。
import matplotlib.pyplot as plt
import matplotlib.ticker as ticker

fig, ax = plt.subplots()

# 设置x轴的主刻度和次刻度
ax.xaxis.set_major_locator(ticker.MultipleLocator(1))
ax.xaxis.set_minor_locator(ticker.MultipleLocator(0.2))

# 设置y轴的主刻度和次刻度
ax.yaxis.set_major_locator(ticker.MultipleLocator(0.5))
ax.yaxis.set_minor_locator(ticker.MultipleLocator(0.1))

ax.set_xlim(0, 5)
ax.set_ylim(0, 2)

plt.title("How2matplotlib.com - Custom Tick Locations")
plt.show()
Output:
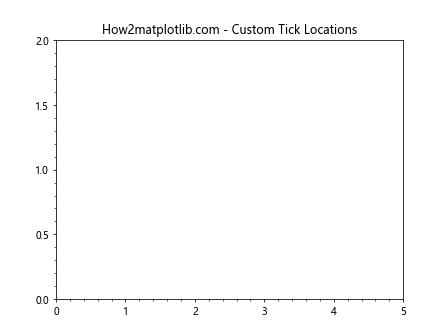
这个例子展示了如何自定义x轴和y轴的主刻度和次刻度。我们使用MultipleLocator来设置刻度的间隔,这样可以更精确地控制图表的刻度显示。
5. 格式化刻度标签
除了刻度的位置,我们还可以自定义刻度标签的格式。properties()函数可以帮助我们了解当前的格式化器设置。
import matplotlib.pyplot as plt
import matplotlib.ticker as ticker

fig, ax = plt.subplots()

# 自定义x轴刻度标签格式
def x_fmt(x, pos):
    return f"x={x:.1f}"

ax.xaxis.set_major_formatter(ticker.FuncFormatter(x_fmt))

# 自定义y轴刻度标签格式
def y_fmt(y, pos):
    return f"{y:.2f}%"

ax.yaxis.set_major_formatter(ticker.FuncFormatter(y_fmt))

ax.set_xlim(0, 5)
ax.set_ylim(0, 1)

plt.title("How2matplotlib.com - Custom Tick Formatters")
plt.show()
Output:
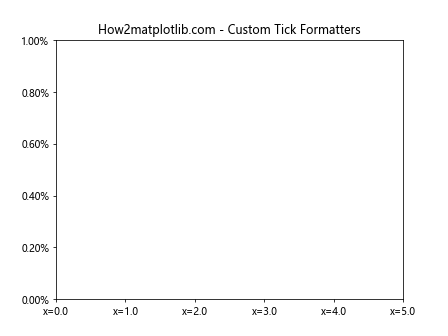
在这个例子中,我们为x轴和y轴定义了自定义的格式化函数。这允许我们完全控制刻度标签的显示方式,例如添加前缀、后缀或改变数字的精度。
6. 设置网格线
网格线是图表中的重要元素,可以帮助读者更准确地解读数据。properties()函数可以帮助我们了解当前的网格线设置。
import matplotlib.pyplot as plt

fig, ax = plt.subplots()

# 显示主网格线
ax.grid(which='major', color='#CCCCCC', linestyle='--')

# 显示次网格线
ax.grid(which='minor', color='#CCCCCC', linestyle=':')

# 设置次刻度
ax.xaxis.set_minor_locator(plt.MultipleLocator(0.5))
ax.yaxis.set_minor_locator(plt.MultipleLocator(0.1))

ax.set_xlim(0, 5)
ax.set_ylim(0, 1)

plt.title("How2matplotlib.com - Custom Grid Lines")
plt.show()
Output:
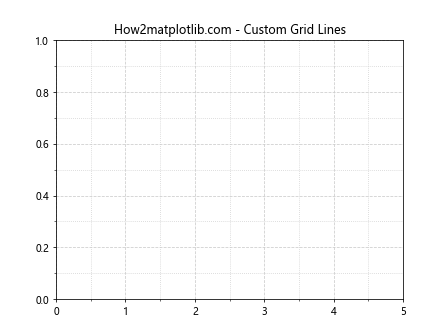
这个例子展示了如何添加主网格线和次网格线,并自定义它们的样式。主网格线使用虚线,次网格线使用点线,这有助于区分不同级别的网格。
7. 自定义坐标轴范围和比例
properties()函数还可以帮助我们了解坐标轴的当前范围和比例设置。我们可以根据需要调整这些属性以更好地展示数据。
import matplotlib.pyplot as plt
import numpy as np

fig, (ax1, ax2) = plt.subplots(1, 2, figsize=(12, 5))

# 线性刻度
x = np.linspace(0, 10, 100)
y = np.exp(x)
ax1.plot(x, y)
ax1.set_title("How2matplotlib.com - Linear Scale")
ax1.set_xlabel("X-axis")
ax1.set_ylabel("Y-axis")

# 对数刻度
ax2.plot(x, y)
ax2.set_yscale('log')
ax2.set_title("How2matplotlib.com - Log Scale")
ax2.set_xlabel("X-axis")
ax2.set_ylabel("Y-axis (log)")

plt.tight_layout()
plt.show()
Output:
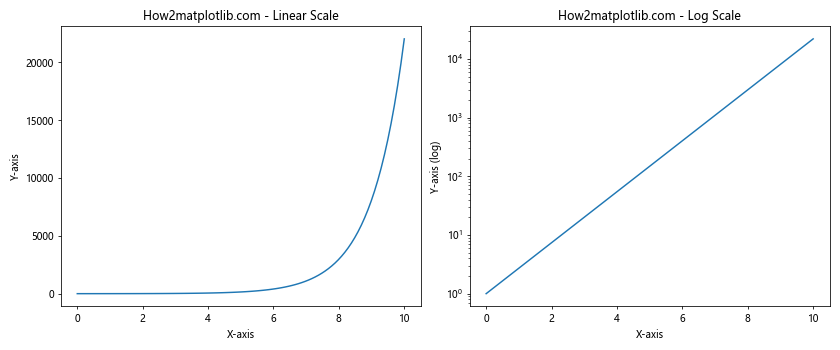
这个例子展示了如何在一个图中使用线性刻度,在另一个图中使用对数刻度。对数刻度对于展示跨越多个数量级的数据特别有用。
8. 旋转刻度标签
当x轴标签很长或者数量很多时,可能会发生重叠。在这种情况下,旋转刻度标签是一个有用的技巧。
import matplotlib.pyplot as plt
import numpy as np

fig, ax = plt.subplots(figsize=(10, 5))

x = np.arange(10)
y = np.random.rand(10)

ax.bar(x, y)
ax.set_xticks(x)
ax.set_xticklabels(['Label'+str(i) for i in range(10)], rotation=45, ha='right')

plt.title("How2matplotlib.com - Rotated Tick Labels")
plt.tight_layout()
plt.show()
Output:
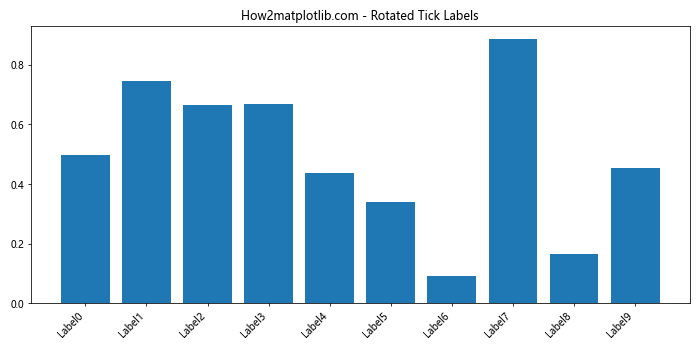
在这个例子中,我们创建了一个条形图,并将x轴的刻度标签旋转了45度。这样可以防止长标签重叠,同时保持标签的可读性。
9. 双坐标轴
有时,我们需要在同一个图中显示具有不同范围或单位的两组数据。这时可以使用双坐标轴。
import matplotlib.pyplot as plt
import numpy as np

fig, ax1 = plt.subplots()

x = np.linspace(0, 10, 100)
y1 = np.sin(x)
y2 = np.exp(x)

ax1.plot(x, y1, 'b-', label='sin(x)')
ax1.set_xlabel('X-axis')
ax1.set_ylabel('sin(x)', color='b')
ax1.tick_params(axis='y', labelcolor='b')

ax2 = ax1.twinx()  # 创建共享x轴的第二个y轴
ax2.plot(x, y2, 'r-', label='exp(x)')
ax2.set_ylabel('exp(x)', color='r')
ax2.tick_params(axis='y', labelcolor='r')

plt.title("How2matplotlib.com - Dual Y-axes")
fig.legend(loc="upper right", bbox_to_anchor=(1,1), bbox_transform=ax1.transAxes)

plt.tight_layout()
plt.show()
Output:
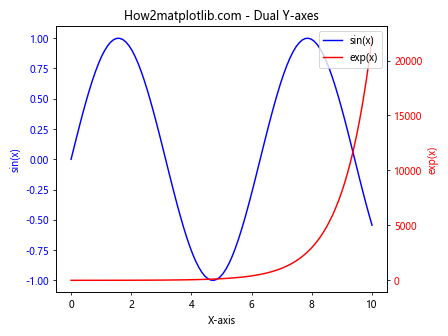
这个例子展示了如何创建具有两个y轴的图表。左侧y轴显示sin(x),右侧y轴显示exp(x)。这种方法允许我们在同一个图中比较具有不同范围的数据。
10. 极坐标系
除了常见的笛卡尔坐标系,Matplotlib还支持极坐标系。properties()函数在极坐标系中同样适用。
import matplotlib.pyplot as plt
import numpy as np

fig, ax = plt.subplots(subplot_kw=dict(projection='polar'))

r = np.arange(0, 2, 0.01)
theta = 2 * np.pi * r

ax.plot(theta, r)
ax.set_rticks([0.5, 1, 1.5, 2])
ax.set_rlabel_position(45)

plt.title("How2matplotlib.com - Polar Plot")
plt.show()
Output:
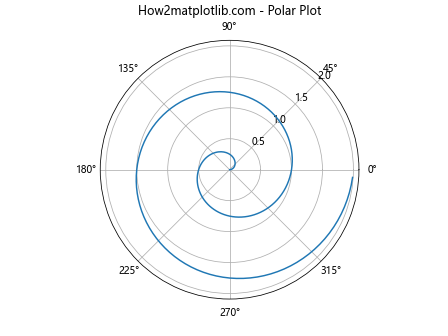
这个例子创建了一个简单的极坐标图。我们可以使用set_rticks()来设置径向刻度,使用set_rlabel_position()来调整径向标签的位置。
11. 3D图表
Matplotlib还支持3D图表,虽然3D轴的属性与2D轴略有不同,但properties()函数仍然可以用来查询和了解这些属性。
import matplotlib.pyplot as plt
import numpy as np
from mpl_toolkits.mplot3d import Axes3D

fig = plt.figure()
ax = fig.add_subplot(111, projection='3d')

x = np.arange(-5, 5, 0.25)
y = np.arange(-5, 5, 0.25)
X, Y = np.meshgrid(x, y)
R = np.sqrt(X**2 + Y**2)
Z = np.sin(R)

surf = ax.plot_surface(X, Y, Z, cmap='viridis')

ax.set_xlabel('X-axis')
ax.set_ylabel('Y-axis')
ax.set_zlabel('Z-axis')

plt.title("How2matplotlib.com - 3D Surface Plot")
plt.colorbar(surf)
plt.show()
Output:
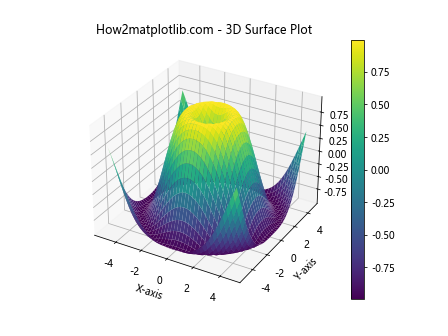
这个例子创建了一个3D表面图。在3D图中,我们可以设置x、y和z轴的标签和刻度。颜色条(colorbar)用于显示Z值的范围。
12. 自定义刻度位置和标签
有时,默认的刻度位置和标签可能不能满足我们的需求。在这种情况下,我们可以完全自定义刻度的位置和对应的标签。
import matplotlib.pyplot as plt
import numpy as np

fig, ax = plt.subplots()

x = np.linspace(0, 2*np.pi, 100)
y = np.sin(x)

ax.plot(x, y)

# 自定义x轴刻度
x_ticks = [0, np.pi/2, np.pi, 3*np.pi/2, 2*np.pi]
x_labels = ['0', 'π/2', 'π', '3π/2', '2π']
ax.set_xticks(x_ticks)
ax.set_xticklabels(x_labels)

# 自定义y轴刻度
y_ticks = [-1, -0.5, 0, 0.5, 1]
ax.set_yticks(y_ticks)

plt.title("How2matplotlib.com - Custom Tick Positions and Labels")
plt.xlabel("X-axis")
plt.ylabel("Y-axis")
plt.grid(True)
plt.show()
Output:
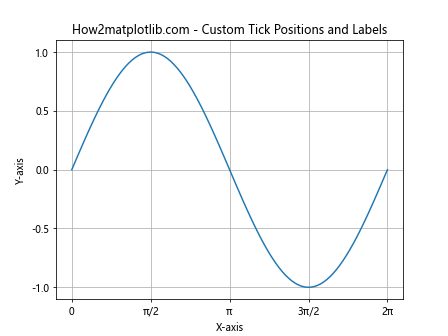
这个例子展示了如何自定义x轴和y轴的刻度位置和标签。对于x轴,我们使用了数学符号来表示π的倍数;对于y轴,我们选择了均匀分布的刻度值。
13. 坐标轴的颜色和样式
properties()函数可以帮助我们了解坐标轴的当前颜色和样式设置。我们可以根据需要自定义这些属性,以创建更具视觉吸引力的图表。
import matplotlib.pyplot as plt
import numpy as np

fig, ax = plt.subplots()

x = np.linspace(0, 10, 100)
y = np.sin(x)

ax.plot(x, y)

# 自定义坐标轴颜色和样式
ax.spines['bottom'].set_color('blue')
ax.spines['left'].set_color('red')
ax.spines['top'].set_visible(False)
ax.spines['right'].set_visible(False)

ax.xaxis.label.set_color('blue')
ax.yaxis.label.set_color('red')

ax.tick_params(axis='x', colors='blue')
ax.tick_params(axis='y', colors='red')

plt.title("How2matplotlib.com - Custom Axis Colors and Styles")
plt.xlabel("X-axis")
plt.ylabel("Y-axis")
plt.show()
Output:
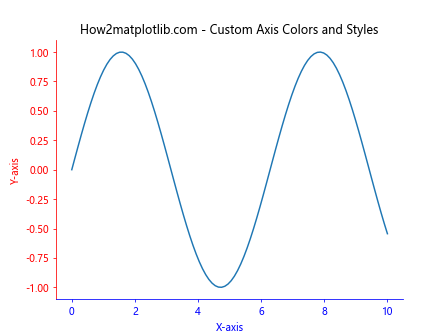
在这个例子中,我们将x轴相关的元素(包括轴线、标签和刻度)设置为蓝色,y轴相关的元素设置为红色。同时,我们隐藏了顶部和右侧的轴线,创造了一个更简洁的外观。
14. 对数刻度和线性刻度的混合使用
有时,我们可能需要在一个图表中同时使用对数刻度和线性刻度。properties()函数可以帮助我们了解每个轴的当前刻度类型。
import matplotlib.pyplot as plt
import numpy as np

fig, ax = plt.subplots()

x = np.logspace(0, 3, 50)
y = x**2

ax.plot(x, y)

ax.set_xscale('log')
ax.set_yscale('linear')

ax.set_xlabel('X-axis (log scale)')
ax.set_ylabel('Y-axis (linear scale)')

plt.title("How2matplotlib.com - Mixed Log and Linear Scales")
plt.grid(True)
plt.show()
Output:
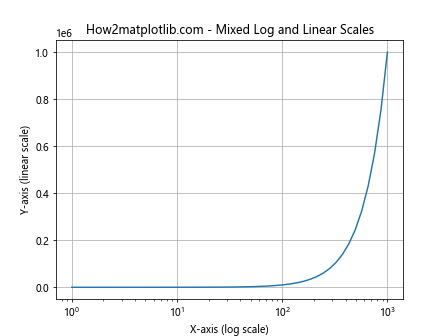
这个例子展示了如何在x轴使用对数刻度,而在y轴使用线性刻度。这种混合使用对于某些类型的数据可能特别有用,例如当x值跨越多个数量级,但y值的变化相对较小时。
15. 坐标轴的范围和方向
properties()函数还可以帮助我们了解坐标轴的当前范围和方向。我们可以根据需要调整这些属性,以更好地展示数据或创造特殊的视觉效果。
import matplotlib.pyplot as plt
import numpy as np

fig, (ax1, ax2) = plt.subplots(1, 2, figsize=(12, 5))

x = np.linspace(0, 10, 100)
y = np.sin(x)

# 正常方向的坐标轴
ax1.plot(x, y)
ax1.set_xlim(0, 10)
ax1.set_ylim(-1, 1)
ax1.set_title("How2matplotlib.com - Normal Axis")

# 反转的坐标轴
ax2.plot(x, y)
ax2.set_xlim(10, 0)  # 反转x轴
ax2.set_ylim(1, -1)  # 反转y轴
ax2.set_title("How2matplotlib.com - Inverted Axis")

plt.tight_layout()
plt.show()
Output:
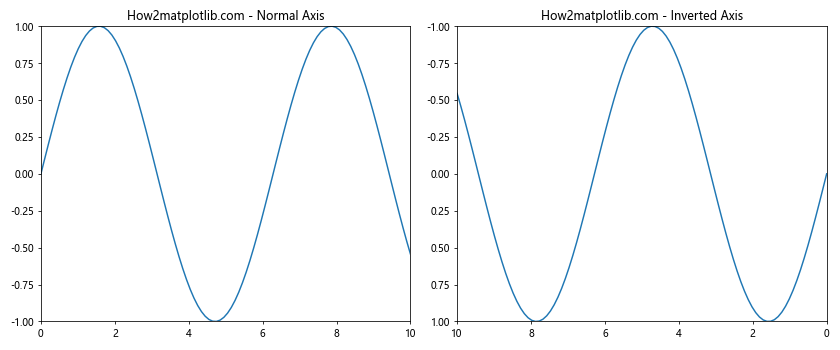
这个例子展示了如何通过设置轴的范围来改变轴的方向。在右侧的子图中,我们反转了x轴和y轴的方向,创造了一个镜像效果。
16. 坐标轴的位置
默认情况下,x轴位于y=0的位置,y轴位于x=0的位置。但是,我们可以根据需要调整坐标轴的位置。
import matplotlib.pyplot as plt
import numpy as np

fig, ax = plt.subplots()

x = np.linspace(-5, 5, 100)
y = x**2

ax.plot(x, y)

# 将坐标轴移动到中心
ax.spines['left'].set_position('center')
ax.spines['bottom'].set_position('center')

# 隐藏顶部和右侧的轴线
ax.spines['top'].set_visible(False)
ax.spines['right'].set_visible(False)

ax.set_title("How2matplotlib.com - Centered Axes")
plt.show()
Output:
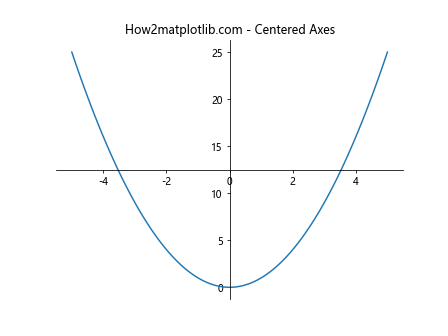
在这个例子中,我们将x轴和y轴移动到了图的中心,创造了一个类似于数学坐标系的效果。这种布局对于展示某些类型的函数(如二次函数)特别有用。
17. 极坐标系中的自定义刻度
在极坐标系中,我们可以自定义角度刻度和径向刻度。properties()函数可以帮助我们了解当前的刻度设置。
import matplotlib.pyplot as plt
import numpy as np

fig, ax = plt.subplots(subplot_kw=dict(projection='polar'))

r = np.arange(0, 2, 0.01)
theta = 2 * np.pi * r

ax.plot(theta, r)

# 自定义角度刻度
ax.set_thetagrids([0, 45, 90, 135, 180, 225, 270, 315])

# 自定义径向刻度
ax.set_rticks([0.5, 1, 1.5])

ax.set_title("How2matplotlib.com - Custom Polar Ticks")
plt.show()
Output:
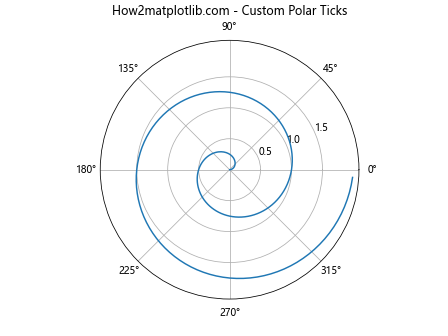
这个例子展示了如何在极坐标图中自定义角度刻度和径向刻度。我们将角度刻度设置为45度的倍数,径向刻度设置为0.5的倍数。
18. 坐标轴标签的数学表达式
Matplotlib支持在标签中使用LaTeX风格的数学表达式。这对于显示复杂的数学公式特别有用。
import matplotlib.pyplot as plt
import numpy as np

fig, ax = plt.subplots()

x = np.linspace(0, 2*np.pi, 100)
y = np.sin(x)

ax.plot(x, y)

ax.set_xlabel(r'\theta (radians)')
ax.set_ylabel(r'\sin(\theta)')

ax.set_title(r"How2matplotlib.com - \int_{0}^{2\pi} \sin(x) dx = 0")

plt.show()
Output:
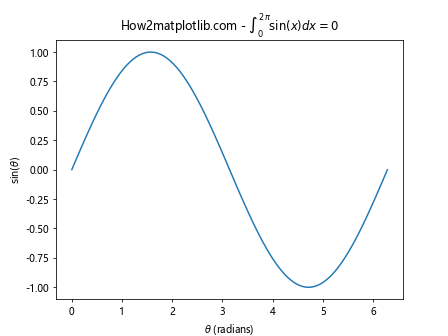
在这个例子中,我们使用LaTeX语法在x轴标签中显示θ符号,在y轴标签中显示sin(θ)函数。标题中还包含了一个积分表达式。
19. 坐标轴刻度的密度控制
有时,默认的刻度密度可能太高或太低。我们可以使用MaxNLocator来控制刻度的数量。
import matplotlib.pyplot as plt
import numpy as np
from matplotlib.ticker import MaxNLocator

fig, (ax1, ax2) = plt.subplots(1, 2, figsize=(12, 5))

x = np.linspace(0, 10, 100)
y = np.sin(x)

# 默认刻度
ax1.plot(x, y)
ax1.set_title("How2matplotlib.com - Default Ticks")

# 自定义刻度密度
ax2.plot(x, y)
ax2.xaxis.set_major_locator(MaxNLocator(5))  # 最多5个刻度
ax2.yaxis.set_major_locator(MaxNLocator(4))  # 最多4个刻度
ax2.set_title("How2matplotlib.com - Custom Tick Density")

plt.tight_layout()
plt.show()
Output:
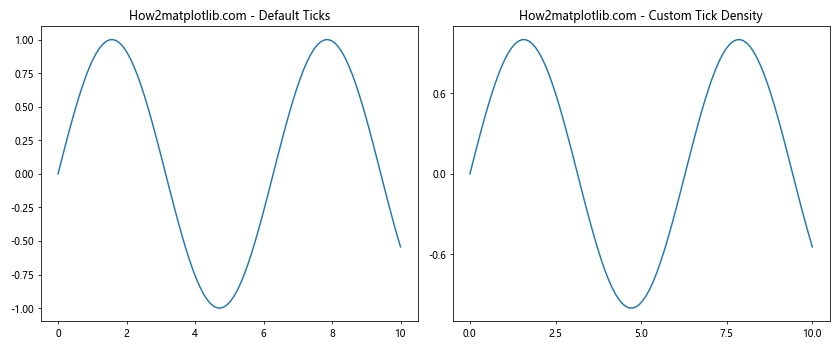
这个例子展示了如何使用MaxNLocator来控制x轴和y轴的刻度数量。右侧的子图有更少的刻度,可能更适合某些类型的数据展示。
20. 坐标轴刻度的偏移文本
当坐标轴的值很大时,Matplotlib会自动使用科学记数法并显示一个偏移文本。我们可以自定义这个偏移文本的位置和格式。
import matplotlib.pyplot as plt
import numpy as np

fig, (ax1, ax2) = plt.subplots(1, 2, figsize=(12, 5))

x = np.linspace(0, 1, 100)
y = x + 1e5

# 默认偏移文本
ax1.plot(x, y)
ax1.set_title("How2matplotlib.com - Default Offset")

# 自定义偏移文本
ax2.plot(x, y)
ax2.ticklabel_format(style='sci', axis='y', scilimits=(0,0))
ax2.yaxis.get_offset_text().set_x(-0.1)  # 移动偏移文本的位置
ax2.set_title("How2matplotlib.com - Custom Offset")

plt.tight_layout()
plt.show()
Output:
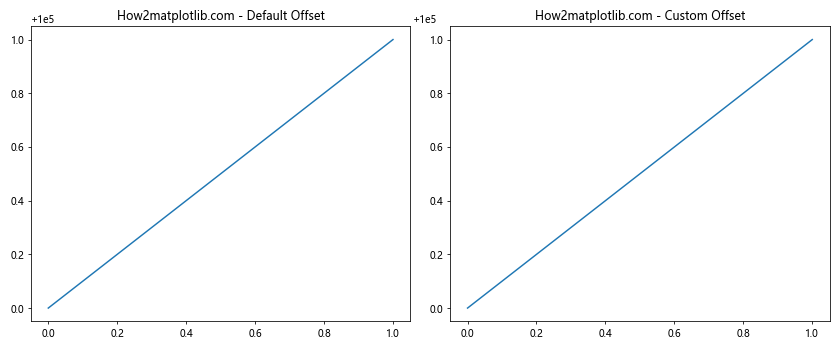
在这个例子中,右侧的子图自定义了y轴的偏移文本。我们强制使用科学记数法,并将偏移文本向左移动,使其更靠近y轴。
总结:
本文深入探讨了Matplotlib中axis.Axis.properties()函数的用法及其在图表定制中的应用。我们涵盖了从基本的坐标轴属性查询到高级的图表定制技巧,包括刻度设置、标签格式化、坐标系转换等多个方面。通过这些示例,读者可以更好地理解和利用Matplotlib强大的坐标轴定制功能,创建出更专业、更具表现力的数据可视化图表。无论是进行科学研究、数据分析还是创建报告,掌握这些技巧都将大大提升您的数据可视化能力。
 极客笔记
极客笔记