Matplotlib中的axis.Axis.update_units()函数详解与应用
参考:Matplotlib.axis.Axis.update_units() function in Python
Matplotlib是Python中最流行的数据可视化库之一,它提供了丰富的绘图功能和灵活的自定义选项。在Matplotlib中,axis.Axis.update_units()函数是一个重要的方法,用于更新坐标轴的单位。本文将深入探讨这个函数的用法、特点和应用场景,帮助读者更好地理解和使用它来优化图表的单位显示。
1. axis.Axis.update_units()函数简介
axis.Axis.update_units()是Matplotlib库中Axis类的一个方法。这个函数的主要作用是更新坐标轴的单位信息。当我们需要改变坐标轴的单位,或者在绘图过程中动态调整单位时,这个函数就显得尤为重要。
1.1 基本语法
import matplotlib.pyplot as plt

fig, ax = plt.subplots()
ax.xaxis.update_units(new_units)
ax.yaxis.update_units(new_units)

plt.title("How to use update_units() - how2matplotlib.com")
plt.show()
在这个基本示例中,我们创建了一个图表,然后分别对x轴和y轴调用update_units()方法来更新单位。new_units参数是一个新的单位对象,用于替换原有的单位。
2. 单位系统在Matplotlib中的重要性
在数据可视化中,正确表示数据的单位至关重要。Matplotlib提供了灵活的单位系统,允许用户自定义和更新坐标轴的单位。这不仅能够提高图表的可读性,还能确保数据的准确性和一致性。
2.1 默认单位示例
import matplotlib.pyplot as plt
import numpy as np

x = np.linspace(0, 10, 100)
y = np.sin(x)

fig, ax = plt.subplots()
ax.plot(x, y)
ax.set_xlabel("X axis (default units) - how2matplotlib.com")
ax.set_ylabel("Y axis (default units) - how2matplotlib.com")
plt.title("Default units example - how2matplotlib.com")
plt.show()
Output:
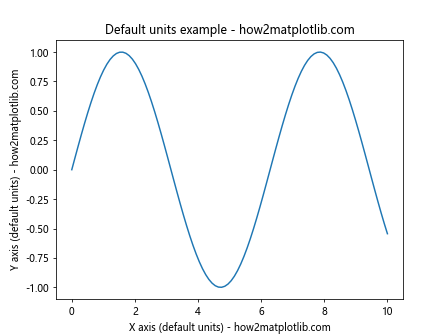
这个例子展示了Matplotlib的默认单位设置。在没有明确指定单位的情况下,坐标轴使用默认的数值刻度。
3. 使用update_units()更新单位
update_units()函数允许我们在绘图过程中动态更改坐标轴的单位。这在处理不同量纲的数据或需要在同一图表中展示多种单位时特别有用。
3.1 更新为自定义单位
import matplotlib.pyplot as plt
import numpy as np

class CustomUnit:
    def __init__(self, name):
        self.name = name

    def __str__(self):
        return self.name

x = np.linspace(0, 10, 100)
y = np.sin(x)

fig, ax = plt.subplots()
ax.plot(x, y)

custom_unit = CustomUnit("meters - how2matplotlib.com")
ax.xaxis.update_units(custom_unit)
ax.yaxis.update_units(custom_unit)

ax.set_xlabel("X axis")
ax.set_ylabel("Y axis")
plt.title("Custom units example - how2matplotlib.com")
plt.show()
Output:
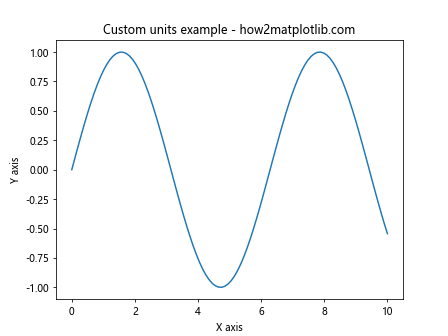
在这个例子中,我们定义了一个自定义的CustomUnit类,并使用update_units()方法将其应用到x轴和y轴上。这展示了如何使用自定义单位来增强图表的可读性。
4. 结合其他Matplotlib功能使用update_units()
update_units()函数可以与Matplotlib的其他功能无缝集成,以创建更复杂和信息丰富的图表。
4.1 结合刻度标签使用
import matplotlib.pyplot as plt
import numpy as np

class TemperatureUnit:
    def __init__(self, scale):
        self.scale = scale

    def __str__(self):
        return f"{self.scale} - how2matplotlib.com"

x = np.linspace(0, 10, 100)
y = 20 + 10 * np.sin(x)

fig, ax = plt.subplots()
ax.plot(x, y)

temp_unit = TemperatureUnit("°C")
ax.yaxis.update_units(temp_unit)

ax.set_xlabel("Time (s)")
ax.set_ylabel("Temperature")
plt.title("Temperature over time - how2matplotlib.com")
plt.show()
Output:
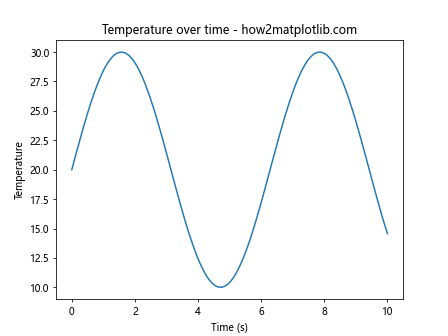
这个例子展示了如何将update_units()与自定义的温度单位结合使用,同时保留了x轴的默认时间单位。
5. 处理不同类型的数据
update_units()函数在处理不同类型的数据时特别有用,例如日期时间、货币或科学单位。
5.1 处理日期时间数据
import matplotlib.pyplot as plt
import numpy as np
import matplotlib.dates as mdates
from datetime import datetime, timedelta

class DateUnit:
    def __init__(self, format_str):
        self.format_str = format_str

    def __str__(self):
        return f"Date ({self.format_str}) - how2matplotlib.com"

dates = [datetime(2023, 1, 1) + timedelta(days=i) for i in range(100)]
values = np.random.randn(100).cumsum()

fig, ax = plt.subplots()
ax.plot(dates, values)

date_unit = DateUnit("%Y-%m-%d")
ax.xaxis.update_units(date_unit)
ax.xaxis.set_major_formatter(mdates.DateFormatter("%Y-%m-%d"))

ax.set_xlabel("Date")
ax.set_ylabel("Value")
plt.title("Time series data - how2matplotlib.com")
plt.xticks(rotation=45)
plt.tight_layout()
plt.show()
Output:
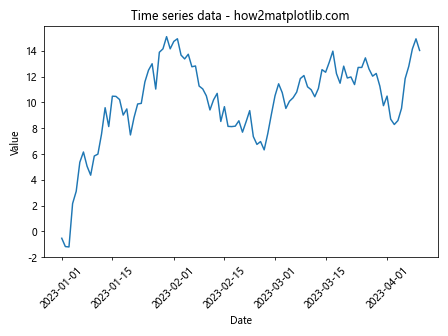
这个例子展示了如何使用update_units()来处理日期时间数据,并结合Matplotlib的日期格式化功能来自定义x轴的显示。
6. 动态更新单位
update_units()函数的一个强大特性是能够在图表绘制后动态更新单位。这在交互式应用程序或需要根据用户输入调整单位的场景中非常有用。
6.1 使用滑块动态更新单位
import matplotlib.pyplot as plt
import numpy as np
from matplotlib.widgets import Slider

class DynamicUnit:
    def __init__(self, base_unit):
        self.base_unit = base_unit
        self.multiplier = 1

    def __str__(self):
        return f"{self.base_unit} (x{self.multiplier}) - how2matplotlib.com"

    def update(self, multiplier):
        self.multiplier = multiplier

x = np.linspace(0, 10, 100)
y = np.sin(x)

fig, ax = plt.subplots()
line, = ax.plot(x, y)

dynamic_unit = DynamicUnit("meters")
ax.xaxis.update_units(dynamic_unit)
ax.yaxis.update_units(dynamic_unit)

ax_slider = plt.axes([0.2, 0.02, 0.6, 0.03])
slider = Slider(ax_slider, 'Unit Multiplier', 1, 10, valinit=1)

def update(val):
    multiplier = slider.val
    dynamic_unit.update(multiplier)
    ax.xaxis.update_units(dynamic_unit)
    ax.yaxis.update_units(dynamic_unit)
    fig.canvas.draw_idle()

slider.on_changed(update)

plt.title("Dynamic units with slider - how2matplotlib.com")
plt.show()
Output:
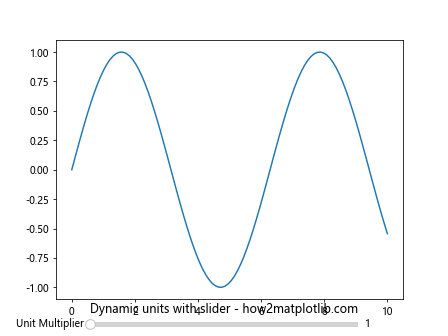
这个高级示例展示了如何使用滑块来动态更新单位。用户可以通过移动滑块来改变单位的乘数,图表会实时更新以反映新的单位设置。
7. 在多子图中使用update_units()
当处理包含多个子图的复杂图表时,update_units()函数可以用来确保所有子图使用一致的单位系统。
7.1 多子图单位更新
import matplotlib.pyplot as plt
import numpy as np

class MultiUnit:
    def __init__(self, unit_name):
        self.unit_name = unit_name

    def __str__(self):
        return f"{self.unit_name} - how2matplotlib.com"

x = np.linspace(0, 10, 100)
y1 = np.sin(x)
y2 = np.cos(x)

fig, (ax1, ax2) = plt.subplots(2, 1, sharex=True)

ax1.plot(x, y1)
ax2.plot(x, y2)

multi_unit = MultiUnit("radians")
for ax in [ax1, ax2]:
    ax.xaxis.update_units(multi_unit)
    ax.yaxis.update_units(multi_unit)

ax1.set_title("Sine function - how2matplotlib.com")
ax2.set_title("Cosine function - how2matplotlib.com")
ax2.set_xlabel("X axis")
ax1.set_ylabel("Y axis")
ax2.set_ylabel("Y axis")

plt.tight_layout()
plt.show()
Output:
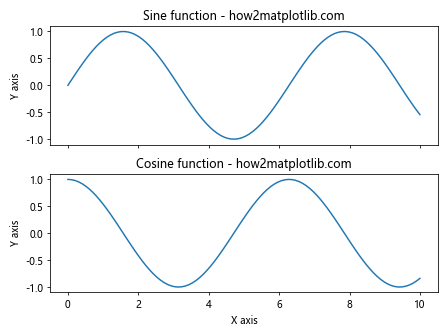
这个例子展示了如何在包含多个子图的图表中统一使用update_units()函数,确保所有子图使用相同的单位系统。
8. 处理科学计数法和大数据
在处理非常大或非常小的数值时,update_units()函数可以与科学计数法结合使用,以提高图表的可读性。
8.1 科学计数法单位
import matplotlib.pyplot as plt
import numpy as np

class ScientificUnit:
    def __init__(self, base_unit):
        self.base_unit = base_unit

    def __str__(self):
        return f"{self.base_unit} (scientific notation) - how2matplotlib.com"

x = np.linspace(1e-9, 1e-6, 100)
y = x**2

fig, ax = plt.subplots()
ax.plot(x, y)

scientific_unit = ScientificUnit("meters")
ax.xaxis.update_units(scientific_unit)
ax.yaxis.update_units(scientific_unit)

ax.set_xlabel("X axis")
ax.set_ylabel("Y axis")
plt.title("Scientific notation example - how2matplotlib.com")

ax.ticklabel_format(style='sci', scilimits=(0,0), axis='both')

plt.show()
Output:
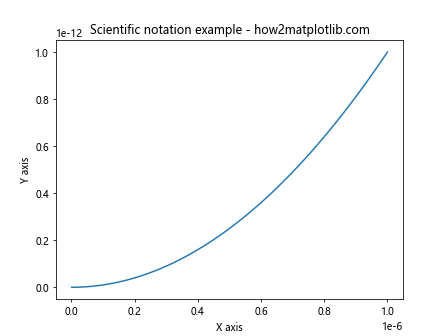
这个例子展示了如何使用update_units()函数结合科学计数法来处理非常小的数值,使图表更易读和理解。
9. 自定义单位转换
update_units()函数还可以与自定义的单位转换逻辑结合使用,允许在不同单位系统之间进行灵活转换。
9.1 温度单位转换
import matplotlib.pyplot as plt
import numpy as np

class TemperatureConverter:
    def __init__(self, from_unit, to_unit):
        self.from_unit = from_unit
        self.to_unit = to_unit

    def __call__(self, x):
        if self.from_unit == 'C' and self.to_unit == 'F':
            return (x * 9/5) + 32
        elif self.from_unit == 'F' and self.to_unit == 'C':
            return (x - 32) * 5/9
        else:
            return x

    def __str__(self):
        return f"{self.from_unit} to {self.to_unit} - how2matplotlib.com"

x = np.linspace(0, 100, 100)
y = x  # Assuming this is temperature in Celsius

fig, ax = plt.subplots()
ax.plot(x, y)

converter = TemperatureConverter('C', 'F')
ax.yaxis.update_units(converter)
ax.yaxis.set_major_formatter(plt.FuncFormatter(lambda x, p: f"{converter(x):.1f}°F"))

ax.set_xlabel("Time (minutes)")
ax.set_ylabel("Temperature")
plt.title("Temperature conversion example - how2matplotlib.com")
plt.show()
Output:
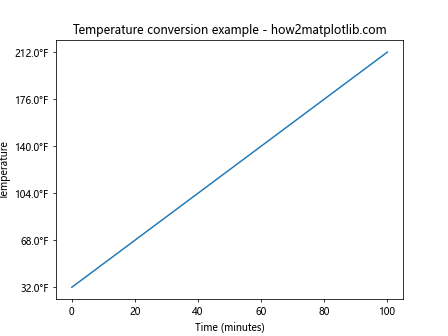
这个高级示例展示了如何创建一个自定义的温度转换器,并使用update_units()函数将其应用到y轴上,实现从摄氏度到华氏度的动态转换。
10. 在动画中使用update_units()
update_units()函数也可以在动画中使用,以创建单位随时间变化的动态图表。
10.1 动画单位更新
import matplotlib.pyplot as plt
import numpy as np
from matplotlib.animation import FuncAnimation

class AnimatedUnit:
    def __init__(self, base_unit):
        self.base_unit = base_unit
        self.frame = 0

    def __str__(self):
        return f"{self.base_unit} (Frame {self.frame}) - how2matplotlib.com"

    def update(self, frame):
        self.frame = frame

fig, ax = plt.subplots()
x = np.linspace(0, 2*np.pi, 100)
line, = ax.plot(x, np.sin(x))

animated_unit = AnimatedUnit("radians")
ax.xaxis.update_units(animated_unit)
ax.yaxis.update_units(animated_unit)

def update(frame):
    animated_unit.update(frame)
    ax.xaxis.update_units(animated_unit)
    ax.yaxis.update_units(animated_unit)
    line.set_ydata(np.sin(x + frame/10))
    return line,

ani = FuncAnimation(fig, update, frames=100, interval=50, blit=True)

plt.title("Animated units example - how2matplotlib.com")
plt.show()
Output:
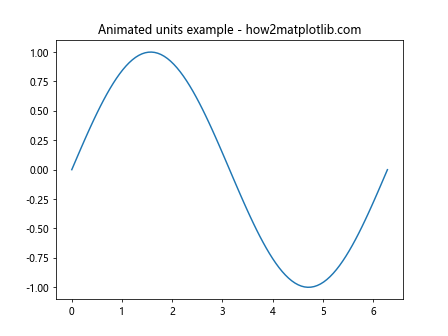
这个复杂的例子展示了如何在动画中使用update_units()函数。随着动画的进行,单位信息会动态更新,创造出一个随时间变化的单位系统。
结论
通过本文的详细介绍和多样化的示例,我们深入探讨了Matplotlib中axis.Axis.update_units()函数的用法和应用场景。这个函数为图表的单位管理提供了强大而灵活的工具,使得数据可视化更加精确和易于理解。
从基本的单位更新到复杂的动态单位转换,update_units()函数展现了其在各种场景下的适用性。无论是处理简单的数值数据,还是复杂的时间序列或科学计量单位,这个函数都能够有效地满足需求。
以下是使用update_units()函数时的一些关键点和最佳实践:
- 自定义单位:创建自定义单位类可以极大地增强图表的可读性和专业性。
-
动态更新:结合交互式元素(如滑块)使用
update_units()可以创建响应用户输入的动态图表。 -
多子图一致性:在处理多个子图时,确保使用一致的单位系统可以提高整体图表的连贯性。
-
科学计数法:对于非常大或非常小的数值,结合科学计数法使用可以提高数据的可读性。
-
单位转换:实现自定义的单位转换逻辑可以在不同计量系统之间灵活切换。
-
动画整合:在动画中使用
update_units()可以创建单位随时间变化的动态效果。
通过掌握update_units()函数,开发者和数据分析师可以创建更加专业、精确和易于理解的数据可视化图表。这不仅能够提高数据展示的质量,还能确保信息传递的准确性和有效性。
在实际应用中,建议根据具体的数据特性和展示需求,灵活运用update_units()函数。同时,也要注意与Matplotlib的其他功能相结合,如格式化器、定位器等,以达到最佳的可视化效果。
最后,随着数据可视化领域的不断发展,Matplotlib也在持续更新和改进其功能。建议读者关注Matplotlib的官方文档和社区讨论,以了解update_units()函数的最新用法和潜在的新特性。通过不断学习和实践,我们可以充分发挥这个强大工具的潜力,创造出更加出色的数据可视化作品。
11. 高级应用:结合自定义Formatter
update_units()函数可以与自定义的Formatter结合使用,以实现更复杂的单位显示逻辑。
11.1 自定义单位格式化
import matplotlib.pyplot as plt
import numpy as np
from matplotlib.ticker import FuncFormatter

class ComplexUnit:
    def __init__(self, base_unit, prefix):
        self.base_unit = base_unit
        self.prefix = prefix

    def __str__(self):
        return f"{self.prefix}{self.base_unit} - how2matplotlib.com"

def complex_formatter(x, pos):
    if x < 1e-6:
        return f"{x*1e9:.1f} n{complex_unit.base_unit}"
    elif x < 1e-3:
        return f"{x*1e6:.1f} µ{complex_unit.base_unit}"
    elif x < 1:
        return f"{x*1e3:.1f} m{complex_unit.base_unit}"
    else:
        return f"{x:.1f} {complex_unit.base_unit}"

x = np.logspace(-9, 0, 100)
y = x**2

fig, ax = plt.subplots()
ax.plot(x, y)

complex_unit = ComplexUnit("meters", "")
ax.xaxis.update_units(complex_unit)
ax.yaxis.update_units(complex_unit)

ax.set_xscale('log')
ax.set_yscale('log')

ax.xaxis.set_major_formatter(FuncFormatter(complex_formatter))
ax.yaxis.set_major_formatter(FuncFormatter(complex_formatter))

ax.set_xlabel("Distance")
ax.set_ylabel("Area")
plt.title("Complex unit formatting - how2matplotlib.com")
plt.tight_layout()
plt.show()
Output:
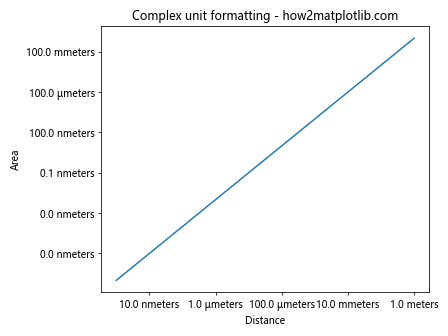
这个高级示例展示了如何创建一个复杂的单位系统,并使用自定义的Formatter来动态调整单位前缀(如纳米、微米、毫米等)。这种方法特别适用于需要在不同数量级之间切换的科学或工程数据可视化。
12. 国际化和本地化
在处理国际化和本地化的图表时,update_units()函数也能发挥重要作用。
12.1 多语言单位支持
import matplotlib.pyplot as plt
import numpy as np

class LocalizedUnit:
    def __init__(self, unit_dict):
        self.unit_dict = unit_dict
        self.current_lang = 'en'

    def __str__(self):
        return f"{self.unit_dict[self.current_lang]} - how2matplotlib.com"

    def set_language(self, lang):
        if lang in self.unit_dict:
            self.current_lang = lang

x = np.linspace(0, 10, 100)
y = np.sin(x)

fig, (ax1, ax2) = plt.subplots(1, 2, figsize=(12, 5))

unit_dict = {
    'en': 'meters',
    'fr': 'mètres',
    'de': 'Meter',
    'es': 'metros'
}

localized_unit = LocalizedUnit(unit_dict)

# English plot
ax1.plot(x, y)
localized_unit.set_language('en')
ax1.xaxis.update_units(localized_unit)
ax1.yaxis.update_units(localized_unit)
ax1.set_title("English Units - how2matplotlib.com")
ax1.set_xlabel("Distance")
ax1.set_ylabel("Height")

# French plot
ax2.plot(x, y)
localized_unit.set_language('fr')
ax2.xaxis.update_units(localized_unit)
ax2.yaxis.update_units(localized_unit)
ax2.set_title("Unités françaises - how2matplotlib.com")
ax2.set_xlabel("Distance")
ax2.set_ylabel("Hauteur")

plt.tight_layout()
plt.show()
Output:
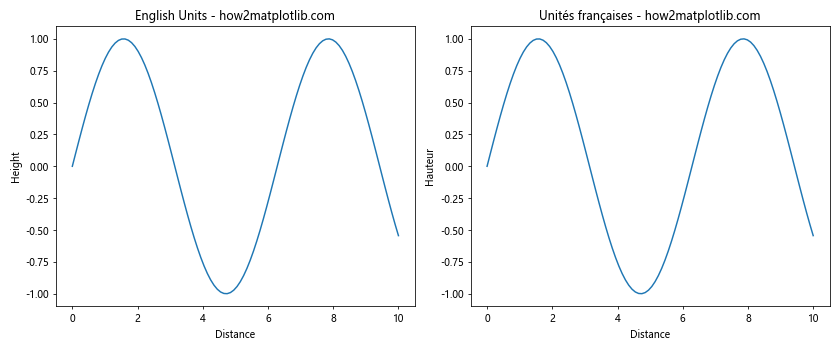
这个示例展示了如何使用update_units()函数来支持多语言单位显示。通过切换语言设置,可以轻松地为不同地区的用户提供本地化的图表。
13. 与其他Matplotlib功能的集成
update_units()函数可以与Matplotlib的其他高级功能无缝集成,以创建更复杂和信息丰富的可视化。
13.1 结合颜色映射和单位更新
import matplotlib.pyplot as plt
import numpy as np

class ColorMappedUnit:
    def __init__(self, base_unit):
        self.base_unit = base_unit

    def __str__(self):
        return f"{self.base_unit} (color mapped) - how2matplotlib.com"

x = np.linspace(0, 10, 20)
y = np.linspace(0, 10, 20)
X, Y = np.meshgrid(x, y)
Z = np.sin(X) * np.cos(Y)

fig, ax = plt.subplots()
c = ax.pcolormesh(X, Y, Z, cmap='viridis')
fig.colorbar(c, ax=ax)

color_mapped_unit = ColorMappedUnit("intensity")
ax.xaxis.update_units(ColorMappedUnit("meters"))
ax.yaxis.update_units(ColorMappedUnit("meters"))
c.colorbar.ax.yaxis.update_units(color_mapped_unit)

ax.set_xlabel("X distance")
ax.set_ylabel("Y distance")
c.colorbar.set_label("Intensity")
plt.title("Color mapped units - how2matplotlib.com")
plt.show()
Output:
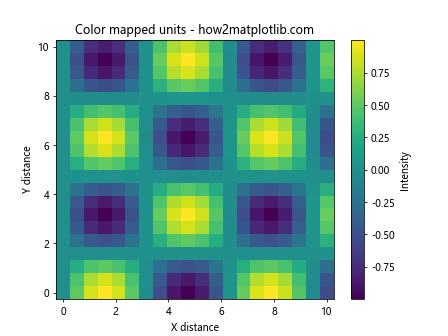
这个示例展示了如何将update_units()函数与颜色映射结合使用。我们不仅更新了x轴和y轴的单位,还为颜色条添加了自定义单位,从而创建了一个更加完整和专业的热图。
14. 处理时间序列数据
在处理时间序列数据时,update_units()函数可以帮助我们更好地表示和格式化时间单位。
14.1 自定义时间单位
import matplotlib.pyplot as plt
import numpy as np
from datetime import datetime, timedelta
import matplotlib.dates as mdates

class TimeUnit:
    def __init__(self, format_str):
        self.format_str = format_str

    def __str__(self):
        return f"Time ({self.format_str}) - how2matplotlib.com"

start_date = datetime(2023, 1, 1)
dates = [start_date + timedelta(days=i) for i in range(365)]
values = np.cumsum(np.random.randn(365))

fig, ax = plt.subplots(figsize=(12, 6))
ax.plot(dates, values)

time_unit = TimeUnit("%Y-%m-%d")
ax.xaxis.update_units(time_unit)

ax.xaxis.set_major_locator(mdates.MonthLocator())
ax.xaxis.set_major_formatter(mdates.DateFormatter("%b"))
ax.xaxis.set_minor_locator(mdates.DayLocator())

ax.set_xlabel("Date")
ax.set_ylabel("Cumulative Value")
plt.title("Time series with custom time units - how2matplotlib.com")
plt.xticks(rotation=45)
plt.tight_layout()
plt.show()
Output:
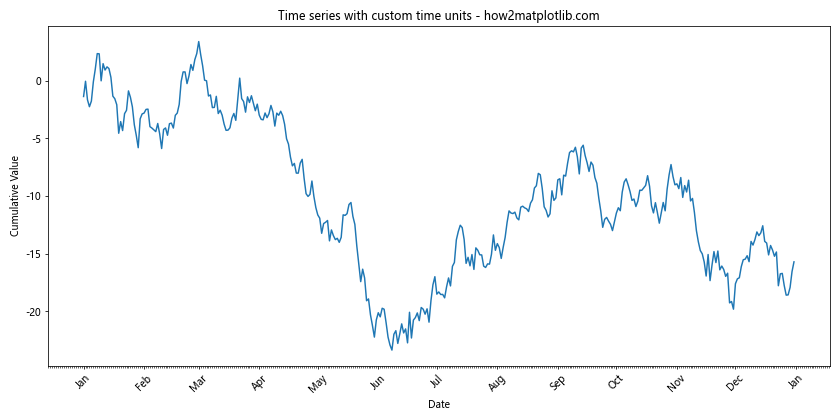
这个示例展示了如何使用update_units()函数来处理时间序列数据。我们创建了一个自定义的TimeUnit类,并结合Matplotlib的日期定位器和格式化器来优化时间轴的显示。
15. 单位系统的动态切换
在某些情况下,我们可能需要在图表中动态切换不同的单位系统。update_units()函数可以帮助我们实现这一功能。
15.1 单位系统切换器
import matplotlib.pyplot as plt
import numpy as np
from matplotlib.widgets import RadioButtons

class SwitchableUnit:
    def __init__(self, unit_systems):
        self.unit_systems = unit_systems
        self.current_system = list(unit_systems.keys())[0]

    def __str__(self):
        return f"{self.unit_systems[self.current_system]} - how2matplotlib.com"

    def switch(self, system):
        if system in self.unit_systems:
            self.current_system = system

x = np.linspace(0, 10, 100)
y = x**2

fig, ax = plt.subplots()
line, = ax.plot(x, y)

unit_systems = {
    'metric': 'meters',
    'imperial': 'feet'
}

switchable_unit = SwitchableUnit(unit_systems)
ax.xaxis.update_units(switchable_unit)
ax.yaxis.update_units(switchable_unit)

ax.set_xlabel("Distance")
ax.set_ylabel("Area")

rax = plt.axes([0.05, 0.7, 0.15, 0.15])
radio = RadioButtons(rax, ('metric', 'imperial'))

def unit_switch(label):
    switchable_unit.switch(label)
    ax.xaxis.update_units(switchable_unit)
    ax.yaxis.update_units(switchable_unit)
    if label == 'imperial':
        line.set_xdata(x * 3.28084)  # Convert to feet
        line.set_ydata(y * 10.7639)  # Convert to square feet
    else:
        line.set_xdata(x)
        line.set_ydata(y)
    ax.relim()
    ax.autoscale_view()
    fig.canvas.draw_idle()

radio.on_clicked(unit_switch)

plt.title("Switchable unit system - how2matplotlib.com")
plt.show()
Output:
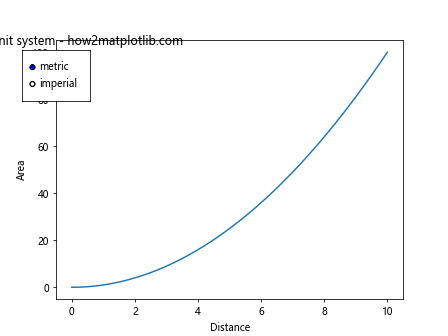
这个高级示例展示了如何创建一个可以动态切换单位系统的图表。用户可以通过单选按钮在公制和英制单位之间切换,图表会相应地更新数据和单位显示。
通过这些丰富的示例和详细的解释,我们全面探讨了axis.Axis.update_units()函数的各种用法和应用场景。从基本的单位更新到复杂的动态单位系统,这个函数展现了其在数据可视化中的强大功能和灵活性。掌握这些技巧将使您能够创建更加专业、精确和易于理解的图表,从而更好地传达数据中的洞察和信息。
 极客笔记
极客笔记