Matplotlib中的axis.Axis.limit_range_for_scale()函数详解与应用
参考:Matplotlib.axis.Axis.limit_range_for_scale() function in Python
Matplotlib是Python中最流行的数据可视化库之一,它提供了丰富的绘图功能和自定义选项。在Matplotlib中,axis.Axis.limit_range_for_scale()函数是一个重要的方法,用于根据当前的坐标轴比例调整数据范围。本文将深入探讨这个函数的用法、参数和应用场景,并提供多个示例代码来帮助读者更好地理解和使用这个功能。
1. limit_range_for_scale()函数简介
limit_range_for_scale()函数是Matplotlib库中axis.Axis类的一个方法。它的主要作用是根据当前坐标轴的比例(scale)来调整给定的数据范围。这个函数在处理对数刻度、对称对数刻度等非线性刻度时特别有用,因为它可以确保数据范围在当前比例下是有效的。
函数签名如下:
Axis.limit_range_for_scale(vmin, vmax)
其中,vmin和vmax分别表示要调整的数据范围的最小值和最大值。
2. 函数参数详解
vmin(float):要调整的数据范围的最小值。vmax(float):要调整的数据范围的最大值。
函数返回一个元组(min, max),表示调整后的数据范围。
3. 使用场景
limit_range_for_scale()函数在以下场景中特别有用:
- 对数刻度(Logarithmic scale)
- 对称对数刻度(Symlog scale)
- 自定义非线性刻度
- 数据范围包含零或负值时的刻度调整
接下来,我们将通过具体的示例来展示这个函数的应用。
4. 在对数刻度中的应用
对数刻度常用于表示跨越多个数量级的数据。在使用对数刻度时,limit_range_for_scale()函数可以帮助我们调整数据范围,确保它们在对数刻度下是有效的。
示例代码:
import matplotlib.pyplot as plt
import numpy as np

# 创建数据
x = np.linspace(0.1, 100, 100)
y = np.exp(x)

# 创建图形和坐标轴
fig, ax = plt.subplots(figsize=(10, 6))

# 设置y轴为对数刻度
ax.set_yscale('log')

# 绘制数据
ax.plot(x, y, label='Exponential Growth')

# 获取当前的y轴范围
ymin, ymax = ax.get_ylim()

# 使用limit_range_for_scale()调整范围
adjusted_ymin, adjusted_ymax = ax.yaxis.limit_range_for_scale(ymin, ymax)

# 设置调整后的范围
ax.set_ylim(adjusted_ymin, adjusted_ymax)

# 添加标签和标题
ax.set_xlabel('X-axis')
ax.set_ylabel('Y-axis (log scale)')
ax.set_title('Exponential Growth with Adjusted Log Scale - how2matplotlib.com')
ax.legend()

plt.show()
Output:

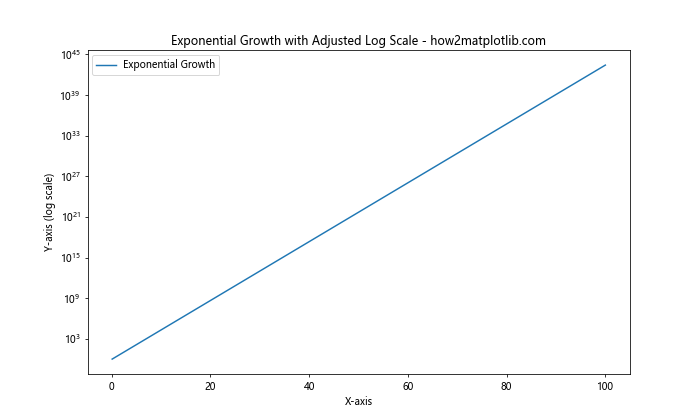
在这个示例中,我们首先创建了一个指数增长的数据集。然后,我们将y轴设置为对数刻度,并使用limit_range_for_scale()函数来调整y轴的范围。这确保了在对数刻度下,所有的数据点都能被正确显示。
5. 在对称对数刻度中的应用
对称对数刻度(Symlog scale)是一种特殊的刻度,它在零附近使用线性刻度,而在远离零的地方使用对数刻度。这种刻度对于同时包含正值和负值的数据特别有用。
示例代码:
import matplotlib.pyplot as plt
import numpy as np

# 创建数据
x = np.linspace(-100, 100, 1000)
y = x**3 - x

# 创建图形和坐标轴
fig, ax = plt.subplots(figsize=(10, 6))

# 设置y轴为对称对数刻度
ax.set_yscale('symlog', linthresh=10)

# 绘制数据
ax.plot(x, y, label='Cubic Function')

# 获取当前的y轴范围
ymin, ymax = ax.get_ylim()

# 使用limit_range_for_scale()调整范围
adjusted_ymin, adjusted_ymax = ax.yaxis.limit_range_for_scale(ymin, ymax)

# 设置调整后的范围
ax.set_ylim(adjusted_ymin, adjusted_ymax)

# 添加标签和标题
ax.set_xlabel('X-axis')
ax.set_ylabel('Y-axis (symlog scale)')
ax.set_title('Cubic Function with Adjusted Symlog Scale - how2matplotlib.com')
ax.legend()

plt.show()
Output:

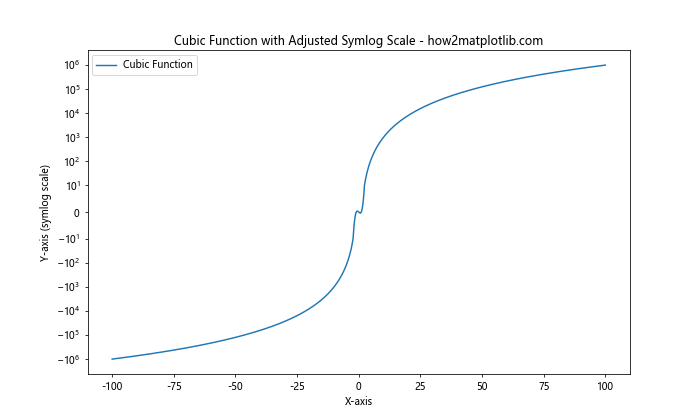
在这个例子中,我们绘制了一个立方函数,它包含正值和负值。我们使用对称对数刻度来显示y轴,并使用limit_range_for_scale()函数来调整y轴的范围。这确保了在对称对数刻度下,所有的数据点都能被正确显示,包括零附近的线性部分和远离零的对数部分。
6. 在自定义非线性刻度中的应用
Matplotlib允许用户创建自定义的非线性刻度。在这种情况下,limit_range_for_scale()函数可以帮助确保数据范围在自定义刻度下是有效的。
示例代码:
import matplotlib.pyplot as plt
import matplotlib.scale as mscale
import matplotlib.transforms as mtransforms
import numpy as np

class SquareRootScale(mscale.ScaleBase):
    name = 'squareroot'

    def __init__(self, axis, **kwargs):
        mscale.ScaleBase.__init__(self)

    def get_transform(self):
        return self.SquareRootTransform()

    def set_default_locators_and_formatters(self, axis):
        axis.set_major_locator(plt.AutoLocator())
        axis.set_major_formatter(plt.ScalarFormatter())

    class SquareRootTransform(mtransforms.Transform):
        input_dims = 1
        output_dims = 1
        is_separable = True

        def transform_non_affine(self, a):
            return np.sqrt(a)

        def inverted(self):
            return SquareRootScale.InvertedSquareRootTransform()

    class InvertedSquareRootTransform(mtransforms.Transform):
        input_dims = 1
        output_dims = 1
        is_separable = True

        def transform_non_affine(self, a):
            return a ** 2

        def inverted(self):
            return SquareRootScale.SquareRootTransform()

# 注册自定义刻度
mscale.register_scale(SquareRootScale)

# 创建数据
x = np.linspace(0, 100, 1000)
y = x**2

# 创建图形和坐标轴
fig, ax = plt.subplots(figsize=(10, 6))

# 设置y轴为自定义的平方根刻度
ax.set_yscale('squareroot')

# 绘制数据
ax.plot(x, y, label='Quadratic Function')

# 获取当前的y轴范围
ymin, ymax = ax.get_ylim()

# 使用limit_range_for_scale()调整范围
adjusted_ymin, adjusted_ymax = ax.yaxis.limit_range_for_scale(ymin, ymax)

# 设置调整后的范围
ax.set_ylim(adjusted_ymin, adjusted_ymax)

# 添加标签和标题
ax.set_xlabel('X-axis')
ax.set_ylabel('Y-axis (square root scale)')
ax.set_title('Quadratic Function with Adjusted Square Root Scale - how2matplotlib.com')
ax.legend()

plt.show()
在这个示例中,我们创建了一个自定义的平方根刻度。然后,我们使用这个刻度来显示一个二次函数。limit_range_for_scale()函数被用来调整y轴的范围,确保在这个自定义刻度下所有的数据点都能被正确显示。
7. 处理包含零或负值的数据范围
当数据范围包含零或负值时,某些刻度(如对数刻度)可能会出现问题。limit_range_for_scale()函数可以帮助我们处理这种情况。
示例代码:
import matplotlib.pyplot as plt
import numpy as np

# 创建包含零和负值的数据
x = np.linspace(-10, 10, 100)
y = x**3

# 创建图形和坐标轴
fig, (ax1, ax2) = plt.subplots(1, 2, figsize=(15, 6))

# 在第一个子图中使用线性刻度
ax1.plot(x, y, label='Cubic Function')
ax1.set_xlabel('X-axis')
ax1.set_ylabel('Y-axis (linear scale)')
ax1.set_title('Cubic Function with Linear Scale - how2matplotlib.com')
ax1.legend()

# 在第二个子图中使用对数刻度
ax2.set_yscale('log')
ax2.plot(x, np.abs(y), label='Absolute Cubic Function')

# 获取当前的y轴范围
ymin, ymax = ax2.get_ylim()

# 使用limit_range_for_scale()调整范围
adjusted_ymin, adjusted_ymax = ax2.yaxis.limit_range_for_scale(ymin, ymax)

# 设置调整后的范围
ax2.set_ylim(adjusted_ymin, adjusted_ymax)

ax2.set_xlabel('X-axis')
ax2.set_ylabel('Y-axis (log scale)')
ax2.set_title('Absolute Cubic Function with Adjusted Log Scale - how2matplotlib.com')
ax2.legend()

plt.tight_layout()
plt.show()
Output:

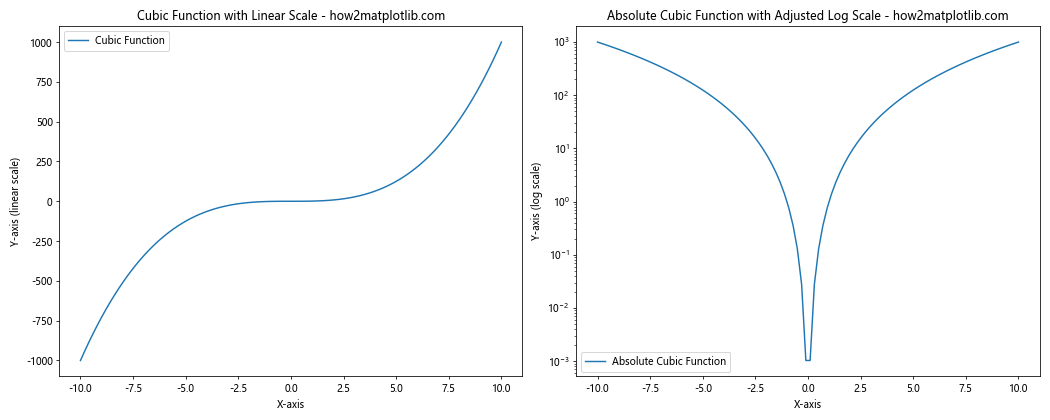
在这个例子中,我们创建了一个包含零和负值的立方函数数据。在第一个子图中,我们使用线性刻度显示原始数据。在第二个子图中,我们取数据的绝对值并使用对数刻度。limit_range_for_scale()函数被用来调整第二个子图的y轴范围,确保在对数刻度下所有的数据点都能被正确显示。
8. 在极坐标图中的应用
limit_range_for_scale()函数也可以在极坐标图中使用,以调整径向轴的范围。
示例代码:
import matplotlib.pyplot as plt
import numpy as np

# 创建数据
theta = np.linspace(0, 2*np.pi, 100)
r = np.linspace(0.1, 10, 100)

# 创建图形和极坐标轴
fig, ax = plt.subplots(figsize=(10, 10), subplot_kw=dict(projection='polar'))

# 设置径向轴为对数刻度
ax.set_rscale('log')

# 绘制数据
ax.plot(theta, r, label='Spiral')

# 获取当前的径向轴范围
rmin, rmax = ax.get_ylim()

# 使用limit_range_for_scale()调整范围
adjusted_rmin, adjusted_rmax = ax.yaxis.limit_range_for_scale(rmin, rmax)

# 设置调整后的范围
ax.set_ylim(adjusted_rmin, adjusted_rmax)

# 添加标题和图例
ax.set_title('Spiral in Polar Coordinates with Adjusted Log Scale - how2matplotlib.com')
ax.legend()

plt.show()
Output:

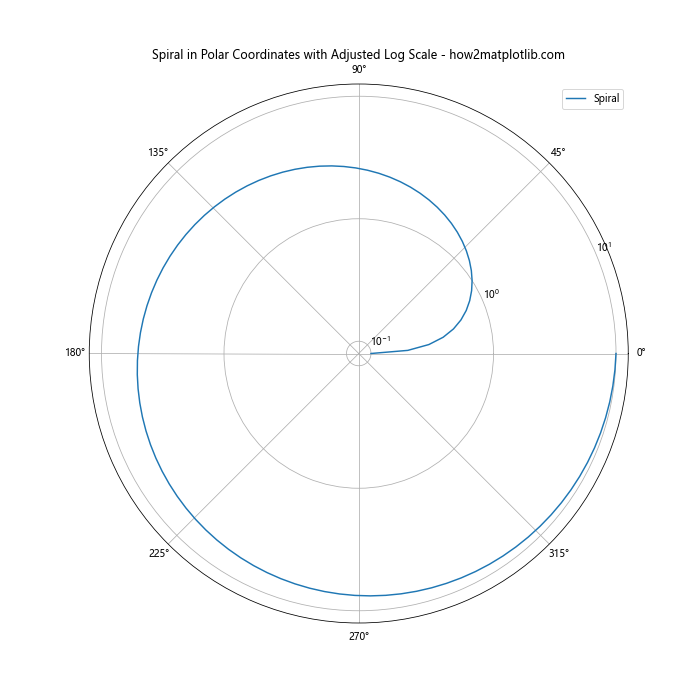
在这个示例中,我们创建了一个极坐标图,并将径向轴设置为对数刻度。limit_range_for_scale()函数被用来调整径向轴的范围,确保在对数刻度下所有的数据点都能被正确显示。
9. 在3D图中的应用
limit_range_for_scale()函数也可以在3D图中使用,以调整z轴的范围。
示例代码:
import matplotlib.pyplot as plt
import numpy as np
from mpl_toolkits.mplot3d import Axes3D

# 创建数据
x = np.linspace(0.1, 10, 50)
y = np.linspace(0.1, 10, 50)
X, Y = np.meshgrid(x, y)
Z = np.exp(X + Y)

# 创建图形和3D坐标轴
fig = plt.figure(figsize=(12, 8))
ax = fig.add_subplot(111, projection='3d')

# 设置z轴为对数刻度
ax.zaxis.set_scale('log')

# 绘制3D表面
surf = ax.plot_surface(X, Y, Z, cmap='viridis')

# 获取当前的z轴范围
zmin, zmax = ax.get_zlim()

# 使用limit_range_for_scale()调整范围
adjusted_zmin, adjusted_zmax = ax.zaxis.limit_range_for_scale(zmin, zmax)

# 设置调整后的范围
ax.set_zlim(adjusted_zmin, adjusted_zmax)

# 添加标签和标题
ax.set_xlabel('X-axis')
ax.set_ylabel('Y-axis')
ax.set_zlabel('Z-axis (log scale)')
ax.set_title('3D Surface with Adjusted Log Scale - how2matplotlib.com')

# 添加颜色条
fig.colorbar(surf, shrink=0.5, aspect=5)

plt.show```

在这个3D图示例中,我们创建了一个指数函数的3D表面图。z轴被设置为对数刻度,并使用`limit_range_for_scale()`函数来调整z轴的范围。这确保了在对数刻度下,3D表面的所有部分都能被正确显示。

## 10. 在多子图中的应用

`limit_range_for_scale()`函数可以在包含多个子图的图形中使用,以确保每个子图的刻度范围都得到适当的调整。

示例代码:

```python
import matplotlib.pyplot as plt
import numpy as np

# 创建数据
x = np.linspace(0.1, 10, 100)
y1 = np.exp(x)
y2 = x**2
y3 = np.log(x)
y4 = np.sqrt(x)

# 创建2x2的子图
fig, ((ax1, ax2), (ax3, ax4)) = plt.subplots(2, 2, figsize=(15, 15))

# 子图1:对数刻度
ax1.set_yscale('log')
ax1.plot(x, y1, label='Exponential')
ymin1, ymax1 = ax1.get_ylim()
adjusted_ymin1, adjusted_ymax1 = ax1.yaxis.limit_range_for_scale(ymin1, ymax1)
ax1.set_ylim(adjusted_ymin1, adjusted_ymax1)
ax1.set_title('Exponential (Log Scale) - how2matplotlib.com')
ax1.legend()

# 子图2:线性刻度
ax2.plot(x, y2, label='Quadratic')
ax2.set_title('Quadratic (Linear Scale) - how2matplotlib.com')
ax2.legend()

# 子图3:对称对数刻度
ax3.set_yscale('symlog', linthresh=0.1)
ax3.plot(x, y3, label='Logarithmic')
ymin3, ymax3 = ax3.get_ylim()
adjusted_ymin3, adjusted_ymax3 = ax3.yaxis.limit_range_for_scale(ymin3, ymax3)
ax3.set_ylim(adjusted_ymin3, adjusted_ymax3)
ax3.set_title('Logarithmic (Symlog Scale) - how2matplotlib.com')
ax3.legend()

# 子图4:平方根刻度
ax4.set_yscale('sqrt')
ax4.plot(x, y4, label='Square Root')
ymin4, ymax4 = ax4.get_ylim()
adjusted_ymin4, adjusted_ymax4 = ax4.yaxis.limit_range_for_scale(ymin4, ymax4)
ax4.set_ylim(adjusted_ymin4, adjusted_ymax4)
ax4.set_title('Square Root (Sqrt Scale) - how2matplotlib.com')
ax4.legend()

plt.tight_layout()
plt.show()
在这个示例中,我们创建了一个2×2的子图网格,每个子图使用不同的刻度类型。我们对每个子图都应用了limit_range_for_scale()函数来调整y轴的范围,确保在各种不同的刻度下,所有的数据点都能被正确显示。
11. 在动画中的应用
limit_range_for_scale()函数也可以在创建动画时使用,以确保在数据变化过程中刻度范围始终保持适当。
示例代码:
import matplotlib.pyplot as plt
import numpy as np
from matplotlib.animation import FuncAnimation

# 创建初始数据
x = np.linspace(0.1, 10, 100)
y = np.exp(x)

# 创建图形和坐标轴
fig, ax = plt.subplots(figsize=(10, 6))
ax.set_yscale('log')
line, = ax.plot(x, y)

ax.set_xlabel('X-axis')
ax.set_ylabel('Y-axis (log scale)')
ax.set_title('Animated Exponential Growth - how2matplotlib.com')

# 定义动画更新函数
def update(frame):
    y = np.exp(x + frame * 0.1)
    line.set_ydata(y)

    ymin, ymax = ax.get_ylim()
    adjusted_ymin, adjusted_ymax = ax.yaxis.limit_range_for_scale(y.min(), y.max())
    ax.set_ylim(adjusted_ymin, adjusted_ymax)

    return line,

# 创建动画
anim = FuncAnimation(fig, update, frames=100, interval=50, blit=True)

plt.show()
在这个动画示例中,我们创建了一个随时间变化的指数函数图。在每一帧更新时,我们都使用limit_range_for_scale()函数来调整y轴的范围,确保在对数刻度下,所有的数据点都能被正确显示,即使数据范围在不断变化。
12. 在误差条图中的应用
limit_range_for_scale()函数在绘制带有误差条的图表时也很有用,特别是当使用对数刻度时。
示例代码:
import matplotlib.pyplot as plt
import numpy as np

# 创建数据
x = np.linspace(1, 10, 10)
y = np.exp(x)
yerr = y * 0.1  # 10%的误差

# 创建图形和坐标轴
fig, ax = plt.subplots(figsize=(10, 6))
ax.set_yscale('log')

# 绘制误差条
ax.errorbar(x, y, yerr=yerr, fmt='o', capsize=5, label='Data with Error')

# 获取当前的y轴范围
ymin, ymax = ax.get_ylim()

# 使用limit_range_for_scale()调整范围
adjusted_ymin, adjusted_ymax = ax.yaxis.limit_range_for_scale(y.min() - yerr.min(), y.max() + yerr.max())

# 设置调整后的范围
ax.set_ylim(adjusted_ymin, adjusted_ymax)

# 添加标签和标题
ax.set_xlabel('X-axis')
ax.set_ylabel('Y-axis (log scale)')
ax.set_title('Error Bar Plot with Adjusted Log Scale - how2matplotlib.com')
ax.legend()

plt.show()
在这个示例中,我们创建了一个带有误差条的指数函数图。我们使用limit_range_for_scale()函数来调整y轴的范围,确保在对数刻度下,所有的数据点和误差条都能被完整地显示。
13. 在箱线图中的应用
limit_range_for_scale()函数在创建箱线图时也很有用,特别是当数据分布跨越多个数量级时。
示例代码:
import matplotlib.pyplot as plt
import numpy as np

# 创建数据
data = [np.random.lognormal(0, s, 1000) for s in [0.5, 1, 1.5]]

# 创建图形和坐标轴
fig, ax = plt.subplots(figsize=(10, 6))
ax.set_yscale('log')

# 绘制箱线图
bp = ax.boxplot(data, patch_artist=True)

# 获取当前的y轴范围
ymin, ymax = ax.get_ylim()

# 使用limit_range_for_scale()调整范围
adjusted_ymin, adjusted_ymax = ax.yaxis.limit_range_for_scale(ymin, ymax)

# 设置调整后的范围
ax.set_ylim(adjusted_ymin, adjusted_ymax)

# 添加标签和标题
ax.set_xlabel('Groups')
ax.set_ylabel('Values (log scale)')
ax.set_title('Box Plot with Adjusted Log Scale - how2matplotlib.com')

plt.show()
在这个箱线图示例中,我们创建了三组对数正态分布的数据。我们使用limit_range_for_scale()函数来调整y轴的范围,确保在对数刻度下,所有的箱线图元素(包括异常值)都能被完整地显示。
14. 在热图中的应用
limit_range_for_scale()函数也可以用于调整热图的颜色映射范围,特别是当数据值跨越多个数量级时。
示例代码:
import matplotlib.pyplot as plt
import numpy as np

# 创建数据
data = np.random.lognormal(0, 1, (10, 10))

# 创建图形和坐标轴
fig, ax = plt.subplots(figsize=(10, 8))

# 绘制热图
im = ax.imshow(data, cmap='viridis', norm=plt.LogNorm())

# 获取当前的颜色映射范围
vmin, vmax = im.get_clim()

# 使用limit_range_for_scale()调整范围
adjusted_vmin, adjusted_vmax = ax.yaxis.limit_range_for_scale(vmin, vmax)

# 设置调整后的范围
im.set_clim(adjusted_vmin, adjusted_vmax)

# 添加颜色条和标题
cbar = plt.colorbar(im)
cbar.set_label('Values (log scale)')
ax.set_title('Heatmap with Adjusted Log Scale - how2matplotlib.com')

plt.show()
在这个热图示例中,我们创建了一个对数正态分布的二维数据。我们使用limit_range_for_scale()函数来调整颜色映射的范围,确保在对数刻度下,所有的数据值都能被合适地表示。
15. 结合其他Matplotlib功能
limit_range_for_scale()函数可以与其他Matplotlib功能结合使用,以创建更复杂和信息丰富的可视化。
示例代码:
import matplotlib.pyplot as plt
import numpy as np

# 创建数据
x = np.linspace(0.1, 10, 100)
y1 = np.exp(x)
y2 = x**2

# 创建图形和坐标轴
fig, ax1 = plt.subplots(figsize=(12, 6))

# 设置左侧y轴为对数刻度
ax1.set_yscale('log')
ax1.plot(x, y1, 'b-', label='Exponential')
ax1.set_xlabel('X-axis')
ax1.set_ylabel('Y1 (log scale)', color='b')
ax1.tick_params(axis='y', labelcolor='b')

# 获取当前的y轴范围并调整
ymin1, ymax1 = ax1.get_ylim()
adjusted_ymin1, adjusted_ymax1 = ax1.yaxis.limit_range_for_scale(ymin1, ymax1)
ax1.set_ylim(adjusted_ymin1, adjusted_ymax1)

# 创建右侧y轴
ax2 = ax1.twinx()
ax2.plot(x, y2, 'r-', label='Quadratic')
ax2.set_ylabel('Y2 (linear scale)', color='r')
ax2.tick_params(axis='y', labelcolor='r')

# 添加图例和标题
lines1, labels1 = ax1.get_legend_handles_labels()
lines2, labels2 = ax2.get_legend_handles_labels()
ax1.legend(lines1 + lines2, labels1 + labels2, loc='upper left')

plt.title('Combined Plot with Adjusted Scales - how2matplotlib.com')

plt.show()
在这个综合示例中,我们创建了一个具有两个y轴的图表。左侧y轴使用对数刻度来显示指数函数,右侧y轴使用线性刻度来显示二次函数。我们使用limit_range_for_scale()函数来调整左侧y轴的范围,确保在对数刻度下所有的数据点都能被正确显示。
总结
通过以上详细的介绍和多个示例,我们深入探讨了Matplotlib中axis.Axis.limit_range_for_scale()函数的用法和应用场景。这个函数在处理非线性刻度、调整数据范围以及创建复杂的可视化时非常有用。它能够确保在各种不同的刻度类型下,所有的数据点都能被正确和清晰地显示。
在实际应用中,limit_range_for_scale()函数可以帮助我们解决许多与刻度相关的问题,如处理跨越多个数量级的数据、调整包含零或负值的数据范围、优化3D图表的显示效果等。通过合理使用这个函数,我们可以创建出更加准确、美观和信息丰富的数据可视化图表。
 极客笔记
极客笔记