Matplotlib中使用set_major_formatter()函数自定义坐标轴刻度格式
参考:Matplotlib.axis.Axis.set_major_formatter() function in Python
Matplotlib是Python中最流行的数据可视化库之一,它提供了丰富的绘图功能和自定义选项。在数据可视化过程中,坐标轴的刻度标签格式对于图表的可读性和美观性至关重要。Matplotlib.axis.Axis.set_major_formatter()函数是一个强大的工具,它允许我们自定义坐标轴的主刻度标签格式。本文将详细介绍如何使用set_major_formatter()函数来增强图表的表现力和信息传递效果。
1. set_major_formatter()函数简介
set_major_formatter()函数是Matplotlib库中Axis对象的一个方法,用于设置坐标轴主刻度的格式化器。这个函数允许我们自定义刻度标签的显示方式,例如改变数字的格式、添加单位、使用自定义函数等。通过使用这个函数,我们可以使图表更加清晰、专业,并且更好地传达数据信息。
基本语法如下:
axis.set_major_formatter(formatter)
其中,axis是坐标轴对象(可以是x轴或y轴),formatter是一个Formatter对象或者可调用的函数。
2. 内置格式化器
Matplotlib提供了多种内置的格式化器,可以直接使用。以下是一些常用的内置格式化器:
2.1 ScalarFormatter
ScalarFormatter是默认的格式化器,用于显示普通的数值。
import matplotlib.pyplot as plt
from matplotlib.ticker import ScalarFormatter

fig, ax = plt.subplots()
ax.plot([1, 2, 3, 4], [1, 4, 2, 3], label='how2matplotlib.com')
ax.xaxis.set_major_formatter(ScalarFormatter())
ax.set_title('ScalarFormatter Example')
plt.legend()
plt.show()
Output:
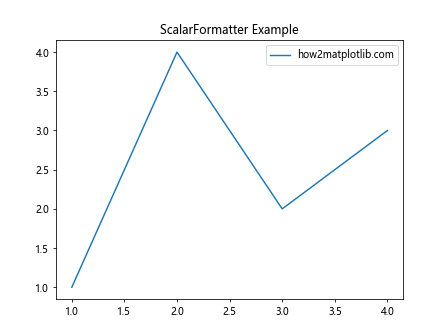
在这个例子中,我们使用ScalarFormatter来格式化x轴的刻度标签。这是默认的格式化器,所以实际上不需要显式设置。
2.2 FormatStrFormatter
FormatStrFormatter允许我们使用字符串格式化语法来自定义刻度标签的格式。
import matplotlib.pyplot as plt
from matplotlib.ticker import FormatStrFormatter

fig, ax = plt.subplots()
ax.plot([0.1, 0.2, 0.3, 0.4], [1, 4, 2, 3], label='how2matplotlib.com')
ax.xaxis.set_major_formatter(FormatStrFormatter('%.2f'))
ax.set_title('FormatStrFormatter Example')
plt.legend()
plt.show()
Output:
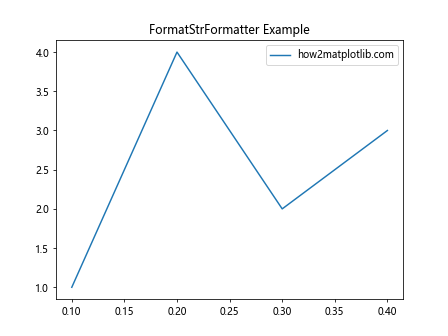
在这个例子中,我们使用FormatStrFormatter来将x轴的刻度标签格式化为两位小数。
2.3 FuncFormatter
FuncFormatter允许我们使用自定义函数来格式化刻度标签。
import matplotlib.pyplot as plt
from matplotlib.ticker import FuncFormatter

def currency_formatter(x, p):
    return f'${x:.2f}'

fig, ax = plt.subplots()
ax.plot([1, 2, 3, 4], [10, 40, 20, 30], label='how2matplotlib.com')
ax.yaxis.set_major_formatter(FuncFormatter(currency_formatter))
ax.set_title('FuncFormatter Example')
plt.legend()
plt.show()
Output:
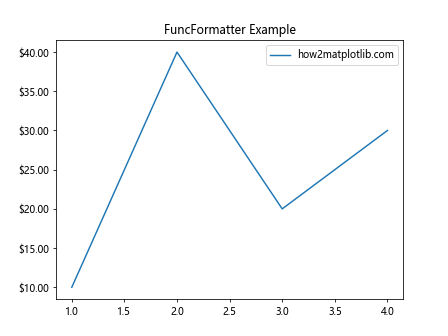
在这个例子中,我们定义了一个自定义函数currency_formatter,将y轴的刻度标签格式化为美元符号加两位小数的形式。
3. 日期和时间格式化
对于时间序列数据,Matplotlib提供了专门的日期时间格式化器。
3.1 DateFormatter
DateFormatter用于将日期时间对象格式化为指定的字符串格式。
import matplotlib.pyplot as plt
import matplotlib.dates as mdates
from datetime import datetime, timedelta

dates = [datetime(2023, 1, 1) + timedelta(days=i) for i in range(10)]
values = [1, 3, 2, 4, 3, 5, 4, 6, 5, 7]

fig, ax = plt.subplots()
ax.plot(dates, values, label='how2matplotlib.com')
ax.xaxis.set_major_formatter(mdates.DateFormatter('%Y-%m-%d'))
plt.gcf().autofmt_xdate()  # 自动调整日期标签的角度
ax.set_title('DateFormatter Example')
plt.legend()
plt.show()
Output:
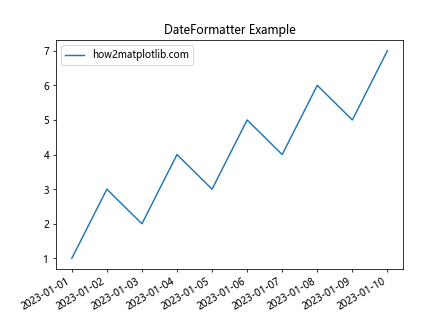
在这个例子中,我们使用DateFormatter将x轴的日期格式化为”年-月-日”的形式。
3.2 AutoDateFormatter
AutoDateFormatter可以根据日期范围自动选择合适的格式。
import matplotlib.pyplot as plt
import matplotlib.dates as mdates
from datetime import datetime, timedelta

dates = [datetime(2023, 1, 1) + timedelta(days=i*30) for i in range(12)]
values = [1, 3, 2, 4, 3, 5, 4, 6, 5, 7, 6, 8]

fig, ax = plt.subplots(figsize=(10, 6))
ax.plot(dates, values, label='how2matplotlib.com')
ax.xaxis.set_major_formatter(mdates.AutoDateFormatter(ax.xaxis.get_major_locator()))
plt.gcf().autofmt_xdate()
ax.set_title('AutoDateFormatter Example')
plt.legend()
plt.show()
Output:
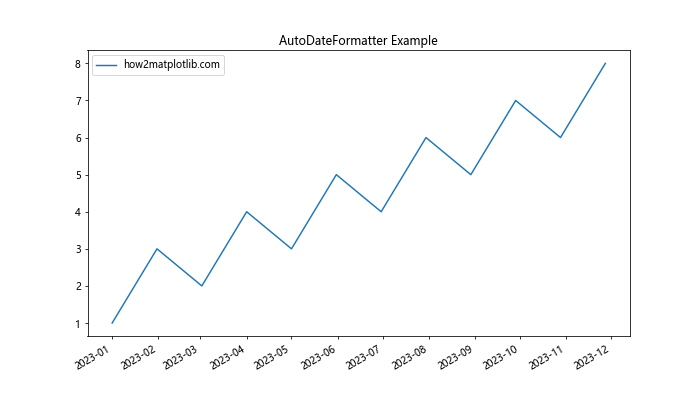
在这个例子中,AutoDateFormatter会根据日期范围自动选择合适的格式,比如月份或年份。
4. 科学记数法格式化
对于非常大或非常小的数值,使用科学记数法可以使图表更加清晰。
import matplotlib.pyplot as plt
from matplotlib.ticker import ScalarFormatter, FormatStrFormatter

fig, (ax1, ax2) = plt.subplots(1, 2, figsize=(12, 5))

x = [1e-5, 1e-4, 1e-3, 1e-2, 1e-1]
y = [i**2 for i in x]

ax1.plot(x, y, label='how2matplotlib.com')
ax1.set_xscale('log')
ax1.xaxis.set_major_formatter(ScalarFormatter())
ax1.xaxis.set_minor_formatter(ScalarFormatter())
ax1.set_title('ScalarFormatter with log scale')

ax2.plot(x, y, label='how2matplotlib.com')
ax2.set_xscale('log')
ax2.xaxis.set_major_formatter(FormatStrFormatter('%.0e'))
ax2.set_title('FormatStrFormatter with log scale')

for ax in (ax1, ax2):
    ax.tick_params(which='both', axis='x', rotation=45)
    ax.legend()

plt.tight_layout()
plt.show()
Output:
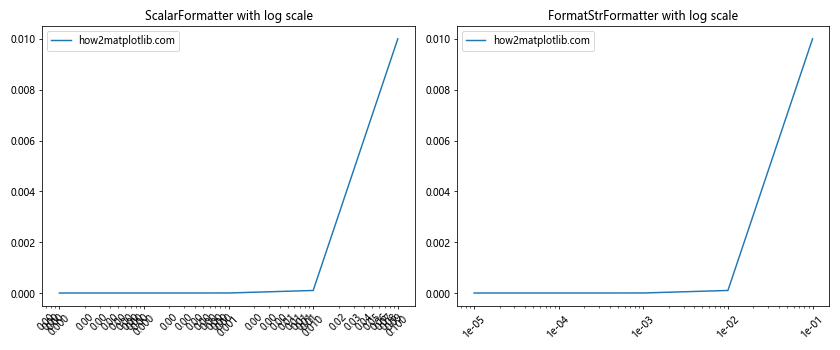
在这个例子中,我们比较了使用ScalarFormatter和FormatStrFormatter在对数刻度上的效果。ScalarFormatter会自动选择合适的表示方式,而FormatStrFormatter则强制使用科学记数法。
5. 百分比格式化
对于表示比例或百分比的数据,使用百分比格式可以更直观地展示信息。
import matplotlib.pyplot as plt
from matplotlib.ticker import FuncFormatter

def percentage_formatter(x, p):
    return f'{x:.1f}%'

fig, ax = plt.subplots()
data = [0.25, 0.4, 0.3, 0.05]
labels = ['A', 'B', 'C', 'D']
ax.pie(data, labels=labels, autopct=percentage_formatter)
ax.set_title('Percentage Formatter Example')
plt.text(0.5, -1.1, 'how2matplotlib.com', ha='center', va='center', transform=ax.transAxes)
plt.show()
在这个例子中,我们创建了一个饼图,并使用自定义的百分比格式化函数来显示每个扇形的百分比。
6. 多轴格式化
有时我们需要在同一个图表中显示不同单位或尺度的数据,这时可以使用多个y轴,并为每个轴设置不同的格式化器。
import matplotlib.pyplot as plt
from matplotlib.ticker import FuncFormatter

def celsius_formatter(x, p):
    return f'{x}°C'

def fahrenheit_formatter(x, p):
    return f'{x * 9/5 + 32:.1f}°F'

fig, ax1 = plt.subplots()

t = range(0, 100, 10)
s1 = [i for i in t]

color = 'tab:red'
ax1.set_xlabel('time (s)')
ax1.set_ylabel('temperature (°C)', color=color)
ax1.plot(t, s1, color=color, label='Celsius')
ax1.tick_params(axis='y', labelcolor=color)
ax1.yaxis.set_major_formatter(FuncFormatter(celsius_formatter))

ax2 = ax1.twinx()  # 创建共享x轴的第二个y轴

color = 'tab:blue'
ax2.set_ylabel('temperature (°F)', color=color)
ax2.plot(t, s1, color=color, label='Fahrenheit')
ax2.tick_params(axis='y', labelcolor=color)
ax2.yaxis.set_major_formatter(FuncFormatter(fahrenheit_formatter))

fig.tight_layout()
plt.title('Dual Axis Formatter Example')
plt.text(0.5, -0.15, 'how2matplotlib.com', ha='center', va='center', transform=ax1.transAxes)
plt.show()
Output:
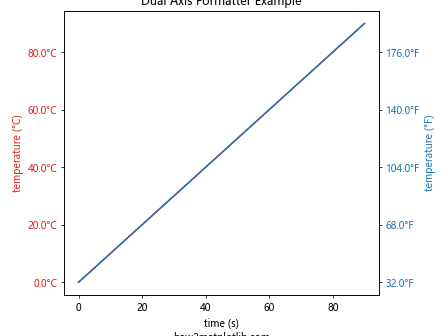
在这个例子中,我们创建了一个双y轴的图表,左侧y轴显示摄氏度,右侧y轴显示华氏度。我们为每个轴设置了不同的格式化器,以显示适当的温度单位。
7. 自定义刻度位置和标签
有时,我们可能需要完全自定义刻度的位置和标签。这可以通过结合使用set_major_locator()和set_major_formatter()来实现。
import matplotlib.pyplot as plt
from matplotlib.ticker import FixedLocator, FixedFormatter

fig, ax = plt.subplots()
ax.plot([1, 2, 3, 4, 5], [1, 4, 2, 3, 5], label='how2matplotlib.com')

# 自定义x轴刻度位置和标签
x_positions = [1, 3, 5]
x_labels = ['Low', 'Medium', 'High']
ax.xaxis.set_major_locator(FixedLocator(x_positions))
ax.xaxis.set_major_formatter(FixedFormatter(x_labels))

ax.set_title('Custom Tick Positions and Labels')
plt.legend()
plt.show()
Output:
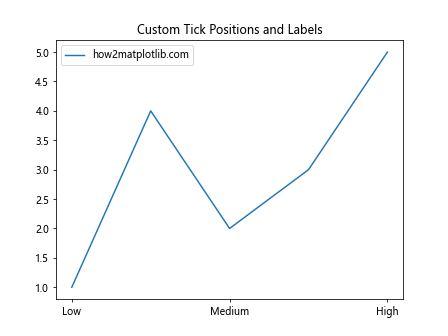
在这个例子中,我们使用FixedLocator来设置自定义的刻度位置,并使用FixedFormatter来设置对应的标签。
8. 对数刻度格式化
对于跨越多个数量级的数据,使用对数刻度可以更好地展示数据的变化趋势。
import matplotlib.pyplot as plt
import numpy as np
from matplotlib.ticker import LogFormatter

fig, ax = plt.subplots()

x = np.logspace(0, 5, 100)
y = x**2

ax.plot(x, y, label='how2matplotlib.com')
ax.set_xscale('log')
ax.set_yscale('log')

# 自定义对数刻度格式
formatter = LogFormatter(base=10, labelOnlyBase=False)
ax.xaxis.set_major_formatter(formatter)
ax.yaxis.set_major_formatter(formatter)

ax.set_title('Log Scale Formatter Example')
plt.legend()
plt.show()
Output:
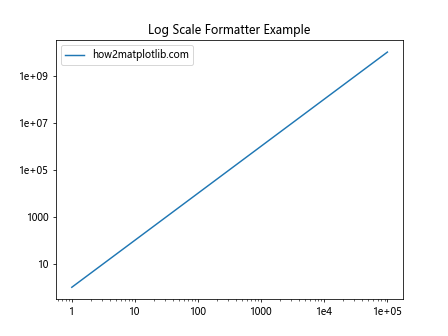
在这个例子中,我们使用LogFormatter来格式化对数刻度的标签,使其更易读。
9. 货币格式化
对于金融数据,使用适当的货币格式可以提高图表的专业性和可读性。
import matplotlib.pyplot as plt
from matplotlib.ticker import FuncFormatter

def currency_formatter(x, p):
    if x >= 1e6:
        return f'{x/1e6:.1f}M'
    elif x >= 1e3:
        return f'{x/1e3:.1f}K'
    else:
        return f'${x:.2f}'

fig, ax = plt.subplots()

sales = [1000, 5000, 20000, 50000, 200000, 1000000]
months = ['Jan', 'Feb', 'Mar', 'Apr', 'May', 'Jun']

ax.bar(months, sales)
ax.yaxis.set_major_formatter(FuncFormatter(currency_formatter))

ax.set_title('Monthly Sales')
plt.text(0.5, -0.1, 'how2matplotlib.com', ha='center', va='center', transform=ax.transAxes)
plt.show()
Output:
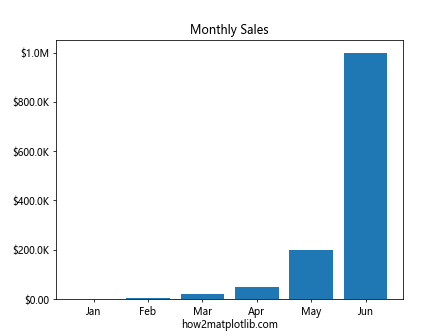
在这个例子中,我们创建了一个自定义的货币格式化函数,它可以根据数值的大小自动选择合适的单位(如K表示千,M表示百万)。
10. 角度格式化
对于极坐标图或需要显示角度的图表,使用角度格式化器可以提高可读性。
import matplotlib.pyplot as plt
import numpy as np
from matplotlib.ticker import FuncFormatter

def degree_formatter(x, p):
    return f'{x}°'

fig, ax = plt.subplots(subplot_kw=dict(projection='polar'))

r = np.arange(0, 2, 0.01)
theta = 2 * np.pi * r

ax.plot(theta, r, label='how2matplotlib.com')
ax.set_thetagrids(np.arange(0, 360, 45))
ax.xaxis.set_major_formatter(FuncFormatter(degree_formatter))

ax.set_title('Polar Plot with Degree Formatter')
plt.legend()
plt.show()
Output:
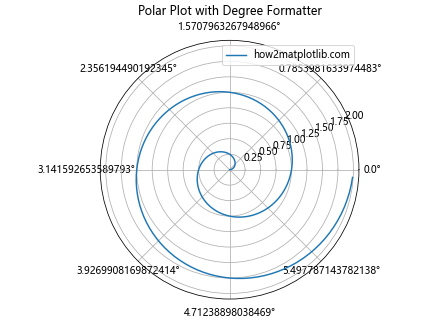
在这个例子中,我们创建了一个极坐标图,并使用自定义的角度格式化函数来显示角度标签。
11. 时间间隔格式化
对于表示持续时间或时间间隔的数据,使用专门的时间间隔格式化器可以使图表更加直观。
import matplotlib.pyplot as plt
from matplotlib.ticker import FuncFormatter

def time_formatter(x, p):
    hours = int(x)
    minutes = int((x - hours) * 60)
    return f'{hours:02d}:{minutes:02d}'

fig, ax = plt.subplots()

tasks = ['Task A', 'Task B', 'Task C', 'Task D']
durations = [1.5, 2.75, 0.5, 3.25]

ax.barh(tasks, durations)
ax.xaxis.set_major_formatter(FuncFormatter(time_formatter))

ax.set_title('Task Duration')
ax.set_xlabel('Time (HH:MM)')
plt.text(0.5, -0.15, 'how2matplotlib.com', ha='center', va='center', transform=ax.transAxes)
plt.tight_layout()
plt.show()
Output:
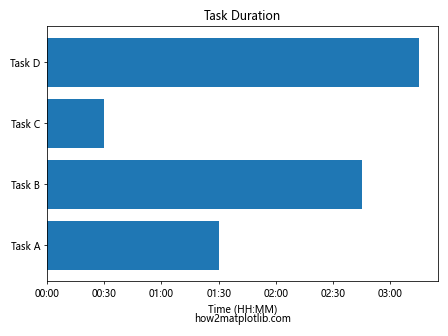
在这个例子中,我们创建了一个水平条形图来显示任务持续时间,并使用自定义的时间格式化函数将小时数转换为”小时:分钟”的格式。
12. 单位格式化
在科学或工程图表中,经常需要显示带有单位的数值。我们可以创建一个通用的单位格式化器来处理不同的单位。
import matplotlib.pyplot as plt
from matplotlib.ticker import FuncFormatter

def unit_formatter(unit):
    def formatter(x, p):
        if abs(x) >= 1e9:
            return f'{x/1e9:.1f}G{unit}'
        elif abs(x) >= 1e6:
            return f'{x/1e6:.1f}M{unit}'
        elif abs(x) >= 1e3:
            return f'{x/1e3:.1f}k{unit}'
        else:
            return f'{x:.1f}{unit}'
    return formatter

fig, (ax1, ax2) = plt.subplots(1, 2, figsize=(12, 5))

# 电压图
voltages = [1.5, 3000, 1000000, 2000000000]
times = range(len(voltages))
ax1.plot(times, voltages, marker='o')
ax1.yaxis.set_major_formatter(FuncFormatter(unit_formatter('V')))
ax1.set_title('Voltage over Time')
ax1.set_ylabel('Voltage')

# 电流图
currents = [0.001, 0.1, 10, 1000]
ax2.plot(times, currents, marker='o')
ax2.yaxis.set_major_formatter(FuncFormatter(unit_formatter('A')))
ax2.set_title('Current over Time')
ax2.set_ylabel('Current')

for ax in (ax1, ax2):
    ax.set_xlabel('Time')

plt.tight_layout()
plt.text(0.5, -0.2, 'how2matplotlib.com', ha='center', va='center', transform=fig.transFigure)
plt.show()
Output:
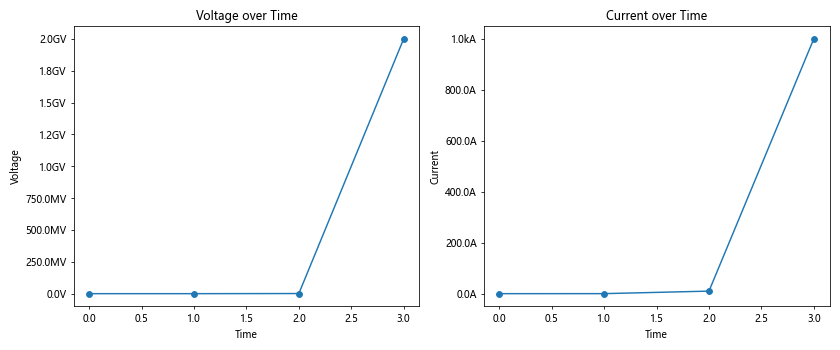
在这个例子中,我们创建了一个通用的单位格式化函数,它可以根据数值的大小自动选择合适的前缀(如k表示千,M表示兆,G表示吉)。我们用这个函数分别创建了电压和电流的格式化器。
13. 复数格式化
在处理复数数据时,我们可能需要自定义复数的显示格式。
import matplotlib.pyplot as plt
import numpy as np
from matplotlib.ticker import FuncFormatter

def complex_formatter(x, p):
    return f'{x.real:.2f} + {x.imag:.2f}i'

fig, ax = plt.subplots()

t = np.linspace(0, 2*np.pi, 100)
z = np.exp(1j*t)

ax.plot(z.real, z.imag)
ax.xaxis.set_major_formatter(FuncFormatter(complex_formatter))
ax.yaxis.set_major_formatter(FuncFormatter(complex_formatter))

ax.set_title('Complex Plane Plot')
ax.set_xlabel('Real Part')
ax.set_ylabel('Imaginary Part')
plt.text(0.5, -0.15, 'how2matplotlib.com', ha='center', va='center', transform=ax.transAxes)
plt.tight_layout()
plt.show()
Output:
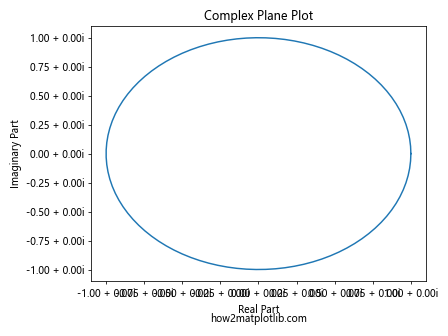
在这个例子中,我们创建了一个复平面上的单位圆图,并使用自定义的复数格式化函数来显示坐标轴上的复数值。
14. 分数格式化
在某些数学或科学图表中,可能需要将数值显示为分数形式。
import matplotlib.pyplot as plt
import numpy as np
from matplotlib.ticker import FuncFormatter
from fractions import Fraction

def fraction_formatter(x, p):
    frac = Fraction(x).limit_denominator(10)
    return f'{frac.numerator}/{frac.denominator}'

fig, ax = plt.subplots()

x = np.linspace(0, 1, 11)
y = x**2

ax.plot(x, y, marker='o')
ax.xaxis.set_major_formatter(FuncFormatter(fraction_formatter))
ax.yaxis.set_major_formatter(FuncFormatter(fraction_formatter))

ax.set_title('Fraction Formatter Example')
ax.set_xlabel('x')
ax.set_ylabel('y = x^2')
plt.text(0.5, -0.15, 'how2matplotlib.com', ha='center', va='center', transform=ax.transAxes)
plt.tight_layout()
plt.show()
Output:
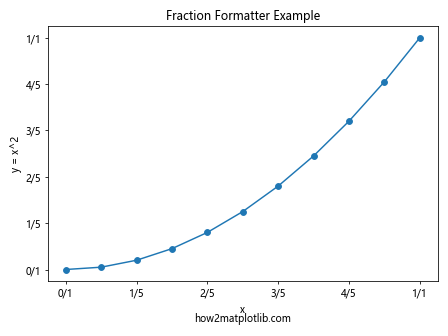
在这个例子中,我们创建了一个将小数转换为分数的格式化函数,并将其应用于x轴和y轴。这对于展示有理数或简单的数学关系非常有用。
15. 自定义文本标签
有时,我们可能需要使用完全自定义的文本标签,而不是基于数值的标签。
import matplotlib.pyplot as plt
from matplotlib.ticker import FixedLocator, FixedFormatter

fig, ax = plt.subplots()

data = [3, 7, 2, 9, 4]
categories = ['A', 'B', 'C', 'D', 'E']

ax.bar(range(len(data)), data)

ax.xaxis.set_major_locator(FixedLocator(range(len(data))))
ax.xaxis.set_major_formatter(FixedFormatter(categories))

ax.set_title('Custom Text Labels')
ax.set_ylabel('Value')
plt.text(0.5, -0.15, 'how2matplotlib.com', ha='center', va='center', transform=ax.transAxes)
plt.tight_layout()
plt.show()
Output:
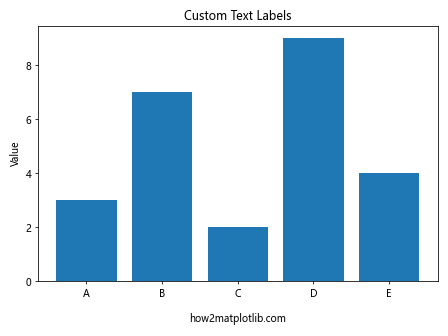
在这个例子中,我们创建了一个条形图,并使用FixedLocator和FixedFormatter来设置完全自定义的x轴标签。
16. 多语言支持
对于需要支持多语言的图表,我们可以创建一个根据当前语言设置来选择适当标签的格式化器。
import matplotlib.pyplot as plt
from matplotlib.ticker import FuncFormatter

# 模拟多语言支持
LANG = 'en'  # 可以改为 'fr' 或 'es' 来测试不同语言

translations = {
    'en': {'Monday': 'Monday', 'Tuesday': 'Tuesday', 'Wednesday': 'Wednesday', 'Thursday': 'Thursday', 'Friday': 'Friday'},
    'fr': {'Monday': 'Lundi', 'Tuesday': 'Mardi', 'Wednesday': 'Mercredi', 'Thursday': 'Jeudi', 'Friday': 'Vendredi'},
    'es': {'Monday': 'Lunes', 'Tuesday': 'Martes', 'Wednesday': 'Miércoles', 'Thursday': 'Jueves', 'Friday': 'Viernes'}
}

def day_formatter(x, p):
    days = ['Monday', 'Tuesday', 'Wednesday', 'Thursday', 'Friday']
    if 0 <= int(x) < len(days):
        return translations[LANG][days[int(x)]]
    return ''

fig, ax = plt.subplots()

data = [5, 7, 3, 8, 6]
ax.plot(range(len(data)), data, marker='o')

ax.xaxis.set_major_formatter(FuncFormatter(day_formatter))

ax.set_title('Multi-language Support Example')
ax.set_ylabel('Value')
plt.text(0.5, -0.15, 'how2matplotlib.com', ha='center', va='center', transform=ax.transAxes)
plt.tight_layout()
plt.show()
Output:
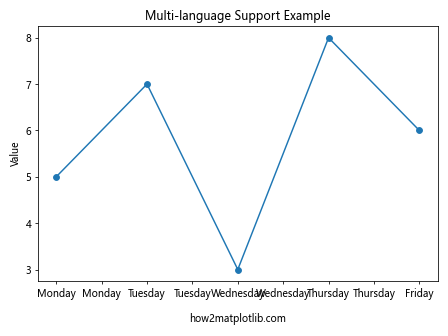
在这个例子中,我们创建了一个支持多语言的日期格式化器。通过更改LANG变量,可以切换不同的语言版本。
总结
Matplotlib的set_major_formatter()函数是一个强大而灵活的工具,可以帮助我们创建更加专业、信息丰富的图表。通过本文介绍的各种格式化技巧,我们可以根据数据的特性和图表的目的,选择最合适的格式化方式。无论是处理日期时间、科学记数法、百分比、货币还是自定义文本标签,set_major_formatter()函数都能满足我们的需求。
在实际应用中,合理使用格式化器可以大大提高图表的可读性和美观度。同时,我们也要注意不要过度格式化,保持图表的简洁和清晰才是最重要的。随着对Matplotlib的深入学习和实践,相信你会发现更多创造性的方式来使用set_major_formatter()函数,从而制作出更加出色的数据可视化作品。
 极客笔记
极客笔记