Matplotlib 文本框:如何在图表中添加和自定义文本注释
Matplotlib 是 Python 中最流行的数据可视化库之一,它提供了丰富的功能来创建各种类型的图表和图形。在数据可视化中,添加文本注释是一种常见的需求,可以帮助解释数据点、标记重要信息或提供额外的上下文。Matplotlib 的文本框功能允许用户在图表中添加自定义的文本区域,并对其进行灵活的样式设置和定位。本文将详细介绍如何在 Matplotlib 中使用文本框,包括创建基本文本框、自定义样式、定位、与其他图形元素交互等高级技巧。
1. 基本文本框的创建
在 Matplotlib 中,我们可以使用 text() 函数来添加简单的文本注释。虽然这不是严格意义上的”文本框”,但它是创建文本注释的基础。让我们从一个简单的例子开始:
import matplotlib.pyplot as plt

fig, ax = plt.subplots()
ax.set_xlim(0, 10)
ax.set_ylim(0, 10)

ax.text(5, 5, "Hello from how2matplotlib.com",
        ha='center', va='center',
        bbox=dict(facecolor='white', edgecolor='black', boxstyle='round'))

plt.show()
Output:
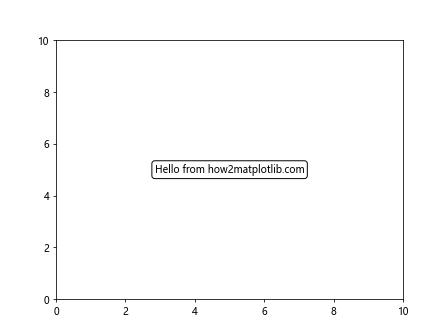
在这个例子中,我们创建了一个简单的图表,并在坐标 (5, 5) 处添加了一个文本。bbox 参数用于创建一个围绕文本的框,我们设置了白色背景、黑色边框和圆角样式。ha 和 va 参数分别用于设置水平和垂直对齐方式。
2. 自定义文本框样式
Matplotlib 提供了多种方式来自定义文本框的外观。我们可以调整边框颜色、填充颜色、透明度、边框宽度等属性。以下是一个更复杂的例子:
import matplotlib.pyplot as plt

fig, ax = plt.subplots()
ax.set_xlim(0, 10)
ax.set_ylim(0, 10)

text_box = ax.text(5, 5, "Customized box from how2matplotlib.com",
                   ha='center', va='center',
                   bbox=dict(facecolor='lightblue',
                             edgecolor='navy',
                             boxstyle='round,pad=0.5',
                             alpha=0.8,
                             linewidth=2))

plt.show()
Output:
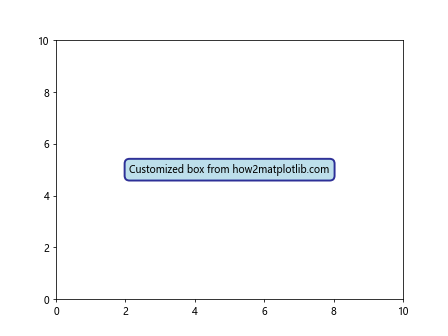
在这个例子中,我们创建了一个更加定制化的文本框。我们使用了浅蓝色的填充色(facecolor),深蓝色的边框(edgecolor),增加了内边距(pad),设置了透明度(alpha),并增加了边框宽度(linewidth)。
3. 文本框的定位
文本框的定位是一个重要的话题,因为我们often需要将文本放置在图表的特定位置。Matplotlib 提供了多种定位方式,包括使用数据坐标、轴坐标和图表坐标。
3.1 使用数据坐标
默认情况下,text() 函数使用数据坐标系。这意味着文本的位置是相对于数据点的:
import matplotlib.pyplot as plt
import numpy as np

x = np.linspace(0, 10, 100)
y = np.sin(x)

fig, ax = plt.subplots()
ax.plot(x, y)

ax.text(5, 0.5, "Peak from how2matplotlib.com",
        ha='center', va='bottom',
        bbox=dict(facecolor='white', edgecolor='red'))

plt.show()
Output:
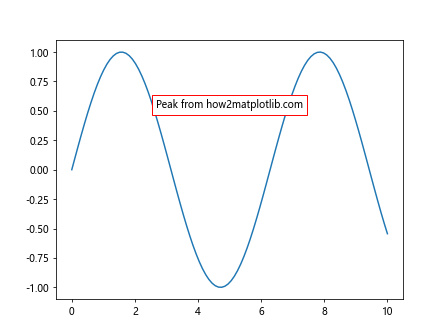
在这个例子中,文本框被放置在 x=5, y=0.5 的位置,这是相对于数据的坐标。
3.2 使用轴坐标
有时候,我们可能想要使用轴坐标来定位文本框。这可以通过设置 transform 参数来实现:
import matplotlib.pyplot as plt

fig, ax = plt.subplots()
ax.set_xlim(0, 10)
ax.set_ylim(0, 10)

ax.text(0.5, 0.5, "Center of axes from how2matplotlib.com",
        ha='center', va='center',
        transform=ax.transAxes,
        bbox=dict(facecolor='yellow', edgecolor='black'))

plt.show()
Output:
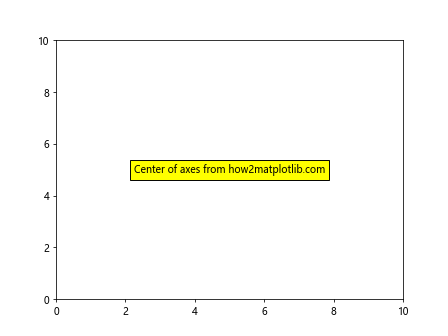
在这个例子中,transform=ax.transAxes 表示我们使用轴坐标系,其中 (0, 0) 是轴的左下角,(1, 1) 是右上角。
3.3 使用图表坐标
如果我们想要相对于整个图表来定位文本框,可以使用图表坐标系:
import matplotlib.pyplot as plt

fig, ax = plt.subplots()
ax.set_xlim(0, 10)
ax.set_ylim(0, 10)

fig.text(0.5, 0.95, "Top of figure from how2matplotlib.com",
         ha='center', va='top',
         bbox=dict(facecolor='lightgreen', edgecolor='green'))

plt.show()
Output:
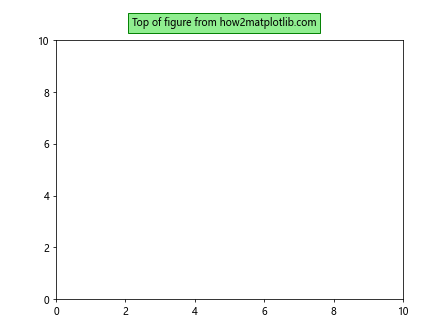
在这个例子中,我们使用 fig.text() 而不是 ax.text(),这允许我们相对于整个图表来定位文本。
4. 文本框中的格式化文本
Matplotlib 支持在文本框中使用各种文本格式,包括数学公式、换行、字体样式等。
4.1 数学公式
Matplotlib 可以渲染 LaTeX 风格的数学公式:
import matplotlib.pyplot as plt

fig, ax = plt.subplots()
ax.set_xlim(0, 10)
ax.set_ylim(0, 10)

ax.text(5, 5, r"f(x) = \sin(x) from how2matplotlib.com",
        ha='center', va='center',
        bbox=dict(facecolor='white', edgecolor='black'),
        fontsize=14)

plt.show()
Output:
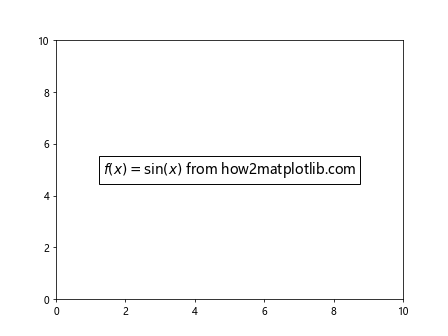
在这个例子中,我们在文本中包含了一个简单的数学公式。注意使用原始字符串(r"...")来避免反斜杠被转义。
4.2 多行文本
我们可以在文本框中包含多行文本:
import matplotlib.pyplot as plt

fig, ax = plt.subplots()
ax.set_xlim(0, 10)
ax.set_ylim(0, 10)

ax.text(5, 5, "Line 1\nLine 2\nLine 3\nfrom how2matplotlib.com",
        ha='center', va='center',
        bbox=dict(facecolor='white', edgecolor='black'),
        multialignment='center')

plt.show()
Output:
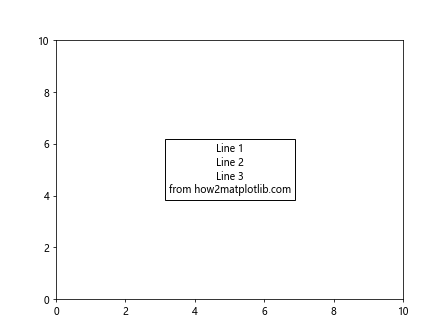
在这个例子中,我们使用 \n 来创建换行,并使用 multialignment 参数来设置多行文本的对齐方式。
5. 文本框的动态调整
有时候,我们可能需要根据文本内容动态调整文本框的大小。Matplotlib 提供了 FancyBboxPatch 类来实现这一功能:
import matplotlib.pyplot as plt
from matplotlib.patches import FancyBboxPatch

fig, ax = plt.subplots()
ax.set_xlim(0, 10)
ax.set_ylim(0, 10)

text = ax.text(5, 5, "Dynamic box from how2matplotlib.com",
               ha='center', va='center')

bbox = text.get_bbox_patch()
bbox_props = dict(boxstyle="round,pad=0.5", fc="yellow", ec="b", lw=2)
t_bbox = FancyBboxPatch((0, 0), 1, 1,
                        transform=text.get_transform(),
                        **bbox_props)

ax.add_patch(t_bbox)
t_bbox.set_clip_on(False)

plt.show()
Output:
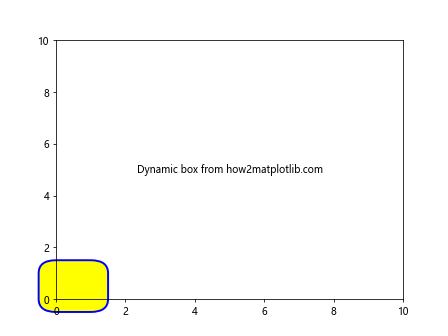
在这个例子中,我们创建了一个 FancyBboxPatch 对象,它会自动调整大小以适应文本内容。
6. 文本框与其他图形元素的交互
文本框often需要与图表中的其他元素进行交互。例如,我们可能想要用文本框标注特定的数据点。
6.1 标注数据点
import matplotlib.pyplot as plt
import numpy as np

x = np.linspace(0, 10, 100)
y = np.sin(x)

fig, ax = plt.subplots()
ax.plot(x, y)

max_index = np.argmax(y)
ax.annotate('Maximum', xy=(x[max_index], y[max_index]),
            xytext=(x[max_index]+1, y[max_index]+0.1),
            arrowprops=dict(facecolor='black', shrink=0.05),
            bbox=dict(boxstyle="round", fc="w"),
            ha='center', va='center')

ax.text(5, -0.5, "Annotation example from how2matplotlib.com",
        ha='center', va='center',
        bbox=dict(facecolor='lightgray', edgecolor='gray'))

plt.show()
Output:
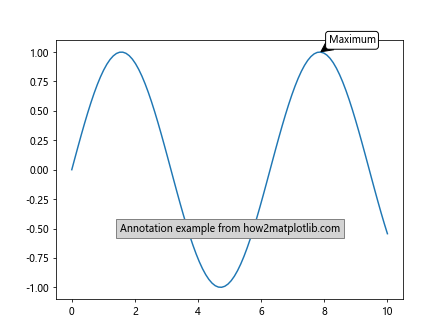
在这个例子中,我们使用 annotate() 函数来创建一个带箭头的文本框,指向正弦波的最大值点。
6.2 文本框作为图例
我们可以使用文本框来创建自定义的图例:
import matplotlib.pyplot as plt
import numpy as np

x = np.linspace(0, 10, 100)
y1 = np.sin(x)
y2 = np.cos(x)

fig, ax = plt.subplots()
ax.plot(x, y1, 'b-')
ax.plot(x, y2, 'r-')

ax.text(0.95, 0.95, 'sin(x)', transform=ax.transAxes,
        ha='right', va='top',
        bbox=dict(facecolor='white', edgecolor='blue'))
ax.text(0.95, 0.85, 'cos(x)', transform=ax.transAxes,
        ha='right', va='top',
        bbox=dict(facecolor='white', edgecolor='red'))

ax.text(5, -1.5, "Custom legend from how2matplotlib.com",
        ha='center', va='center',
        bbox=dict(facecolor='lightgray', edgecolor='gray'))

plt.show()
Output:
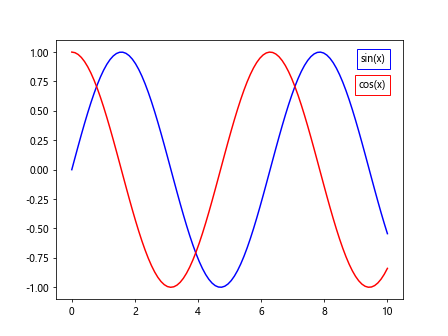
在这个例子中,我们使用文本框创建了一个自定义的图例,每个文本框的边框颜色与对应的线条颜色匹配。
7. 高级文本框技巧
7.1 文本框阴影
我们可以为文本框添加阴影效果,使其更加突出:
import matplotlib.pyplot as plt
from matplotlib.patheffects import withStroke

fig, ax = plt.subplots()
ax.set_xlim(0, 10)
ax.set_ylim(0, 10)

text = ax.text(5, 5, "Shadow effect from how2matplotlib.com",
               ha='center', va='center', fontsize=16,
               bbox=dict(facecolor='white', edgecolor='black'),
               path_effects=[withStroke(linewidth=3, foreground='gray')])

plt.show()
Output:
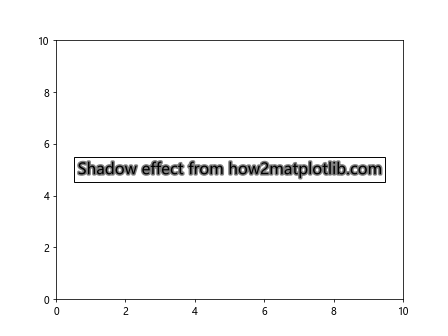
在这个例子中,我们使用 path_effects 参数来为文本添加阴影效果。
7.2 渐变背景
我们可以使用 LinearGradient 来为文本框创建渐变背景:
import matplotlib.pyplot as plt
import matplotlib.patches as patches
import matplotlib.transforms as transforms

fig, ax = plt.subplots()
ax.set_xlim(0, 10)
ax.set_ylim(0, 10)

text = ax.text(5, 5, "Gradient background from how2matplotlib.com",
               ha='center', va='center', fontsize=12)

bbox = text.get_bbox_patch()
box_coords = bbox.get_extents()

gradient = plt.matplotlib.colors.LinearSegmentedColormap.from_list("", ["red", "yellow"])
rect = patches.Rectangle((box_coords.x0, box_coords.y0),
                         box_coords.width, box_coords.height,
                         fill=True, transform=ax.transData,
                         facecolor=gradient(0.5))
ax.add_patch(rect)

plt.show()
在这个例子中,我们创建了一个从红色到黄色的渐变背景for文本框。
7.3 动画文本框
我们可以创建动画文本框,使其随时间变化:
import matplotlib.pyplot as plt
import matplotlib.animation as animation

fig, ax = plt.subplots()
ax.set_xlim(0, 10)
ax.set_ylim(0, 10)

text = ax.text(5, 5, "Animated text from how2matplotlib.com",
               ha='center', va='center', fontsize=12,
               bbox=dict(facecolor='white', edgecolor='black'))

def animate(frame):
    text.set_position((5 + frame/10, 5))
    return text,

ani = animation.FuncAnimation(fig, animate, frames=50, interval=50, blit=True)

plt.show()
Output:
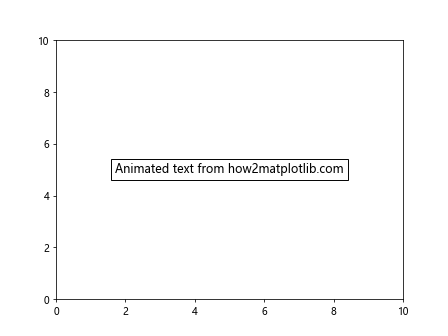
在这个例子中,我们创建了一个简单的动画,使文本框在水平方向上移动。
8. 文本框与交互式图表
Matplotlib 支持创建交互式图表,我们可以结合文本框来增强交互体验。
8.1 鼠标悬停显示文本
我们可以创建一个在鼠标悬停时显示信息的文本框:
import matplotlib.pyplot as plt
import numpy as np

x = np.linspace(0, 10, 100)
y= np.sin(x)

fig, ax = plt.subplots()
ax.plot(x, y)

annot = ax.annotate("", xy=(0,0), xytext=(20,20),textcoords="offset points",
                    bbox=dict(boxstyle="round", fc="w"),
                    arrowprops=dict(arrowstyle="->"))
annot.set_visible(False)

def update_annot(ind):
    x, y = x[ind["ind"][0]], y[ind["ind"][0]]
    annot.xy = (x, y)
    text = f"({x:.2f}, {y:.2f})\nfrom how2matplotlib.com"
    annot.set_text(text)
    annot.get_bbox_patch().set_alpha(0.4)

def hover(event):
    vis = annot.get_visible()
    if event.inaxes == ax:
        cont, ind = ax.plot[0].contains(event)
        if cont:
            update_annot(ind)
            annot.set_visible(True)
            fig.canvas.draw_idle()
        else:
            if vis:
                annot.set_visible(False)
                fig.canvas.draw_idle()

fig.canvas.mpl_connect("motion_notify_event", hover)

plt.show()
Output:
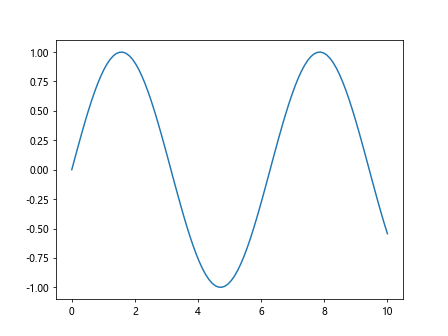
这个例子创建了一个交互式图表,当鼠标悬停在数据点上时,会显示该点的坐标信息。
8.2 点击显示文本
我们也可以创建一个在点击时显示信息的文本框:
import matplotlib.pyplot as plt
import numpy as np

x = np.linspace(0, 10, 100)
y = np.sin(x)

fig, ax = plt.subplots()
ax.plot(x, y)

text = ax.text(0.5, 0.95, "", transform=ax.transAxes, va='top')

def on_click(event):
    if event.inaxes == ax:
        text.set_text(f"Clicked at ({event.xdata:.2f}, {event.ydata:.2f})\nfrom how2matplotlib.com")
        text.set_bbox(dict(facecolor='white', edgecolor='black', alpha=0.8))
        fig.canvas.draw_idle()

fig.canvas.mpl_connect('button_press_event', on_click)

plt.show()
Output:
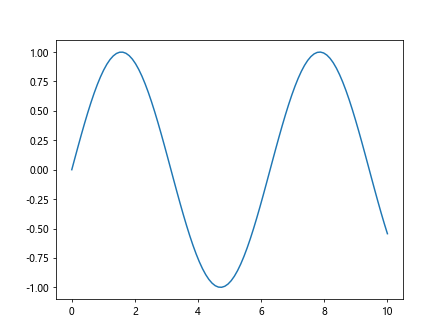
这个例子创建了一个交互式图表,当用户点击图表时,会在顶部显示点击位置的坐标信息。
9. 文本框与子图
当我们使用子图时,文本框的使用变得更加复杂。我们需要考虑如何在多个子图中添加和定位文本框。
9.1 在多个子图中添加文本框
import matplotlib.pyplot as plt
import numpy as np

fig, (ax1, ax2) = plt.subplots(1, 2, figsize=(12, 5))

x = np.linspace(0, 10, 100)
ax1.plot(x, np.sin(x))
ax2.plot(x, np.cos(x))

ax1.text(0.5, 0.95, "Sine wave", transform=ax1.transAxes,
         ha='center', va='top',
         bbox=dict(facecolor='lightblue', edgecolor='blue', alpha=0.8))

ax2.text(0.5, 0.95, "Cosine wave", transform=ax2.transAxes,
         ha='center', va='top',
         bbox=dict(facecolor='lightgreen', edgecolor='green', alpha=0.8))

fig.text(0.5, 0.02, "Subplots example from how2matplotlib.com",
         ha='center', va='center',
         bbox=dict(facecolor='yellow', edgecolor='orange', alpha=0.8))

plt.show()
Output:
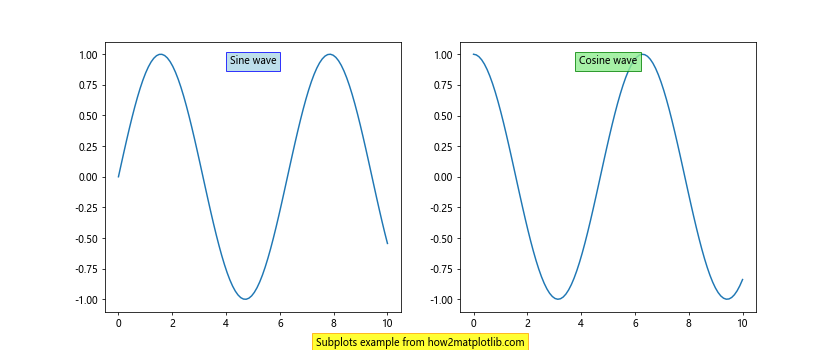
在这个例子中,我们在两个子图中分别添加了文本框,并在整个图表底部添加了一个共享的文本框。
9.2 跨越多个子图的文本框
有时我们可能需要创建跨越多个子图的文本框:
import matplotlib.pyplot as plt
import numpy as np

fig, (ax1, ax2) = plt.subplots(1, 2, figsize=(12, 5))

x = np.linspace(0, 10, 100)
ax1.plot(x, np.sin(x))
ax2.plot(x, np.cos(x))

fig.text(0.5, 0.95, "Trigonometric Functions",
         ha='center', va='top', fontsize=16,
         bbox=dict(facecolor='white', edgecolor='black', alpha=0.8))

ax1.text(0.5, 0.05, "Sine", transform=ax1.transAxes,
         ha='center', va='bottom')
ax2.text(0.5, 0.05, "Cosine", transform=ax2.transAxes,
         ha='center', va='bottom')

fig.text(0.5, 0.02, "Spanning text box example from how2matplotlib.com",
         ha='center', va='center',
         bbox=dict(facecolor='yellow', edgecolor='orange', alpha=0.8))

plt.show()
Output:
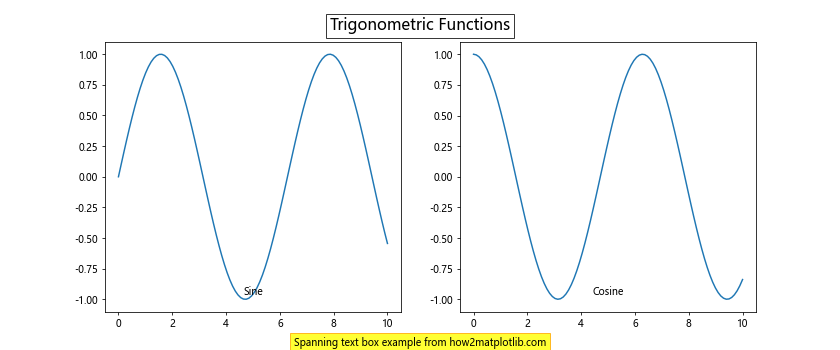
在这个例子中,我们使用 fig.text() 创建了一个跨越两个子图的标题文本框。
10. 文本框与数据可视化
文本框在数据可视化中扮演着重要角色,它们可以用来标注重要数据点、解释趋势或提供额外的上下文信息。
10.1 在散点图中使用文本框
import matplotlib.pyplot as plt
import numpy as np

np.random.seed(42)
x = np.random.rand(50)
y = np.random.rand(50)
colors = np.random.rand(50)
sizes = 1000 * np.random.rand(50)

fig, ax = plt.subplots()
scatter = ax.scatter(x, y, c=colors, s=sizes, alpha=0.5)

ax.text(0.95, 0.95, "Scatter Plot", transform=ax.transAxes,
        ha='right', va='top',
        bbox=dict(facecolor='white', edgecolor='black', alpha=0.8))

ax.text(0.05, 0.05, "Size represents value\nColor represents category",
        transform=ax.transAxes, ha='left', va='bottom',
        bbox=dict(facecolor='white', edgecolor='black', alpha=0.8))

fig.text(0.5, 0.02, "Scatter plot example from how2matplotlib.com",
         ha='center', va='center',
         bbox=dict(facecolor='yellow', edgecolor='orange', alpha=0.8))

plt.show()
Output:
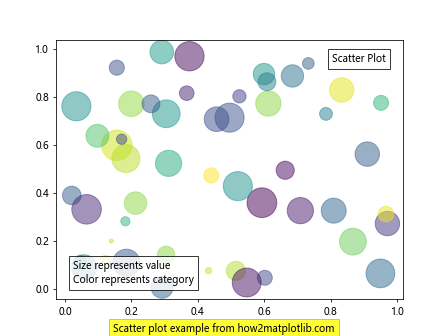
在这个例子中,我们创建了一个散点图,并使用文本框来提供图表标题和额外的解释信息。
10.2 在折线图中使用文本框标注最大值和最小值
import matplotlib.pyplot as plt
import numpy as np

x = np.linspace(0, 10, 100)
y = np.sin(x) * np.exp(-x/10)

fig, ax = plt.subplots()
ax.plot(x, y)

max_index = np.argmax(y)
min_index = np.argmin(y)

ax.annotate('Maximum', xy=(x[max_index], y[max_index]),
            xytext=(x[max_index]+0.5, y[max_index]+0.1),
            arrowprops=dict(facecolor='black', shrink=0.05),
            bbox=dict(boxstyle="round", fc="w"))

ax.annotate('Minimum', xy=(x[min_index], y[min_index]),
            xytext=(x[min_index]-0.5, y[min_index]-0.1),
            arrowprops=dict(facecolor='black', shrink=0.05),
            bbox=dict(boxstyle="round", fc="w"))

ax.text(0.5, 0.95, "Damped Sine Wave", transform=ax.transAxes,
        ha='center', va='top',
        bbox=dict(facecolor='white', edgecolor='black', alpha=0.8))

fig.text(0.5, 0.02, "Line plot with annotations from how2matplotlib.com",
         ha='center', va='center',
         bbox=dict(facecolor='yellow', edgecolor='orange', alpha=0.8))

plt.show()
Output:
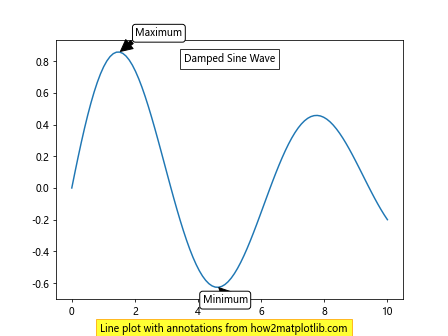
在这个例子中,我们创建了一个折线图,并使用文本框标注了最大值和最小值点。
结论
Matplotlib 的文本框功能为数据可视化提供了强大的注释和说明工具。通过本文的详细介绍,我们了解了如何创建基本的文本框、自定义文本框样式、定位文本框、格式化文本内容、与其他图形元素交互,以及在复杂的图表中使用文本框。这些技巧可以帮助我们创建更加信息丰富、易于理解的数据可视化图表。
无论是简单的标注还是复杂的交互式图表,文本框都是不可或缺的元素。通过灵活运用文本框,我们可以有效地传达数据背后的故事,突出重要信息,并为观众提供必要的上下文。在实际应用中,合理使用文本框可以大大提高数据可视化的质量和可读性。
随着数据可视化需求的不断增长,掌握 Matplotlib 文本框的使用技巧将成为数据科学家和可视化专家的重要技能。通过不断实践和探索,我们可以创造出更加丰富、生动的数据可视化作品,更好地服务于数据分析和决策支持。
 极客笔记
极客笔记