Matplotlib 文本加粗技巧:如何创建醒目的图表标签和注释
Matplotlib 是 Python 中最流行的数据可视化库之一,它提供了丰富的功能来创建各种类型的图表和绘图。在数据可视化中,文本元素如标题、轴标签和注释等扮演着至关重要的角色,它们能够有效地传达图表的关键信息。而在某些情况下,我们需要强调特定的文本内容,这时候文本加粗就成为了一个非常有用的技巧。本文将详细介绍如何在 Matplotlib 中实现文本加粗,以及在不同场景下的应用技巧。
1. 文本加粗的基本方法
在 Matplotlib 中,实现文本加粗的最基本方法是使用 fontweight 参数。这个参数可以应用于多种文本元素,如标题、轴标签、文本注释等。
1.1 使用字符串值设置加粗
最简单的方法是将 fontweight 参数设置为字符串 ‘bold’。
import matplotlib.pyplot as plt

fig, ax = plt.subplots()
ax.text(0.5, 0.5, 'How2matplotlib.com - Bold Text', fontweight='bold', ha='center', va='center')
plt.title('Bold Text Example', fontweight='bold')
plt.xlabel('X-axis', fontweight='bold')
plt.ylabel('Y-axis', fontweight='bold')
plt.show()
Output:
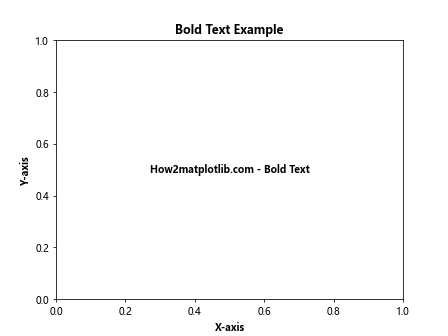
在这个例子中,我们创建了一个简单的图表,并在图表中心添加了一个加粗的文本。同时,我们也将标题和轴标签设置为加粗。fontweight='bold' 参数使得文本变为加粗效果。
1.2 使用数值设置加粗程度
除了使用字符串 ‘bold’,我们还可以使用数值来更精确地控制文本的加粗程度。Matplotlib 支持使用范围从 0 到 1000 的数值来设置字体粗细,其中 400 对应普通字体,700 对应加粗字体。
import matplotlib.pyplot as plt

fig, ax = plt.subplots()
ax.text(0.2, 0.8, 'How2matplotlib.com - Normal (400)', fontweight=400)
ax.text(0.2, 0.6, 'How2matplotlib.com - Semi-Bold (600)', fontweight=600)
ax.text(0.2, 0.4, 'How2matplotlib.com - Bold (700)', fontweight=700)
ax.text(0.2, 0.2, 'How2matplotlib.com - Extra Bold (800)', fontweight=800)

plt.title('Different Font Weights', fontweight='bold')
plt.axis('off')
plt.show()
Output:
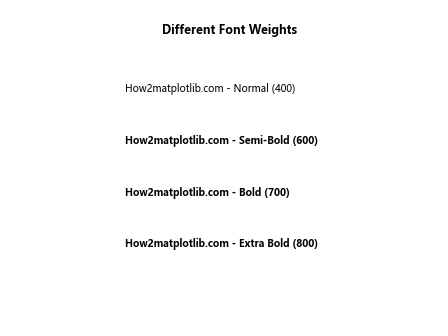
这个例子展示了不同数值设置下的文本加粗效果。通过调整 fontweight 的数值,我们可以实现从普通到超粗体的多种字体粗细效果。
2. 在不同文本元素中应用加粗
Matplotlib 提供了多种文本元素,我们可以在这些元素中应用加粗效果。下面我们将逐一介绍如何在这些元素中实现文本加粗。
2.1 标题加粗
标题是图表中最显眼的文本元素之一,通常用于概括图表的主要内容。为标题添加加粗效果可以使其更加醒目。
import matplotlib.pyplot as plt

fig, ax = plt.subplots()
ax.plot([1, 2, 3, 4], [1, 4, 2, 3])
plt.title('How2matplotlib.com - Bold Title Example', fontweight='bold', fontsize=16)
plt.show()
Output:
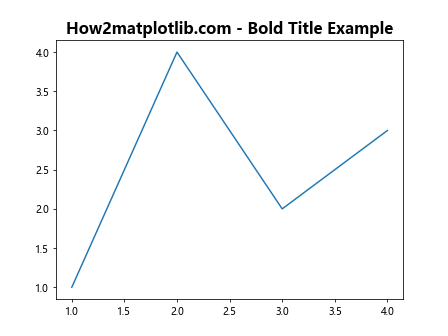
在这个例子中,我们创建了一个简单的线图,并为其添加了一个加粗的标题。fontweight='bold' 参数使标题文本变为加粗,而 fontsize=16 则设置了字体大小,使标题更加突出。
2.2 轴标签加粗
轴标签用于说明图表中 x 轴和 y 轴所代表的含义。加粗轴标签可以使其更易读,尤其是在图表较为复杂的情况下。
import matplotlib.pyplot as plt

fig, ax = plt.subplots()
ax.plot([1, 2, 3, 4], [1, 4, 2, 3])
plt.xlabel('X-axis Label (How2matplotlib.com)', fontweight='bold')
plt.ylabel('Y-axis Label (How2matplotlib.com)', fontweight='bold')
plt.show()
Output:
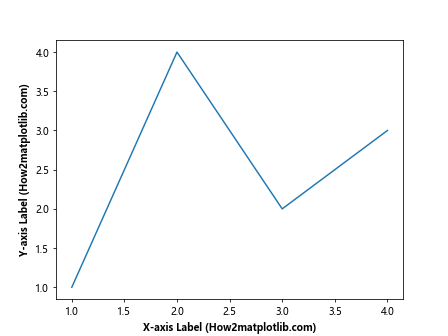
这个例子展示了如何为 x 轴和 y 轴的标签添加加粗效果。通过设置 fontweight='bold',我们使得轴标签更加醒目。
2.3 图例文本加粗
图例用于解释图表中不同数据系列的含义。在某些情况下,我们可能希望强调图例中的某些文本。
import matplotlib.pyplot as plt

fig, ax = plt.subplots()
ax.plot([1, 2, 3, 4], [1, 4, 2, 3], label='Series 1')
ax.plot([1, 2, 3, 4], [3, 2, 4, 1], label='Series 2')
legend = plt.legend(title='How2matplotlib.com')
plt.setp(legend.get_title(), fontweight='bold')
for text in legend.get_texts():
    plt.setp(text, fontweight='bold')
plt.show()
Output:
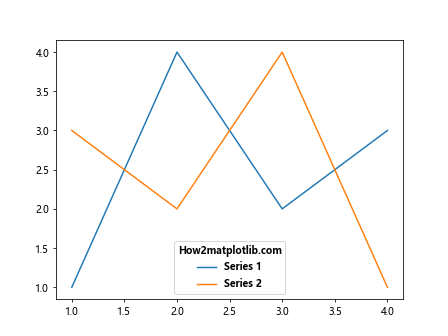
在这个例子中,我们创建了一个包含两个数据系列的图表,并为图例添加了加粗效果。我们不仅加粗了图例的标题,还加粗了图例中的每个文本项。
2.4 文本注释加粗
文本注释常用于在图表的特定位置添加额外的说明信息。加粗注释文本可以使其在图表中更加突出。
import matplotlib.pyplot as plt

fig, ax = plt.subplots()
ax.plot([1, 2, 3, 4], [1, 4, 2, 3])
ax.annotate('How2matplotlib.com\nImportant Point', xy=(2, 4), xytext=(3, 3),
            arrowprops=dict(facecolor='black', shrink=0.05),
            fontweight='bold')
plt.show()
Output:
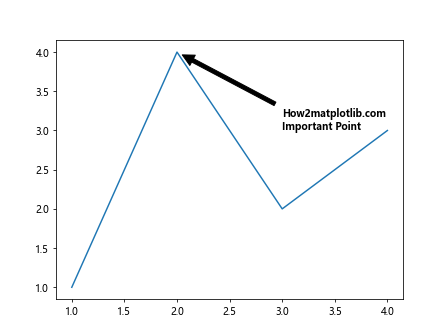
这个例子展示了如何创建一个加粗的文本注释。我们使用 annotate 函数添加了一个指向特定数据点的注释,并通过 fontweight='bold' 参数使注释文本加粗。
3. 高级文本加粗技巧
除了基本的文本加粗方法,Matplotlib 还提供了一些高级技巧,允许我们更灵活地控制文本的加粗效果。
3.1 使用 LaTeX 语法
Matplotlib 支持使用 LaTeX 语法来渲染文本,这为我们提供了更多的文本格式化选项,包括更精细的加粗控制。
import matplotlib.pyplot as plt

fig, ax = plt.subplots()
ax.text(0.5, 0.5, r'\bf{How2matplotlib.com:} \mathbf{Bold} and \mathrm{Normal} Text',
        ha='center', va='center')
plt.title(r'\bf{Using\ LaTeX\ for\ Bold\ Text}')
plt.show()
Output:
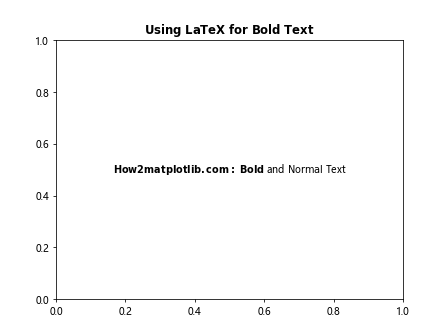
在这个例子中,我们使用 LaTeX 语法来创建加粗文本。\bf{} 和 \mathbf{} 命令用于加粗文本,而 \mathrm{} 用于普通文本。注意,当使用 LaTeX 语法时,我们需要在字符串前加上 r 前缀,以避免转义字符的问题。
3.2 部分文本加粗
有时我们可能只想加粗文本中的某一部分。使用 LaTeX 语法或字符串格式化可以轻松实现这一点。
import matplotlib.pyplot as plt

fig, ax = plt.subplots()
ax.text(0.5, 0.7, 'How2matplotlib.com: ' + r'\bf{Bold} and Normal Text', ha='center')
ax.text(0.5, 0.3, f"{'How2matplotlib.com:':<20}{'Bold':>20}", fontweight='bold', ha='center')
plt.show()
Output:
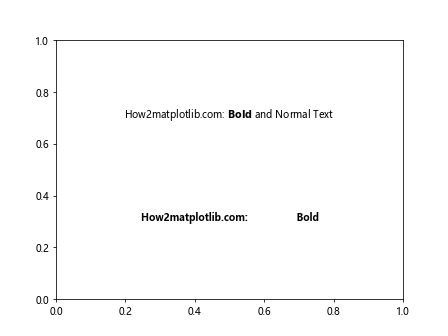
这个例子展示了两种部分文本加粗的方法。第一种使用 LaTeX 语法,第二种使用字符串格式化和 fontweight 参数。
3.3 动态调整文本粗细
在某些情况下,我们可能需要根据数据或其他条件动态调整文本的粗细。
import matplotlib.pyplot as plt
import numpy as np

fig, ax = plt.subplots()
data = np.random.rand(10)
for i, value in enumerate(data):
    weight = int(400 + value * 600)  # 将值映射到 400-1000 范围
    ax.text(i, value, f'How2matplotlib.com\n{value:.2f}', ha='center', va='bottom', fontweight=weight)
plt.title('Dynamic Font Weight Based on Data')
plt.show()
Output:
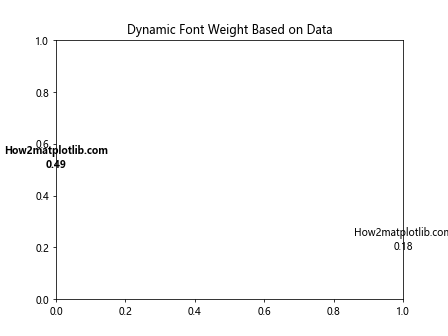
这个例子演示了如何根据数据值动态调整文本的粗细。我们将随机生成的数据值映射到 400-1000 的范围,然后将这个值用作 fontweight 参数。
3.4 结合其他文本样式
文本加粗通常与其他文本样式结合使用,以创建更丰富的视觉效果。
import matplotlib.pyplot as plt

fig, ax = plt.subplots()
ax.text(0.5, 0.8, 'How2matplotlib.com', fontweight='bold', fontsize=16, ha='center')
ax.text(0.5, 0.6, 'Bold and Italic', fontweight='bold', style='italic', ha='center')
ax.text(0.5, 0.4, 'Bold and Underlined', fontweight='bold', ha='center')
ax.text(0.5, 0.4, 'Bold and Underlined', fontweight='bold', ha='center', color='blue')
ax.text(0.5, 0.2, 'Bold with Custom Font', fontweight='bold', fontfamily='serif', ha='center')
plt.axis('off')
plt.show()
Output:
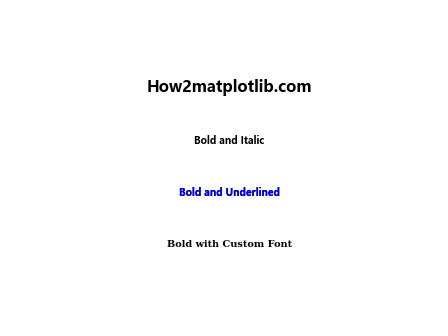
这个例子展示了如何将文本加粗与其他样式属性结合,如字体大小、斜体、下划线、颜色和自定义字体。
4. 在不同类型的图表中应用文本加粗
文本加粗技巧可以应用于各种类型的 Matplotlib 图表中。下面我们将探讨如何在不同类型的图表中有效地使用文本加粗。
4.1 折线图中的文本加粗
折线图是最常见的图表类型之一,适合展示随时间变化的数据趋势。在折线图中,我们可以使用加粗文本来强调重要的数据点或趋势。
import matplotlib.pyplot as plt
import numpy as np

x = np.linspace(0, 10, 100)
y = np.sin(x)

fig, ax = plt.subplots()
ax.plot(x, y)

ax.set_title('How2matplotlib.com: Sin Wave', fontweight='bold')
ax.set_xlabel('X-axis', fontweight='bold')
ax.set_ylabel('Y-axis', fontweight='bold')

ax.text(5, 0.5, 'Peak', fontweight='bold', ha='center', va='bottom')
ax.text(5, -0.5, 'Trough', fontweight='bold', ha='center', va='top')

plt.show()
Output:
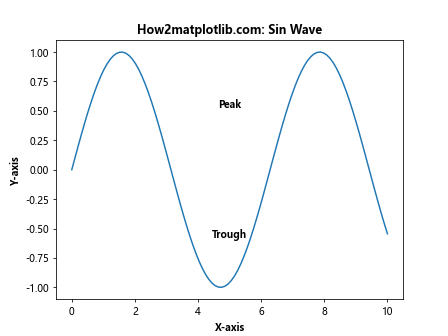
在这个例子中,我们创建了一个正弦波的折线图。我们使用加粗文本来强调图表标题和轴标签,并在图表中添加了加粗的注释来标记波峰和波谷。
4.2 柱状图中的文本加粗
柱状图用于比较不同类别的数据。在柱状图中,我们可以使用加粗文本来强调特定的类别或数值。
import matplotlib.pyplot as plt
import numpy as np

categories = ['A', 'B', 'C', 'D']
values = [3, 7, 2, 5]

fig, ax = plt.subplots()
bars = ax.bar(categories, values)

ax.set_title('How2matplotlib.com: Bar Chart', fontweight='bold')
ax.set_xlabel('Categories', fontweight='bold')
ax.set_ylabel('Values', fontweight='bold')

for i, v in enumerate(values):
    ax.text(i, v, str(v), ha='center', va='bottom', fontweight='bold')

plt.show()
Output:
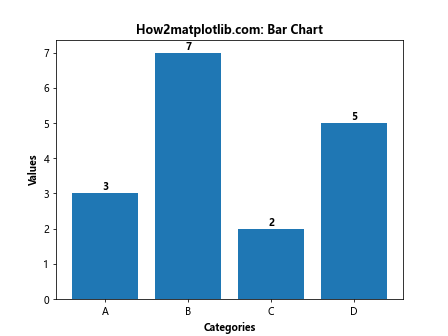
这个例子展示了一个简单的柱状图。我们使用加粗文本来强调图表标题和轴标签,并在每个柱子上方添加了加粗的数值标签。
4.3 散点图中的文本加粗
散点图用于展示两个变量之间的关系。在散点图中,我们可以使用加粗文本来标注特定的数据点或区域。
import matplotlib.pyplot as plt
import numpy as np

x = np.random.rand(50)
y = np.random.rand(50)

fig, ax = plt.subplots()
ax.scatter(x, y)

ax.set_title('How2matplotlib.com: Scatter Plot', fontweight='bold')
ax.set_xlabel('X-axis', fontweight='bold')
ax.set_ylabel('Y-axis', fontweight='bold')

ax.text(0.5, 0.5, 'Cluster', fontweight='bold', ha='center', va='center', bbox=dict(facecolor='white', edgecolor='black'))

plt.show()
Output:
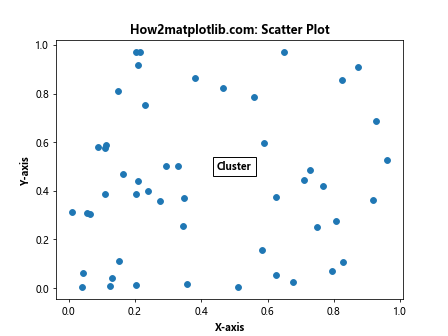
在这个散点图例子中,我们使用加粗文本来强调图表标题和轴标签,并在图表中心添加了一个加粗的文本框来标注一个假设的数据簇。
4.4 饼图中的文本加粗
饼图用于展示部分与整体的关系。在饼图中,我们可以使用加粗文本来强调特定的扇区或标签。
import matplotlib.pyplot as plt

sizes = [30, 25, 20, 15, 10]
labels = ['A', 'B', 'C', 'D', 'E']

fig, ax = plt.subplots()
wedges, texts, autotexts = ax.pie(sizes, labels=labels, autopct='%1.1f%%')

ax.set_title('How2matplotlib.com: Pie Chart', fontweight='bold')

for autotext in autotexts:
    autotext.set_fontweight('bold')

plt.setp(texts, fontweight='bold')

plt.show()
Output:
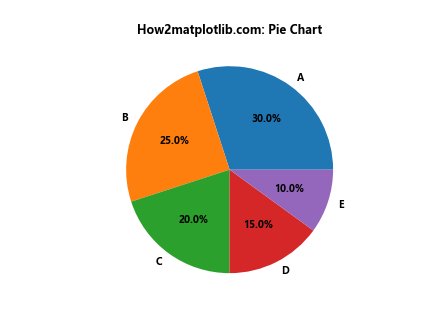
这个饼图例子展示了如何为饼图的标签和百分比文本添加加粗效果。我们使用 set_fontweight 方法和 plt.setp 函数来实现这一效果。
5. 文本加粗的最佳实践
在使用文本加粗时,有一些最佳实践可以帮助我们创建更加清晰、专业的图表。
5.1 适度使用加粗效果
过度使用加粗效果可能会降低其强调作用,甚至使图表看起来杂乱。建议只对最重要的信息使用加粗效果。
import matplotlib.pyplot as plt

fig, (ax1, ax2) = plt.subplots(1, 2, figsize=(12, 5))

# 过度使用加粗
ax1.text(0.5, 0.8, 'How2matplotlib.com', fontweight='bold', ha='center')
ax1.text(0.5, 0.6, 'Too Much Bold', fontweight='bold', ha='center')
ax1.text(0.5, 0.4, 'Makes Everything', fontweight='bold', ha='center')
ax1.text(0.5, 0.2, 'Look the Same', fontweight='bold', ha='center')
ax1.set_title('Overuse of Bold', fontweight='bold')

# 适度使用加粗
ax2.text(0.5, 0.8, 'How2matplotlib.com', fontweight='bold', ha='center')
ax2.text(0.5, 0.6, 'Appropriate Use', ha='center')
ax2.text(0.5, 0.4, 'of Bold Text', ha='center')
ax2.text(0.5, 0.2, 'Enhances Readability', ha='center')
ax2.set_title('Appropriate Use of Bold', fontweight='bold')

for ax in (ax1, ax2):
    ax.axis('off')

plt.show()
Output:
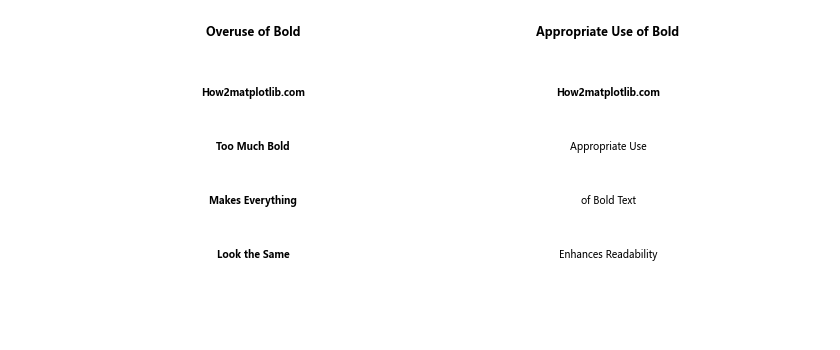
这个例子对比了过度使用和适度使用加粗效果的区别。适度使用加粗可以更好地突出重要信息。
5.2 考虑颜色和背景
在使用加粗文本时,需要考虑文本颜色和背景的对比度,以确保文本清晰可读。
import matplotlib.pyplot as plt

fig, (ax1, ax2) = plt.subplots(1, 2, figsize=(12, 5))

# 低对比度
ax1.set_facecolor('#DDDDDD')
ax1.text(0.5, 0.5, 'How2matplotlib.com\nLow Contrast', fontweight='bold', ha='center', va='center', color='#999999')

# 高对比度
ax2.set_facecolor('#EEEEEE')
ax2.text(0.5, 0.5, 'How2matplotlib.com\nHigh Contrast', fontweight='bold', ha='center', va='center', color='#000000')

for ax in (ax1, ax2):
    ax.axis('off')

plt.show()
Output:

这个例子展示了文本颜色和背景对比度对加粗文本可读性的影响。高对比度可以使加粗文本更加清晰。
5.3 结合其他强调技巧
文本加粗可以与其他强调技巧结合使用,如改变字体大小、使用不同的颜色或添加背景框。
import matplotlib.pyplot as plt

fig, ax = plt.subplots()

ax.text(0.5, 0.8, 'How2matplotlib.com', fontweight='bold', fontsize=16, ha='center')
ax.text(0.5, 0.6, 'Bold and Colored', fontweight='bold', color='red', ha='center')
ax.text(0.5, 0.4, 'Bold with Background', fontweight='bold', ha='center', bbox=dict(facecolor='yellow', alpha=0.5))
ax.text(0.5, 0.2, 'Bold and Large', fontweight='bold', fontsize=20, ha='center')

ax.set_title('Combining Bold with Other Emphasis Techniques', fontweight='bold')
ax.axis('off')

plt.show()
Output:
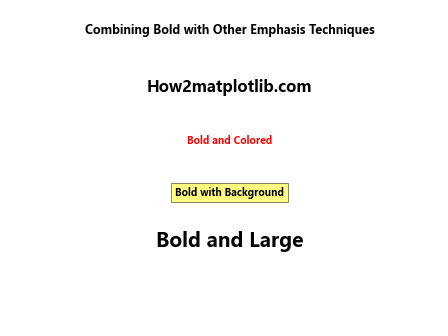
这个例子展示了如何将文本加粗与其他强调技巧结合使用,以创建更加丰富的视觉效果。
6. 处理文本加粗的常见问题
在使用 Matplotlib 进行文本加粗时,可能会遇到一些常见问题。以下是一些问题及其解决方法。
6.1 字体不支持加粗
有时,选择的字体可能不支持加粗样式。在这种情况下,我们可以尝试使用不同的字体或使用其他方法来强调文本。
import matplotlib.pyplot as plt
from matplotlib.font_manager import FontProperties

fig, (ax1, ax2) = plt.subplots(1, 2, figsize=(12, 5))

# 使用不支持加粗的字体
font = FontProperties(family='Comic Sans MS')
ax1.text(0.5, 0.5, 'How2matplotlib.com\nNot Bold', fontproperties=font, ha='center', va='center')
ax1.text(0.5, 0.3, 'How2matplotlib.com\nAttempt Bold', fontproperties=font, fontweight='bold', ha='center', va='center')

# 使用支持加粗的替代字体
ax2.text(0.5, 0.5, 'How2matplotlib.com\nNormal', ha='center', va='center')
ax2.text(0.5, 0.3, 'How2matplotlib.com\nBold', fontweight='bold', ha='center', va='center')

for ax in (ax1, ax2):
    ax.set_title('Font Bold Support', fontweight='bold')
    ax.axis('off')

plt.show()
Output:
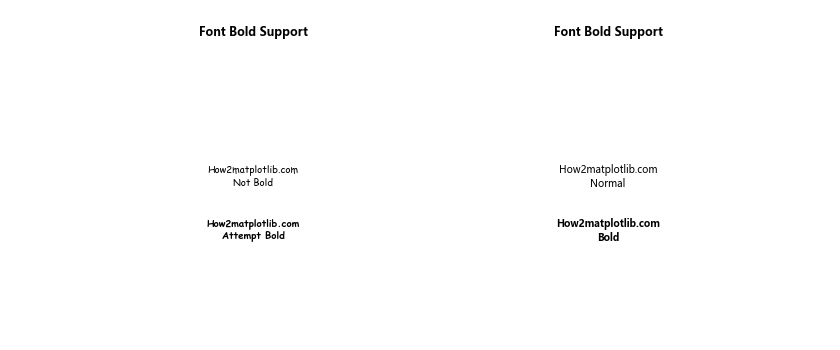
这个例子展示了当使用不支持加粗的字体时可能遇到的问题,以及使用支持加粗的替代字体的效果。
6.2 加粗效果不明显
在某些情况下,加粗效果可能不够明显。这时可以尝试增加字体大小或使用更高的 fontweight 值。
import matplotlib.pyplot as plt

fig, ax = plt.subplots()

ax.text(0.5, 0.8, 'How2matplotlib.com - Normal', ha='center')
ax.text(0.5, 0.6, 'How2matplotlib.com - Bold', fontweight='bold', ha='center')
ax.text(0.5, 0.4, 'How2matplotlib.com - Bolder', fontweight=900, ha='center')
ax.text(0.5, 0.2, 'How2matplotlib.com - Bold and Large', fontweight='bold', fontsize=14, ha='center')

ax.set_title('Increasing Bold Visibility', fontweight='bold')
ax.axis('off')

plt.show()
Output:
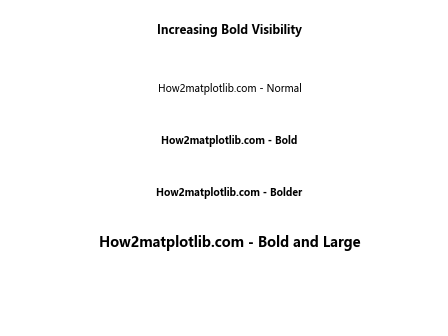
这个例子展示了如何通过增加 fontweight 值和字体大小来使加粗效果更加明显。
6.3 文本重叠
当使用加粗文本时,可能会导致文本重叠或超出图表边界。这时需要调整文本位置或图表布局。
import matplotlib.pyplot as plt

fig, (ax1, ax2) = plt.subplots(1, 2, figsize=(12, 5))

# 文本重叠问题
ax1.plot([1, 2, 3, 4], [1, 4, 2, 3])
ax1.set_title('How2matplotlib.com\nOverlapping Text', fontweight='bold')
ax1.set_xlabel('X-axis', fontweight='bold')
ax1.set_ylabel('Y-axis', fontweight='bold')
ax1.text(2, 3, 'Overlapping\nText', fontweight='bold', ha='center', va='center')

# 解决文本重叠
ax2.plot([1, 2, 3, 4], [1, 4, 2, 3])
ax2.set_title('How2matplotlib.com\nAdjusted Text', fontweight='bold')
ax2.set_xlabel('X-axis', fontweight='bold')
ax2.set_ylabel('Y-axis', fontweight='bold')
ax2.text(2, 3, 'Adjusted\nText', fontweight='bold', ha='center', va='center', bbox=dict(facecolor='white', edgecolor='none', alpha=0.7))

plt.tight_layout()
plt.show()
Output:
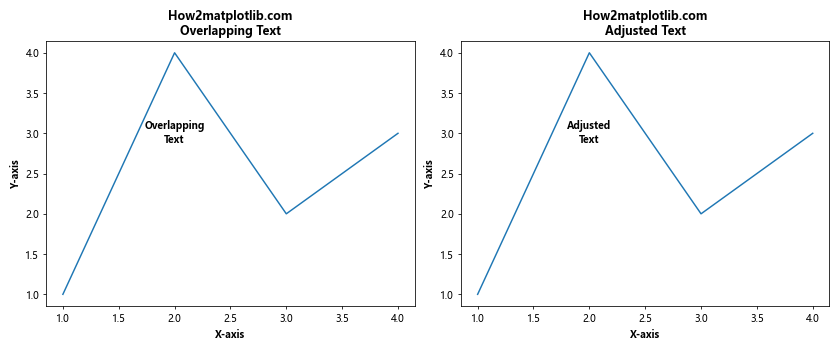
这个例子展示了文本重叠的问题,以及如何通过添加背景框和调整布局来解决这个问题。
总结
文本加粗是 Matplotlib 中一个简单但强大的功能,可以有效地强调图表中的重要信息。通过本文的详细介绍,我们了解了如何在各种场景下使用文本加粗技巧,包括基本方法、高级技巧、在不同类型图表中的应用,以及一些最佳实践和常见问题的解决方法。
正确使用文本加粗可以显著提高图表的可读性和信息传达效果。然而,重要的是要记住适度使用加粗效果,并将其与其他视觉元素和设计原则相结合,以创建既美观又信息丰富的数据可视化作品。
通过实践和经验,你将能够熟练运用这些技巧,创造出既专业又富有吸引力的 Matplotlib 图表。无论是用于学术研究、商业报告还是数据新闻,掌握文本加粗技巧都将成为你数据可视化工具箱中的一个有力武器。
 极客笔记
极客笔记