Matplotlib饼图:全面掌握数据可视化利器
Matplotlib是Python中最流行的数据可视化库之一,而饼图则是展示数据占比关系的重要图表类型。本文将全面介绍如何使用Matplotlib创建各种类型的饼图,从基础到进阶,帮助您掌握这一强大的数据可视化工具。
1. 基础饼图绘制
首先,让我们从最基本的饼图开始。Matplotlib提供了pie()函数来创建饼图。以下是一个简单的示例:
import matplotlib.pyplot as plt

# 数据
sizes = [30, 25, 20, 15, 10]
labels = ['A', 'B', 'C', 'D', 'E']

# 创建饼图
plt.pie(sizes, labels=labels, autopct='%1.1f%%')
plt.title('Basic Pie Chart - how2matplotlib.com')
plt.axis('equal')  # 确保饼图是圆的
plt.show()
Output:
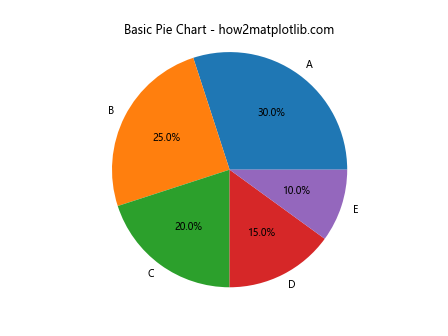
在这个例子中,我们定义了数据大小和对应的标签。pie()函数接受这些数据作为参数,autopct参数用于在每个扇区显示百分比。axis('equal')确保饼图是圆形的,而不是椭圆形。
2. 自定义颜色和样式
Matplotlib允许我们自定义饼图的颜色和样式,使其更具吸引力和信息量。
import matplotlib.pyplot as plt

sizes = [30, 25, 20, 15, 10]
labels = ['A', 'B', 'C', 'D', 'E']
colors = ['#ff9999', '#66b3ff', '#99ff99', '#ffcc99', '#ff99cc']
explode = (0.1, 0, 0, 0, 0)  # 突出第一个扇区

plt.pie(sizes, explode=explode, labels=labels, colors=colors, autopct='%1.1f%%', shadow=True, startangle=90)
plt.title('Customized Pie Chart - how2matplotlib.com')
plt.axis('equal')
plt.show()
Output:
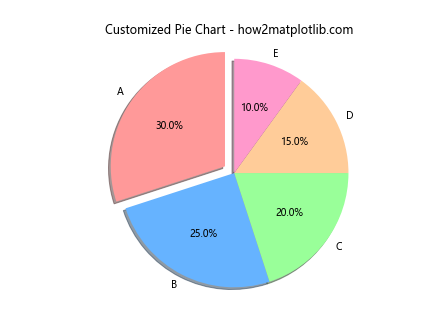
在这个例子中,我们添加了自定义颜色、突出显示(explode)第一个扇区、添加阴影效果,并设置了起始角度。这些细节可以使饼图更加生动和易读。
3. 添加图例
对于复杂的数据集,添加图例可以提高饼图的可读性。
import matplotlib.pyplot as plt

sizes = [30, 25, 20, 15, 10]
labels = ['Category A', 'Category B', 'Category C', 'Category D', 'Category E']
colors = ['#ff9999', '#66b3ff', '#99ff99', '#ffcc99', '#ff99cc']

plt.pie(sizes, labels=labels, colors=colors, autopct='%1.1f%%', startangle=90)
plt.title('Pie Chart with Legend - how2matplotlib.com')
plt.axis('equal')
plt.legend(title="Categories", loc="center left", bbox_to_anchor=(1, 0, 0.5, 1))
plt.show()
Output:
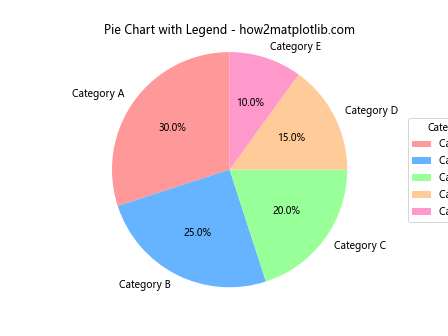
这里我们使用plt.legend()函数添加了图例。bbox_to_anchor参数用于调整图例的位置,使其位于饼图的右侧。
4. 嵌套饼图
嵌套饼图可以展示更复杂的层次关系数据。
import matplotlib.pyplot as plt

# 外圈数据
sizes_outer = [40, 30, 30]
labels_outer = ['Group A', 'Group B', 'Group C']
colors_outer = ['#ff9999', '#66b3ff', '#99ff99']

# 内圈数据
sizes_inner = [15, 25, 35, 25]
labels_inner = ['A1', 'A2', 'B', 'C']
colors_inner = ['#ff9999', '#ffcc99', '#66b3ff', '#99ff99']

fig, ax = plt.subplots()

ax.pie(sizes_outer, labels=labels_outer, colors=colors_outer, autopct='%1.1f%%', radius=1.2, wedgeprops=dict(width=0.3, edgecolor='white'))
ax.pie(sizes_inner, labels=labels_inner, colors=colors_inner, autopct='%1.1f%%', radius=0.9, wedgeprops=dict(width=0.4, edgecolor='white'))

plt.title('Nested Pie Chart - how2matplotlib.com')
plt.axis('equal')
plt.show()
Output:
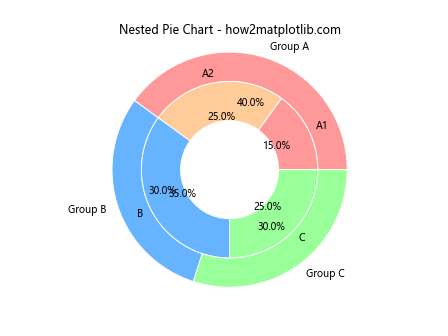
这个例子创建了一个嵌套饼图,外圈显示主要分组,内圈显示子分组。通过调整radius和wedgeprops参数,我们可以控制两个饼图的大小和间距。
5. 半圆饼图
有时,使用半圆形的饼图可以为布局提供更多空间或创造独特的视觉效果。
import matplotlib.pyplot as plt

sizes = [30, 25, 20, 15, 10]
labels = ['A', 'B', 'C', 'D', 'E']
colors = ['#ff9999', '#66b3ff', '#99ff99', '#ffcc99', '#ff99cc']

plt.pie(sizes, labels=labels, colors=colors, autopct='%1.1f%%', startangle=90, counterclock=False)
plt.title('Half Pie Chart - how2matplotlib.com')
plt.axis('equal')
plt.ylim(-1, 1)  # 限制y轴范围以创建半圆效果
plt.show()
Output:
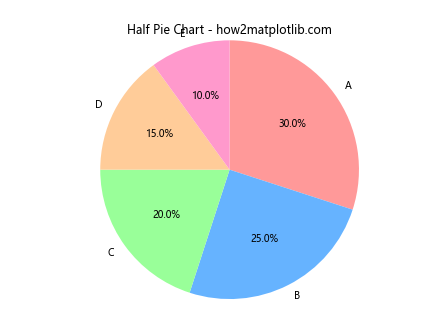
通过设置startangle=90和counterclock=False,我们可以创建一个从右侧开始的半圆饼图。plt.ylim(-1, 1)用于限制y轴范围,从而切掉下半部分。
6. 动态饼图
对于需要频繁更新的数据,我们可以创建动态饼图。
import matplotlib.pyplot as plt
import numpy as np
from matplotlib.animation import FuncAnimation

fig, ax = plt.subplots()

def update(frame):
    ax.clear()
    sizes = np.random.randint(1, 100, 5)
    labels = ['A', 'B', 'C', 'D', 'E']
    ax.pie(sizes, labels=labels, autopct='%1.1f%%')
    ax.set_title(f'Dynamic Pie Chart - Frame {frame} - how2matplotlib.com')
    ax.axis('equal')

ani = FuncAnimation(fig, update, frames=range(50), repeat=False)
plt.show()
Output:
这个例子使用FuncAnimation创建了一个动态饼图,每帧都会更新数据。这对于展示实时变化的数据非常有用。
7. 带有子图的饼图
有时我们需要在一个图表中展示多个饼图,这时可以使用子图功能。
import matplotlib.pyplot as plt

fig, (ax1, ax2) = plt.subplots(1, 2, figsize=(12, 6))

# 第一个饼图
sizes1 = [30, 70]
labels1 = ['Category A', 'Category B']
ax1.pie(sizes1, labels=labels1, autopct='%1.1f%%', startangle=90)
ax1.set_title('Pie Chart 1 - how2matplotlib.com')

# 第二个饼图
sizes2 = [40, 30, 30]
labels2 = ['X', 'Y', 'Z']
ax2.pie(sizes2, labels=labels2, autopct='%1.1f%%', startangle=90)
ax2.set_title('Pie Chart 2 - how2matplotlib.com')

plt.tight_layout()
plt.show()
Output:
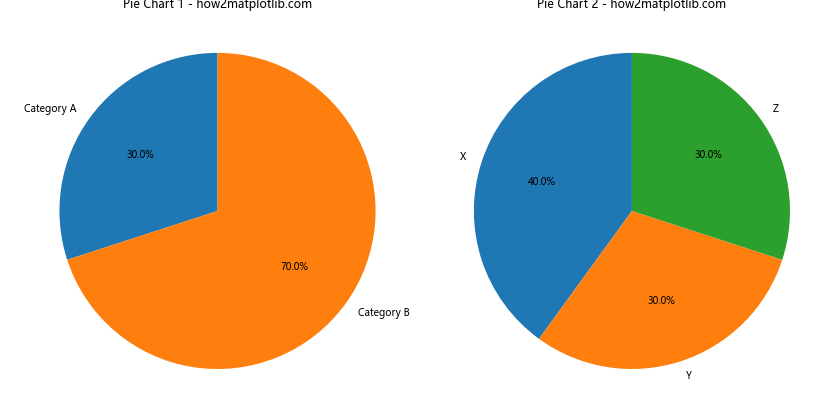
这个例子创建了两个并排的饼图,每个饼图显示不同的数据集。这种布局适合比较不同类别或时间点的数据分布。
8. 带有文本注释的饼图
有时,我们需要在饼图上添加额外的文本信息来解释数据或突出重要点。
import matplotlib.pyplot as plt

sizes = [30, 25, 20, 15, 10]
labels = ['A', 'B', 'C', 'D', 'E']
colors = ['#ff9999', '#66b3ff', '#99ff99', '#ffcc99', '#ff99cc']

fig, ax = plt.subplots()

wedges, texts, autotexts = ax.pie(sizes, labels=labels, colors=colors, autopct='%1.1f%%', startangle=90)

ax.text(0.5, 1.05, 'Pie Chart with Annotations - how2matplotlib.com', transform=ax.transAxes, ha='center')
ax.text(-1.2, 0.5, 'This is an\nadditional note', transform=ax.transAxes, va='center')

plt.setp(autotexts, size=8, weight="bold")
ax.axis('equal')
plt.show()
Output:
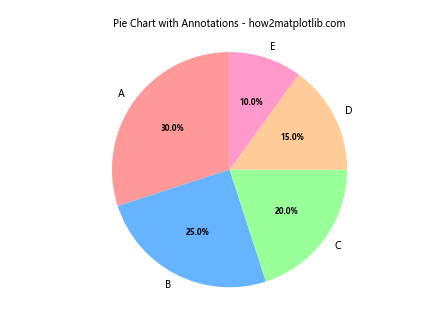
在这个例子中,我们使用ax.text()方法添加了标题和额外的注释。transform=ax.transAxes参数确保文本位置相对于轴的大小进行调整。
9. 带有数据标签的饼图
有时,我们可能想在饼图的每个扇区外显示具体的数值,而不仅仅是百分比。
import matplotlib.pyplot as plt

sizes = [30, 25, 20, 15, 10]
labels = ['A', 'B', 'C', 'D', 'E']
colors = ['#ff9999', '#66b3ff', '#99ff99', '#ffcc99', '#ff99cc']

fig, ax = plt.subplots()

wedges, texts, autotexts = ax.pie(sizes, labels=labels, colors=colors, autopct='%1.1f%%', startangle=90)

for i, autotext in enumerate(autotexts):
    autotext.set_text(f'{sizes[i]} ({autotext.get_text()})')

ax.set_title('Pie Chart with Data Labels - how2matplotlib.com')
ax.axis('equal')
plt.show()
Output:
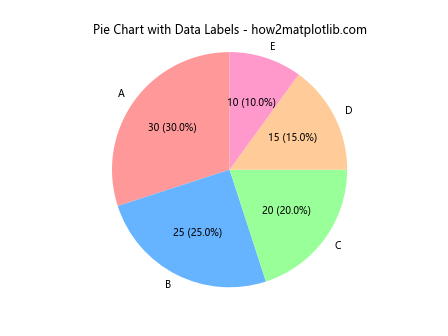
在这个例子中,我们遍历autotexts并修改每个文本标签,使其同时显示实际数值和百分比。
10. 带有阈值的饼图
有时,我们可能想要突出显示超过某个阈值的扇区,而将其他小扇区合并为”其他”类别。
import matplotlib.pyplot as plt

sizes = [30, 25, 20, 15, 5, 3, 2]
labels = ['A', 'B', 'C', 'D', 'E', 'F', 'G']
colors = ['#ff9999', '#66b3ff', '#99ff99', '#ffcc99', '#ff99cc', '#99ccff', '#ffcc99']

# 设置阈值
threshold = 10

# 处理数据
sizes_filtered = [size if size >= threshold else 0 for size in sizes]
other = sum(size for size in sizes if size < threshold)
sizes_filtered.append(other)

labels_filtered = [label if size >= threshold else '' for label, size in zip(labels, sizes)]
labels_filtered.append('Other')

colors_filtered = [color if size >= threshold else '' for color, size in zip(colors, sizes)]
colors_filtered.append('#DDDDDD')

# 移除空字符串
sizes_filtered = [s for s in sizes_filtered if s != 0]
labels_filtered = [l for l in labels_filtered if l != '']
colors_filtered = [c for c in colors_filtered if c != '']

plt.pie(sizes_filtered, labels=labels_filtered, colors=colors_filtered, autopct='%1.1f%%', startangle=90)
plt.title('Pie Chart with Threshold - how2matplotlib.com')
plt.axis('equal')
plt.show()
Output:
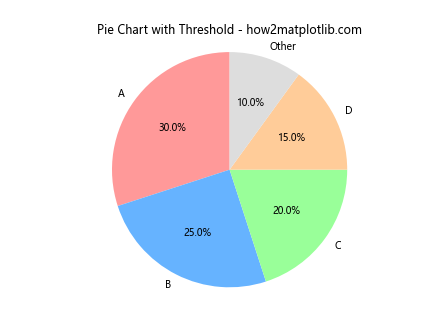
这个例子设置了一个阈值,将小于阈值的扇区合并为”其他”类别。这种方法可以使饼图更加清晰,避免过多的小扇区影响图表的可读性。
11. 带有渐变色的饼图
为了使饼图更具视觉吸引力,我们可以使用颜色渐变效果。
import matplotlib.pyplot as plt
import matplotlib.colors as mcolors

sizes = [30, 25, 20, 15, 10]
labels = ['A', 'B', 'C', 'D', 'E']

# 创建渐变色
cmap = plt.get_cmap("coolwarm")
colors = [cmap(i/len(sizes)) for i in range(len(sizes))]

fig, ax = plt.subplots()

wedges, texts, autotexts = ax.pie(sizes, labels=labels, colors=colors, autopct='%1.1f%%', startangle=90)

# 添加渐变效果
for w in wedges:
    w.set_alpha(0.7)

ax.set_title('Gradient Color Pie Chart - how2matplotlib.com')
ax.axis('equal')
plt.show()
Output:
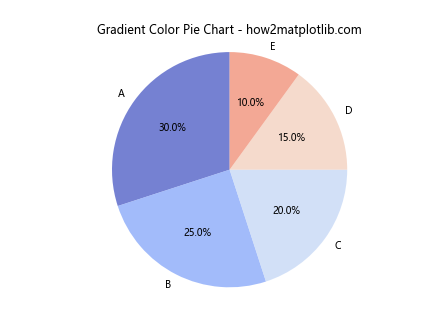
在这个例子中,我们使用plt.get_cmap()获取一个颜色映射,然后为每个扇区分配一个渐变色。通过设置alpha值,我们还增加了一些透明度,使颜色看起来更柔和。
12. 带有图像纹理的饼图
为了创造独特的视觉效果,我们可以在饼图的扇区中填充图像纹理。
import matplotlib.pyplot as plt
import numpy as np

def create_texture(pattern):
    return np.array([int(c) for c in pattern.replace(" ", "")])

sizes = [30, 25, 20, 15, 10]
labels = ['A', 'B', 'C', 'D', 'E']

patterns = [
    "1 1 0 1 1 0 0 0",
    "1 0 1 0 1 0 1 0",
    "0 1 1 1 0 1 1 1",
    "1 1 1 1 0 0 0 0",
    "1 0 0 1 0 0 1 0"
]

textures = [create_texture(pattern).reshape(4, 2) for pattern in patterns]

fig, ax = plt.subplots()

wedges, texts, autotexts = ax.pie(sizes, labels=labels, autopct='%1.1f%%', startangle=90)

for wedge, texture in zip(wedges, textures):
    wedge.set_hatch(texture)
    wedge.set_facecolor('none')
    wedge.set_edgecolor('black')

ax.set_title('Textured Pie Chart - how2matplotlib.com')
ax.axis('equal')
plt.show()
在这个例子中,我们为每个扇区创建了一个简单的二进制纹理模式。通过设置hatch属性,我们可以将这些纹理应用到饼图的扇区中。这种方法可以在不使用颜色的情况下区分不同的扇区,对于黑白打印特别有用。
13. 带有动态标签位置的饼图
有时,当扇区很小时,标签可能会重叠或难以阅读。我们可以创建一个函数来动态调整标签的位置。
import matplotlib.pyplot as plt

def adjust_labels(texts, autotexts):
    for text, autotext in zip(texts, autotexts):
        x, y = text.get_position()
        if y > 0:  # 上半部分的标签
            text.set_verticalalignment('bottom')
        else:  # 下半部分的标签
            text.set_verticalalignment('top')
        autotext.set_position((x, 0.8*y))

sizes = [30, 25, 20, 15, 5, 3, 2]
labels = ['A', 'B', 'C', 'D', 'E', 'F', 'G']

fig, ax = plt.subplots()

wedges, texts, autotexts = ax.pie(sizes, labels=labels, autopct='%1.1f%%', startangle=90)

adjust_labels(texts, autotexts)

ax.set_title('Pie Chart with Adjusted Labels - how2matplotlib.com')
ax.axis('equal')
plt.show()
Output:
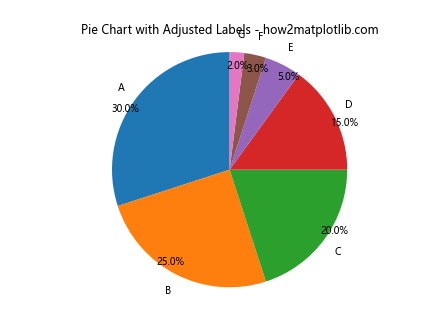
这个例子中的adjust_labels函数根据标签的位置调整其垂直对齐方式,并稍微移动百分比标签,以避免与主标签重叠。这种方法可以显著提高饼图的可读性,特别是当有多个小扇区时。
14. 3D饼图
虽然通常不推荐使用3D效果(因为它可能会扭曲数据的感知),但在某些情况下,3D饼图可以创造有趣的视觉效果。
import matplotlib.pyplot as plt
import numpy as np

sizes = [30, 25, 20, 15, 10]
labels = ['A', 'B', 'C', 'D', 'E']
colors = ['#ff9999', '#66b3ff', '#99ff99', '#ffcc99', '#ff99cc']

fig = plt.figure(figsize=(10, 8))
ax = fig.add_subplot(111, projection='3d')

def pie3d(sizes, labels, colors, angle):
    start_angle = 0
    for size, label, color in zip(sizes, labels, colors):
        end_angle = start_angle + size/sum(sizes) * 360
        x = [0] + np.cos(np.radians(np.linspace(start_angle, end_angle, 100))).tolist()
        y = [0] + np.sin(np.radians(np.linspace(start_angle, end_angle, 100))).tolist()
        z = np.zeros(101)
        ax.plot_surface(np.array([x, x]), np.array([y, y]), np.array([z, z+0.5]), color=color)
        ax.text(np.cos(np.radians((start_angle+end_angle)/2))*0.7,
                np.sin(np.radians((start_angle+end_angle)/2))*0.7,
                0.5, label, ha='center', va='center')
        start_angle = end_angle

pie3d(sizes, labels, colors, angle=45)

ax.set_xlim(-1, 1)
ax.set_ylim(-1, 1)
ax.set_zlim(0, 1)
ax.set_title('3D Pie Chart - how2matplotlib.com')
ax.set_axis_off()
plt.show()
Output:
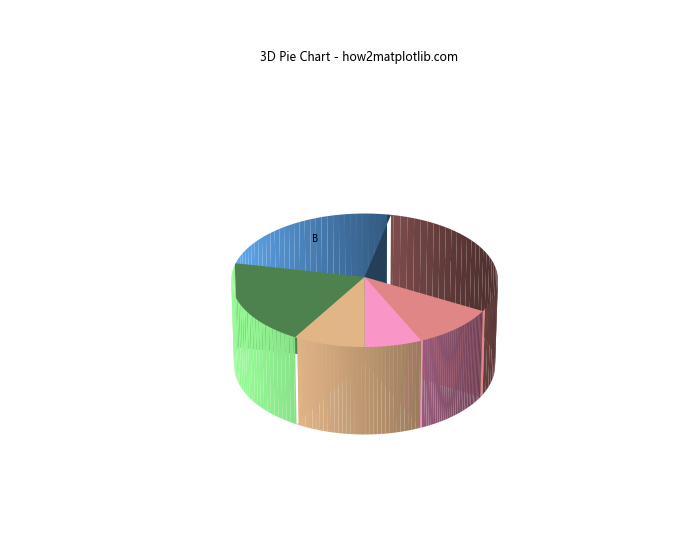
这个例子创建了一个简单的3D饼图。通过使用Matplotlib的3D功能,我们可以绘制具有厚度的饼图扇区。这种图表可以用于特殊的展示场合,但在日常数据分析中应谨慎使用。
15. 带有突出效果的饼图
为了强调某个特定的扇区,我们可以创建一个带有”爆炸”效果的饼图。
import matplotlib.pyplot as plt

sizes = [30, 25, 20, 15, 10]
labels = ['A', 'B', 'C', 'D', 'E']
colors = ['#ff9999', '#66b3ff', '#99ff99', '#ffcc99', '#ff99cc']
explode = (0.1, 0, 0, 0, 0)  # 突出第一个扇区

fig, ax = plt.subplots()

wedges, texts, autotexts = ax.pie(sizes, explode=explode, labels=labels, colors=colors,
                                  autopct='%1.1f%%', startangle=90,
                                  wedgeprops=dict(width=0.7, edgecolor='white'))

# 添加阴影效果
for wedge in wedges:
    wedge.set_path_effects([plt.patheffects.withSimplePatchShadow()])

ax.set_title('Exploded Pie Chart with Shadow - how2matplotlib.com')
ax.axis('equal')
plt.show()
在这个例子中,我们使用explode参数来突出显示第一个扇区。此外,我们还为每个扇区添加了简单的阴影效果,使图表看起来更加立体。这种技术可以用来强调特定的数据点或类别。
结论
通过本文的详细介绍和丰富的示例,我们全面探讨了使用Matplotlib创建各种类型饼图的方法。从基础的饼图绘制到高级的自定义技巧,这些知识将帮助您更好地展示和分析数据中的比例关系。
饼图是一种强大的数据可视化工具,但也需要谨慎使用。在选择使用饼图时,请考虑以下几点:
- 数据类型:饼图最适合展示构成整体的各部分比例,特别是当这些部分加起来等于100%时。
-
数据数量:通常建议饼图中的扇区不要超过5-7个,否则可能会影响可读性。
-
数据差异:如果各部分的大小差异很小,可能难以在饼图中直观地看出差别。
-
时间趋势:饼图不适合展示随时间变化的趋势,这种情况下可能需要考虑其他图表类型。
-
准确性:虽然饼图直观,但人眼难以准确判断角度和面积的微小差异,因此在需要精确比较时,可能需要配合数字标签或考虑使用条形图。
通过合理使用本文介绍的各种技巧,您可以创建既美观又信息丰富的饼图,有效地传达数据中的关键信息。记住,最好的数据可视化不仅仅是美观的图表,更重要的是能够清晰、准确地传达数据背后的故事。
 极客笔记
极客笔记