Matplotlib散点图绘制详解
参考:matplotlib scatter plot example
matplotlib scatter plot example
Matplotlib是Python中最流行的数据可视化库之一,它提供了强大而灵活的绘图功能。在数据分析和科学计算中,散点图是一种常用的可视化工具,用于展示两个变量之间的关系。本文将深入探讨如何使用Matplotlib绘制各种类型的散点图,从基础到高级,涵盖了多种自定义选项和技巧。
1. 基础散点图
让我们从最基本的散点图开始。散点图用于显示两个数值变量之间的关系,每个点代表一个观察值。
import matplotlib.pyplot as plt
import numpy as np

# 生成随机数据
np.random.seed(42)
x = np.random.rand(50)
y = np.random.rand(50)

# 创建散点图
plt.figure(figsize=(10, 6))
plt.scatter(x, y)

# 添加标题和轴标签
plt.title('Basic Scatter Plot - how2matplotlib.com')
plt.xlabel('X-axis')
plt.ylabel('Y-axis')

# 显示图形
plt.show()

# 打印输出结果
print("Scatter plot has been displayed.")
Output:
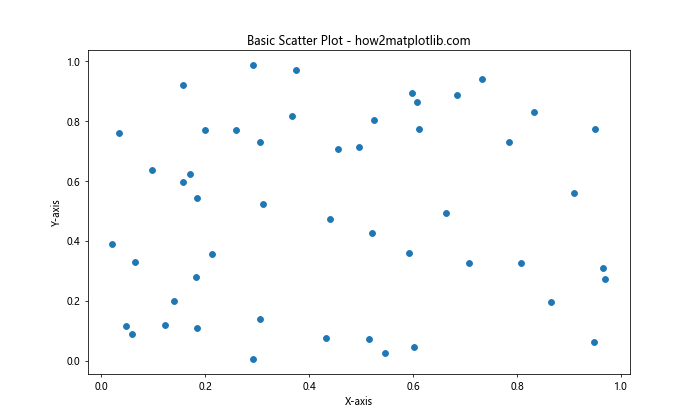
在这个例子中,我们首先导入了必要的库:Matplotlib的pyplot模块和NumPy。然后,我们使用NumPy的random模块生成了50个随机数据点。plt.scatter()函数用于创建散点图,其中x和y分别是点的x坐标和y坐标。我们还设置了图形大小、标题和轴标签,最后使用plt.show()显示图形。
2. 自定义点的颜色和大小
散点图的一个强大特性是可以通过点的颜色和大小来表示额外的信息维度。
import matplotlib.pyplot as plt
import numpy as np

# 生成数据
np.random.seed(42)
x = np.random.rand(100)
y = np.random.rand(100)
colors = np.random.rand(100)
sizes = 1000 * np.random.rand(100)

# 创建散点图
plt.figure(figsize=(10, 8))
plt.scatter(x, y, c=colors, s=sizes, alpha=0.5, cmap='viridis')

# 添加颜色条
plt.colorbar()

# 设置标题和轴标签
plt.title('Customized Scatter Plot - how2matplotlib.com')
plt.xlabel('X-axis')
plt.ylabel('Y-axis')

# 显示图形
plt.show()

# 打印输出结果
print("Customized scatter plot has been displayed.")
Output:
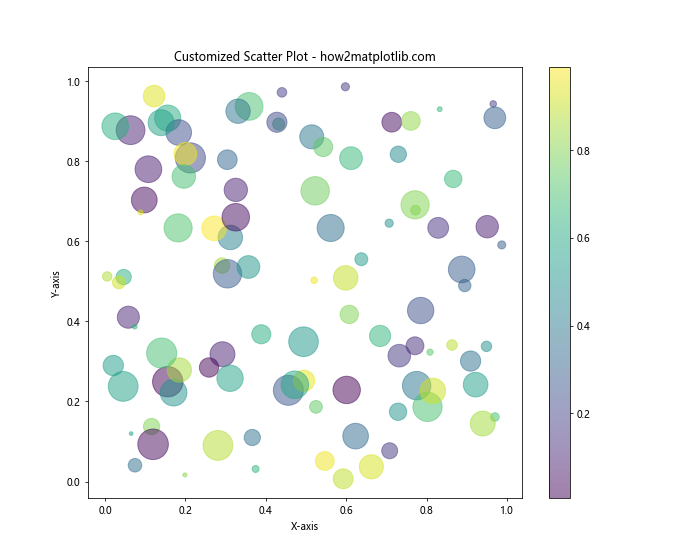
在这个例子中,我们通过以下方式自定义了散点图:
c=colors:设置点的颜色,这里使用了随机生成的颜色值。s=sizes:设置点的大小,这里使用了随机生成的大小值。alpha=0.5:设置点的透明度。cmap='viridis':设置颜色映射。
我们还添加了一个颜色条(colorbar),以显示颜色所代表的值的范围。
3. 使用分类数据
散点图不仅可以用于连续数据,还可以用于分类数据。
import matplotlib.pyplot as plt
import numpy as np

# 生成数据
np.random.seed(42)
n_categories = 4
n_points = 50
categories = np.random.randint(0, n_categories, n_points)
x = np.random.randn(n_points)
y = np.random.randn(n_points)

# 创建散点图
plt.figure(figsize=(10, 8))
scatter = plt.scatter(x, y, c=categories, cmap='Set1')

# 添加图例
plt.legend(*scatter.legend_elements(), title="Categories")

# 设置标题和轴标签
plt.title('Categorical Scatter Plot - how2matplotlib.com')
plt.xlabel('X-axis')
plt.ylabel('Y-axis')

# 显示图形
plt.show()

# 打印输出结果
print("Categorical scatter plot has been displayed.")
Output:
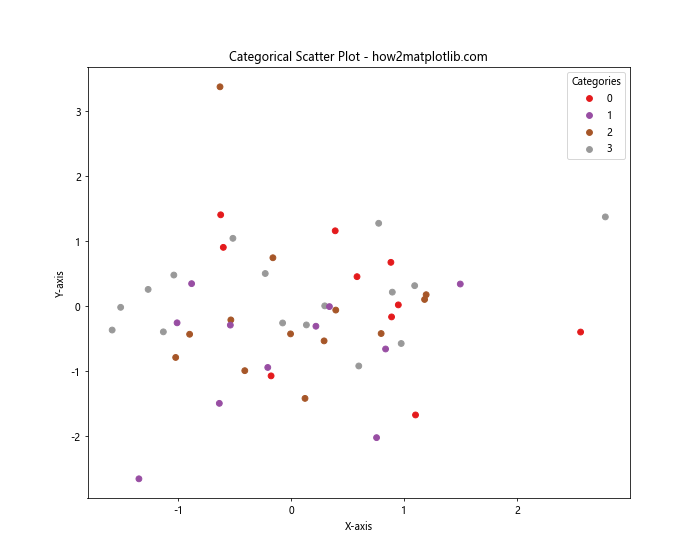
在这个例子中,我们生成了属于不同类别的随机数据点。plt.scatter()函数的c参数用于指定每个点的类别。我们使用scatter.legend_elements()方法自动生成图例,显示每个类别对应的颜色。
4. 添加误差线
在某些情况下,我们可能需要在散点图上显示误差范围。Matplotlib提供了errorbar()函数来实现这一功能。
import matplotlib.pyplot as plt
import numpy as np

# 生成数据
np.random.seed(42)
x = np.linspace(0, 10, 20)
y = 2 * x + 1 + np.random.randn(20)
yerr = 0.5 + 0.5 * np.random.rand(20)

# 创建带误差线的散点图
plt.figure(figsize=(10, 6))
plt.errorbar(x, y, yerr=yerr, fmt='o', capsize=5, capthick=2)

# 设置标题和轴标签
plt.title('Scatter Plot with Error Bars - how2matplotlib.com')
plt.xlabel('X-axis')
plt.ylabel('Y-axis')

# 显示图形
plt.show()

# 打印输出结果
print("Scatter plot with error bars has been displayed.")
Output:
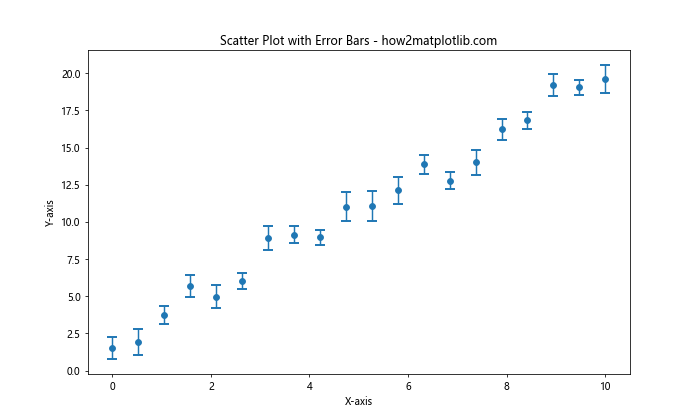
在这个例子中:
errorbar()函数用于创建带误差线的散点图。yerr参数指定了y方向的误差值。fmt='o'设置数据点的样式为圆点。capsize和capthick分别设置误差线端点的大小和粗细。
5. 3D散点图
Matplotlib还支持创建3D散点图,这对于可视化三维数据非常有用。
import matplotlib.pyplot as plt
from mpl_toolkits.mplot3d import Axes3D
import numpy as np

# 生成数据
np.random.seed(42)
n = 100
x = np.random.rand(n)
y = np.random.rand(n)
z = np.random.rand(n)
colors = np.random.rand(n)
sizes = 1000 * np.random.rand(n)

# 创建3D散点图
fig = plt.figure(figsize=(10, 8))
ax = fig.add_subplot(111, projection='3d')
scatter = ax.scatter(x, y, z, c=colors, s=sizes, alpha=0.6, cmap='viridis')

# 添加颜色条
plt.colorbar(scatter)

# 设置标题和轴标签
ax.set_title('3D Scatter Plot - how2matplotlib.com')
ax.set_xlabel('X-axis')
ax.set_ylabel('Y-axis')
ax.set_zlabel('Z-axis')

# 显示图形
plt.show()

# 打印输出结果
print("3D scatter plot has been displayed.")
Output:
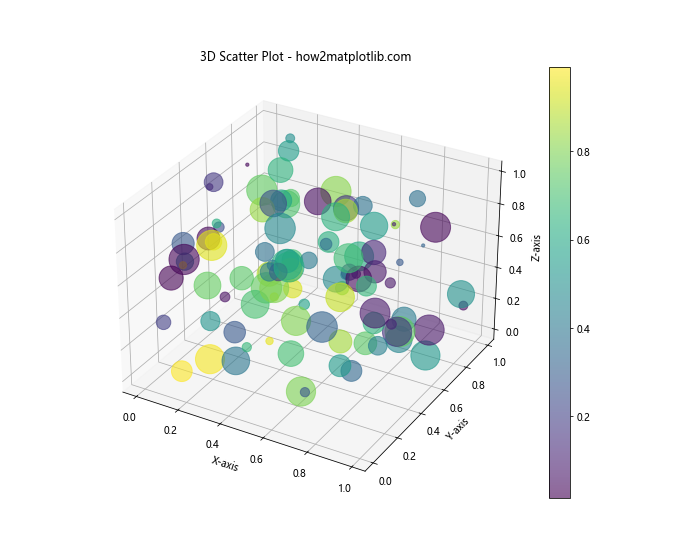
在这个例子中,我们使用了mpl_toolkits.mplot3d模块来创建3D图形。fig.add_subplot(111, projection='3d')创建了一个3D坐标系,然后我们使用ax.scatter()函数在3D空间中绘制散点。
6. 气泡图
气泡图是散点图的一种变体,其中点的大小用于表示第三个变量。
import matplotlib.pyplot as plt
import numpy as np

# 生成数据
np.random.seed(42)
n = 50
x = np.random.rand(n)
y = np.random.rand(n)
sizes = 1000 * np.random.rand(n)
colors = np.random.rand(n)

# 创建气泡图
plt.figure(figsize=(10, 8))
scatter = plt.scatter(x, y, s=sizes, c=colors, alpha=0.6, cmap='viridis')

# 添加颜色条
plt.colorbar(scatter)

# 设置标题和轴标签
plt.title('Bubble Chart - how2matplotlib.com')
plt.xlabel('X-axis')
plt.ylabel('Y-axis')

# 显示图形
plt.show()

# 打印输出结果
print("Bubble chart has been displayed.")
Output:
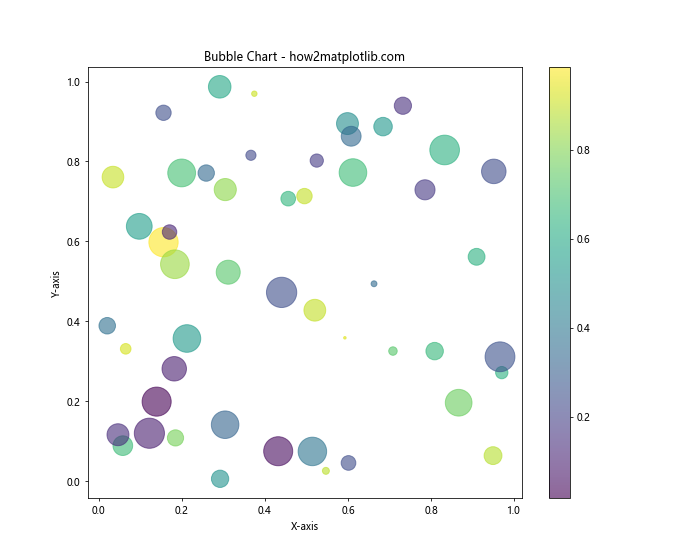
在这个气泡图中,点的大小由sizes变量决定,颜色由colors变量决定。这允许我们在二维平面上同时展示四个变量的关系。
7. 散点图矩阵
当我们需要同时查看多个变量之间的关系时,散点图矩阵非常有用。
import matplotlib.pyplot as plt
import numpy as np
import pandas as pd
from pandas.plotting import scatter_matrix

# 生成数据
np.random.seed(42)
n = 100
data = {
    'A': np.random.randn(n),
    'B': np.random.randn(n),
    'C': np.random.randn(n),
    'D': np.random.randn(n)
}
df = pd.DataFrame(data)

# 创建散点图矩阵
fig, ax = plt.subplots(figsize=(12, 10))
scatter_matrix(df, alpha=0.8, diagonal='hist', ax=ax)

# 设置总标题
fig.suptitle('Scatter Plot Matrix - how2matplotlib.com', fontsize=16)

# 调整布局
plt.tight_layout()
plt.subplots_adjust(top=0.95)

# 显示图形
plt.show()

# 打印输出结果
print("Scatter plot matrix has been displayed.")
在这个例子中,我们使用了Pandas的scatter_matrix()函数来创建散点图矩阵。这个函数自动为数据框中的每对变量创建散点图,并在对角线上显示每个变量的直方图。
8. 带边界的散点图
有时我们可能想要在散点图上添加一些边界或区域。这可以通过组合散点图和其他类型的图形来实现。
import matplotlib.pyplot as plt
import numpy as np

# 生成数据
np.random.seed(42)
n = 100
x = np.random.randn(n)
y = 2*x + 1 + np.random.randn(n)

# 创建散点图
plt.figure(figsize=(10, 8))
plt.scatter(x, y, alpha=0.6)

# 添加线性回归线
z = np.polyfit(x, y, 1)
p = np.poly1d(z)
plt.plot(x, p(x), "r--")

# 添加置信区间
from scipy import stats
slope, intercept, r_value, p_value, std_err = stats.linregress(x, y)
predict_y = intercept + slope * x
pi = 0.95
n = len(x)
se = np.sqrt(sum((y - predict_y) ** 2) / (n-2))
t = stats.t.ppf((1 + pi) / 2, n - 2)
ci = t * se * np.sqrt(1/n + (x - np.mean(x))**2 / np.sum((x - np.mean(x))**2))
plt.fill_between(x, predict_y - ci, predict_y + ci, color="gray", alpha=0.2)

# 设置标题和轴标签
plt.title('Scatter Plot with Regression Line and Confidence Interval - how2matplotlib.com')
plt.xlabel('X-axis')
plt.ylabel('Y-axis')

# 显示图形
plt.show()

# 打印输出结果
print("Scatter plot with regression line and confidence interval has been displayed.")
Output:
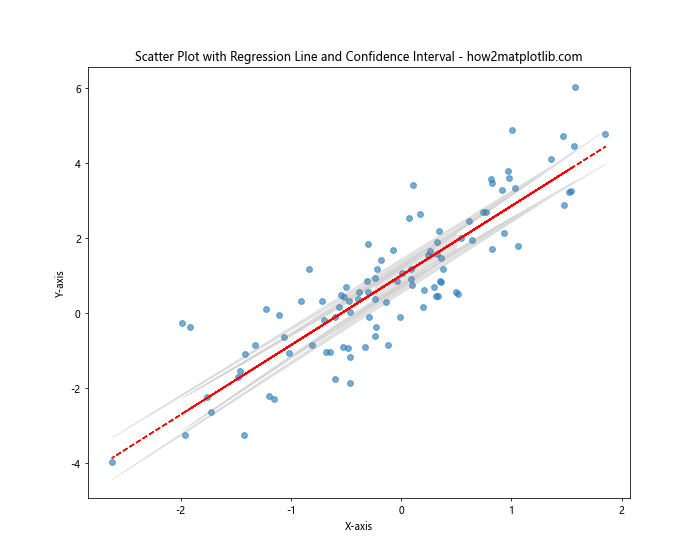
在这个例子中,我们不仅绘制了散点图,还添加了一条线性回归线和置信区间。回归线使用NumPy的polyfit()和poly1d()函数计算,置信区间使用SciPy的stats模块计算。
9. 带标记的散点图
有时我们可能想要在散点图上标记特定的点。这可以通过使用annotate()函数来实现。
import matplotlib.pyplot as plt
import numpy as np

# 生成数据
np.random.seed(42)
n = 50
x = np.random.rand(n)
y = np.random.rand(n)

# 创建散点图
plt.figure(figsize=(10, 8))
plt.scatter(x, y)

# 标记特定点
for i in range(5):
    plt.annotate(f'Point {i+1}', (x[i], y[i]), xytext=(5, 5), textcoords='offset points')

# 设置标题和轴标签
plt.title('Scatter Plot with Annotations - how2matplotlib.com')
plt.xlabel('X-axis')
plt.ylabel('Y-axis')

# 显示图形
plt.show()

# 打印输出结果
print("Scatter plot with annotations has been displayed.")
Output:
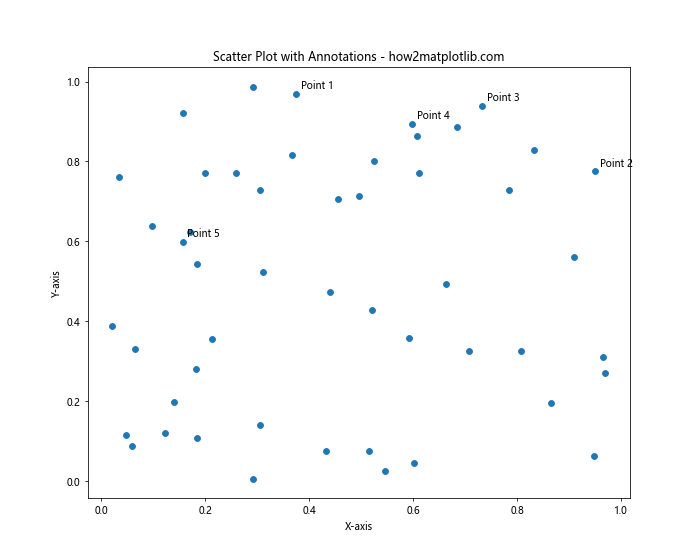
在这个例子中,我们使用annotate()函数为前5个点添加了标签。xytext参数指定了标签相对于点的偏移量。
10. 散点图与直方图结合
有时,我们可能想要在同一个图形中同时显示散点图和边缘直方图。这可以通过创建子图并调整它们的大小来实现。
import matplotlib.pyplot as plt
import numpy as np

# 生成数据
np.random.seed(42)
x = np.random.randn(1000)
y = x + np.random.randn(1000)*0.5

# 创建主图和子图
fig = plt.figure(figsize=(10, 10))
gs = fig.add_gridspec(3, 3)
ax_main = fig.add_subplot(gs[1:, :-1])
ax_right = fig.add_subplot(gs[1:, -1], sharey=ax_main)
ax_top = fig.add_subplot(gs[0, :-1], sharex=ax_main)

# 绘制散点图
ax_main.scatter好的,我将继续完成这篇关于Matplotlib散点图的详细介绍文章。

```python
# 绘制散点图
ax_main.scatter(x, y, alpha=0.5)

# 绘制边缘直方图
ax_right.hist(y, bins=30, orientation='horizontal', alpha=0.5)
ax_top.hist(x, bins=30, alpha=0.5)

# 隐藏部分刻度标签
ax_right.tick_params(axis="y", labelleft=False)
ax_top.tick_params(axis="x", labelbottom=False)

# 设置标题和轴标签
ax_main.set_xlabel('X-axis')
ax_main.set_ylabel('Y-axis')
fig.suptitle('Scatter Plot with Marginal Histograms - how2matplotlib.com', fontsize=16)

# 调整布局
plt.tight_layout()

# 显示图形
plt.show()

# 打印输出结果
print("Scatter plot with marginal histograms has been displayed.")
在这个例子中,我们创建了一个主散点图和两个边缘直方图。主图显示x和y的散点图,右侧的直方图显示y的分布,顶部的直方图显示x的分布。这种组合可以让我们同时看到两个变量的联合分布和各自的边缘分布。
11. 散点图与密度估计
除了使用直方图,我们还可以使用核密度估计(KDE)来显示边缘分布。这可以通过使用seaborn库来轻松实现。
import matplotlib.pyplot as plt
import seaborn as sns
import numpy as np

# 生成数据
np.random.seed(42)
x = np.random.randn(1000)
y = x + np.random.randn(1000)*0.5

# 创建散点图与密度图
sns.set_style("whitegrid")
g = sns.jointplot(x=x, y=y, kind="scatter", height=10, space=0.2)

# 设置标题
g.fig.suptitle('Scatter Plot with KDE - how2matplotlib.com', fontsize=16)
plt.tight_layout()

# 显示图形
plt.show()

# 打印输出结果
print("Scatter plot with KDE has been displayed.")
在这个例子中,我们使用seaborn的jointplot函数创建了一个散点图,并在边缘显示了核密度估计。这提供了一种更平滑的方式来可视化边缘分布。
12. 带趋势线的散点图
有时,我们可能想要在散点图上添加一条趋势线来显示数据的整体趋势。这可以通过使用NumPy的多项式拟合功能来实现。
import matplotlib.pyplot as plt
import numpy as np

# 生成数据
np.random.seed(42)
x = np.linspace(0, 10, 100)
y = 3*x**2 + 2*x + 1 + np.random.randn(100)*10

# 创建散点图
plt.figure(figsize=(10, 8))
plt.scatter(x, y, alpha=0.6)

# 添加趋势线
z = np.polyfit(x, y, 2)
p = np.poly1d(z)
plt.plot(x, p(x), "r--", linewidth=2)

# 设置标题和轴标签
plt.title('Scatter Plot with Trend Line - how2matplotlib.com')
plt.xlabel('X-axis')
plt.ylabel('Y-axis')

# 显示图形
plt.show()

# 打印输出结果
print("Scatter plot with trend line has been displayed.")
在这个例子中,我们使用np.polyfit函数拟合了一个二次多项式,然后使用np.poly1d创建了一个多项式函数。最后,我们在散点图上绘制了这个函数作为趋势线。
13. 带颜色渐变的散点图
我们可以创建一个颜色随某个变量变化的散点图,这可以帮助我们可视化三个变量之间的关系。
import matplotlib.pyplot as plt
import numpy as np

# 生成数据
np.random.seed(42)
n = 1000
x = np.random.randn(n)
y = np.random.randn(n)
t = np.linspace(0, 1, n)

# 创建散点图
plt.figure(figsize=(10, 8))
scatter = plt.scatter(x, y, c=t, cmap='viridis', alpha=0.6)

# 添加颜色条
plt.colorbar(scatter, label='Time')

# 设置标题和轴标签
plt.title('Scatter Plot with Color Gradient - how2matplotlib.com')
plt.xlabel('X-axis')
plt.ylabel('Y-axis')

# 显示图形
plt.show()

# 打印输出结果
print("Scatter plot with color gradient has been displayed.")
在这个例子中,我们使用t变量来控制点的颜色。颜色从蓝色渐变到黄色,代表时间的流逝或其他连续变量的变化。
14. 带大小变化的散点图
除了颜色,我们还可以使用点的大小来表示另一个变量。这样我们就可以在一个二维图表中展示四个变量之间的关系。
import matplotlib.pyplot as plt
import numpy as np

# 生成数据
np.random.seed(42)
n = 100
x = np.random.rand(n)
y = np.random.rand(n)
colors = np.random.rand(n)
sizes = 1000 * np.random.rand(n)

# 创建散点图
plt.figure(figsize=(10, 8))
scatter = plt.scatter(x, y, c=colors, s=sizes, alpha=0.6, cmap='viridis')

# 添加颜色条
plt.colorbar(scatter, label='Color Value')

# 添加大小图例
handles, labels = scatter.legend_elements(prop="sizes", alpha=0.6, num=4)
plt.legend(handles, labels, loc="upper right", title="Size")

# 设置标题和轴标签
plt.title('Scatter Plot with Varying Size and Color - how2matplotlib.com')
plt.xlabel('X-axis')
plt.ylabel('Y-axis')

# 显示图形
plt.show()

# 打印输出结果
print("Scatter plot with varying size and color has been displayed.")
在这个例子中,我们使用colors变量控制点的颜色,使用sizes变量控制点的大小。我们还添加了一个颜色条和一个大小图例来解释这些变化。
15. 带文本标签的散点图
有时,我们可能想要用文本标签而不是点来表示数据。这在处理少量数据点时特别有用。
import matplotlib.pyplot as plt
import numpy as np

# 生成数据
np.random.seed(42)
n = 20
x = np.random.rand(n)
y = np.random.rand(n)
labels = [f'P{i}' for i in range(n)]

# 创建散点图
plt.figure(figsize=(10, 8))
for i, label in enumerate(labels):
    plt.annotate(label, (x[i], y[i]))

# 设置标题和轴标签
plt.title('Scatter Plot with Text Labels - how2matplotlib.com')
plt.xlabel('X-axis')
plt.ylabel('Y-axis')

# 显示图形
plt.show()

# 打印输出结果
print("Scatter plot with text labels has been displayed.")
在这个例子中,我们使用plt.annotate函数来为每个数据点添加文本标签,而不是绘制实际的点。
16. 带误差椭圆的散点图
在某些情况下,我们可能想要显示数据的不确定性或变异性。这可以通过在散点图上添加误差椭圆来实现。
import matplotlib.pyplot as plt
import numpy as np
from matplotlib.patches import Ellipse
import matplotlib.transforms as transforms

def confidence_ellipse(x, y, ax, n_std=3.0, facecolor='none', **kwargs):
    """
    Create a plot of the covariance confidence ellipse of *x* and *y*.
    """
    if x.size != y.size:
        raise ValueError("x and y must be the same size")

    cov = np.cov(x, y)
    pearson = cov[0, 1]/np.sqrt(cov[0, 0] * cov[1, 1])

    ell_radius_x = np.sqrt(1 + pearson)
    ell_radius_y = np.sqrt(1 - pearson)
    ellipse = Ellipse((0, 0), width=ell_radius_x * 2, height=ell_radius_y * 2,
                      facecolor=facecolor, **kwargs)

    scale_x = np.sqrt(cov[0, 0]) * n_std
    mean_x = np.mean(x)

    scale_y = np.sqrt(cov[1, 1]) * n_std
    mean_y = np.mean(y)

    transf = transforms.Affine2D() \
        .rotate_deg(45) \
        .scale(scale_x, scale_y) \
        .translate(mean_x, mean_y)

    ellipse.set_transform(transf + ax.transData)
    return ax.add_patch(ellipse)

# 生成数据
np.random.seed(42)
x = np.random.randn(100)
y = 2 * x + np.random.randn(100) * 0.5

# 创建散点图
fig, ax = plt.subplots(figsize=(10, 8))
ax.scatter(x, y, alpha=0.5)

# 添加误差椭圆
confidence_ellipse(x, y, ax, edgecolor='red')

# 设置标题和轴标签
ax.set_title('Scatter Plot with Confidence Ellipse - how2matplotlib.com')
ax.set_xlabel('X-axis')
ax.set_ylabel('Y-axis')

# 显示图形
plt.show()

# 打印输出结果
print("Scatter plot with confidence ellipse has been displayed.")
在这个例子中,我们定义了一个confidence_ellipse函数来计算和绘制置信椭圆。这个椭圆显示了数据的双变量正态分布的置信区域。
17. 带回归线和置信区间的散点图
当我们想要显示两个变量之间的关系时,添加回归线和置信区间可以提供更多信息。
import matplotlib.pyplot as plt
import numpy as np
from scipy import stats

# 生成数据
np.random.seed(42)
x = np.linspace(0, 10, 100)
y = 2 * x + 1 + np.random.normal(0, 2, 100)

# 计算回归线
slope, intercept, r_value, p_value, std_err = stats.linregress(x, y)
line = slope * x + intercept

# 计算置信区间
def predict_interval(x, y, x_pred):
    n = len(x)
    x_mean = np.mean(x)
    y_mean = np.mean(y)
    x_var = np.var(x)
    y_var = np.var(y)
    xy_cov = np.cov(x, y)[0, 1]

    b1 = xy_cov / x_var
    b0 = y_mean - b1 * x_mean

    y_pred = b0 + b1 * x_pred

    se = np.sqrt(y_var * (1 - r_value**2) * ((1 / n) + (x_pred - x_mean)**2 / ((n-1) * x_var)))
    t_value = stats.t.ppf(0.975, n-2)
    ci = t_value * se

    return y_pred, ci

y_pred, ci = predict_interval(x, y, x)

# 创建散点图
plt.figure(figsize=(10, 8))
plt.scatter(x, y, alpha=0.5, label='Data')
plt.plot(x, line, color='red', label='Regression Line')
plt.fill_between(x, y_pred - ci, y_pred + ci, color='gray', alpha=0.2, label='95% CI')

# 设置标题和轴标签
plt.title('Scatter Plot with Regression Line and Confidence Interval - how2matplotlib.com')
plt.xlabel('X-axis')
plt.ylabel('Y-axis')
plt.legend()

# 显示图形
plt.show()

# 打印输出结果
print("Scatter plot with regression line and confidence interval has been displayed.")
在这个例子中,我们使用scipy.stats模块计算回归线,并定义了一个函数来计算预测区间。这样我们就可以在散点图上显示回归线和置信区间。
18. 带颜色映射的散点图
我们可以使用颜色映射来表示数据中的第三个维度。这对于可视化多维数据特别有用。
import matplotlib.pyplot as plt
import numpy as np

# 生成数据
np.random.seed(42)
n = 1000
x = np.random.randn(n)
y = np.random.randn(n)
z = x**2 + y**2

# 创建散点图
plt.figure(figsize=(10, 8))
scatter = plt.scatter(x, y, c=z, cmap='viridis', alpha=0.6)

# 添加颜色条
plt.colorbar(scatter, label='Z Value')

# 设置标题和轴标签
plt.title('Scatter Plot with Color Mapping - how2matplotlib.com')
plt.xlabel('X-axis')
plt.ylabel('Y-axis')

# 显示图形
plt.show()

# 打印输出结果
print("Scatter plot with color mapping has been displayed.")
在这个例子中,我们使用z值来控制点的颜色。颜色映射从蓝色到黄色,代表在这个例子中,我们使用z值来控制点的颜色。颜色映射从蓝色到黄色,代表z值从低到高的变化。这种方法可以帮助我们在二维平面上可视化三维数据。
19. 带子图的散点图
有时我们可能想要在同一个图形中比较多个散点图。这可以通过创建子图来实现。
import matplotlib.pyplot as plt
import numpy as np

# 生成数据
np.random.seed(42)
n = 200
x1 = np.random.randn(n)
y1 = 2*x1 + np.random.randn(n)
x2 = np.random.randn(n)
y2 = 3*x2 + np.random.randn(n)
x3 = np.random.randn(n)
y3 = -x3 + np.random.randn(n)

# 创建子图
fig, (ax1, ax2, ax3) = plt.subplots(1, 3, figsize=(15, 5))

# 绘制第一个散点图
ax1.scatter(x1, y1, alpha=0.5)
ax1.set_title('Subplot 1')
ax1.set_xlabel('X-axis')
ax1.set_ylabel('Y-axis')

# 绘制第二个散点图
ax2.scatter(x2, y2, alpha=0.5)
ax2.set_title('Subplot 2')
ax2.set_xlabel('X-axis')
ax2.set_ylabel('Y-axis')

# 绘制第三个散点图
ax3.scatter(x3, y3, alpha=0.5)
ax3.set_title('Subplot 3')
ax3.set_xlabel('X-axis')
ax3.set_ylabel('Y-axis')

# 设置总标题
fig.suptitle('Multiple Scatter Plots - how2matplotlib.com', fontsize=16)

# 调整子图之间的间距
plt.tight_layout()

# 显示图形
plt.show()

# 打印输出结果
print("Multiple scatter plots have been displayed.")
在这个例子中,我们创建了三个子图,每个子图显示一个不同的散点图。这种方法允许我们在同一个图形中比较多个数据集。
20. 带分类数据的散点图
有时我们的数据可能包含分类变量。我们可以使用不同的颜色和形状来表示不同的类别。
import matplotlib.pyplot as plt
import numpy as np

# 生成数据
np.random.seed(42)
n = 150
x = np.random.randn(n)
y = np.random.randn(n)
colors = np.random.choice(['red', 'green', 'blue'], n)
shapes = np.random.choice(['o', 's', '^'], n)

# 创建散点图
plt.figure(figsize=(10, 8))

for color in ['red', 'green', 'blue']:
    for shape in ['o', 's', '^']:
        mask = (colors == color) & (shapes == shape)
        plt.scatter(x[mask], y[mask], c=color, marker=shape, label=f'{color} {shape}', alpha=0.6)

# 设置标题和轴标签
plt.title('Scatter Plot with Categorical Data - how2matplotlib.com')
plt.xlabel('X-axis')
plt.ylabel('Y-axis')

# 添加图例
plt.legend(title='Categories')

# 显示图形
plt.show()

# 打印输出结果
print("Scatter plot with categorical data has been displayed.")
在这个例子中,我们使用不同的颜色和形状来表示不同的类别。这种方法可以帮助我们在散点图中可视化多个分类变量。
结论
Matplotlib提供了强大而灵活的工具来创建各种类型的散点图。从基本的散点图到复杂的多维数据可视化,我们都可以使用Matplotlib来实现。通过自定义颜色、大小、形状和添加各种元素(如趋势线、置信区间等),我们可以创建信息丰富的可视化,帮助我们更好地理解和分析数据。
在本文中,我们探讨了20种不同类型的散点图,每种都有其特定的用途和优势。从简单的二维散点图到复杂的3D散点图,从带误差线的散点图到带分类数据的散点图,我们展示了Matplotlib在数据可视化方面的多样性和灵活性。
关键点总结:
- 基本散点图可以快速展示两个变量之间的关系。
- 自定义点的颜色和大小可以在二维平面上展示四个变量的关系。
- 3D散点图可以直观地展示三个变量之间的关系。
- 误差线和置信区间可以帮助我们理解数据的不确定性。
- 边缘直方图和核密度估计可以同时展示联合分布和边缘分布。
- 趋势线可以帮助我们理解数据的整体趋势。
- 分类散点图可以帮助我们比较不同类别的数据。
在实际应用中,选择合适的散点图类型取决于你的数据特征和你想要传达的信息。通过组合不同的技术,你可以创建既美观又信息丰富的数据可视化。
 极客笔记
极客笔记