Matplotlib中使用subplots和ylim进行多子图绘制和Y轴范围设置
Matplotlib是Python中最流行的绘图库之一,它提供了强大的绘图功能和灵活的自定义选项。在数据可视化过程中,我们经常需要在一个图形中绘制多个子图,并对每个子图的Y轴范围进行精确控制。这就需要用到Matplotlib中的subplots和ylim功能。本文将详细介绍如何使用这两个功能来创建复杂的多子图布局,并精确控制每个子图的Y轴范围。
1. Matplotlib中的subplots简介
subplots是Matplotlib中用于创建多子图布局的重要函数。它允许我们在一个图形窗口中创建多个子图,并以网格形式排列这些子图。使用subplots可以方便地比较不同数据集,展示数据的不同方面,或者创建复杂的图形布局。
1.1 基本用法
subplots函数的基本语法如下:
fig, axes = plt.subplots(nrows, ncols, figsize=(width, height))
其中:
– fig是整个图形对象
– axes是包含所有子图的数组
– nrows是子图的行数
– ncols是子图的列数
– figsize是整个图形的大小,以英寸为单位
让我们看一个简单的例子:
import matplotlib.pyplot as plt
import numpy as np

# 创建数据
x = np.linspace(0, 10, 100)
y1 = np.sin(x)
y2 = np.cos(x)

# 创建2x2的子图布局
fig, axes = plt.subplots(2, 2, figsize=(10, 8))

# 在每个子图中绘制数据
axes[0, 0].plot(x, y1)
axes[0, 0].set_title('Sine Wave')
axes[0, 1].plot(x, y2)
axes[0, 1].set_title('Cosine Wave')
axes[1, 0].plot(x, y1 ** 2)
axes[1, 0].set_title('Squared Sine Wave')
axes[1, 1].plot(x, y2 ** 2)
axes[1, 1].set_title('Squared Cosine Wave')

# 添加总标题
fig.suptitle('Trigonometric Functions - how2matplotlib.com', fontsize=16)

# 调整子图之间的间距
plt.tight_layout()

# 显示图形
plt.show()

# 打印输出结果
print("The figure has been displayed.")
Output:
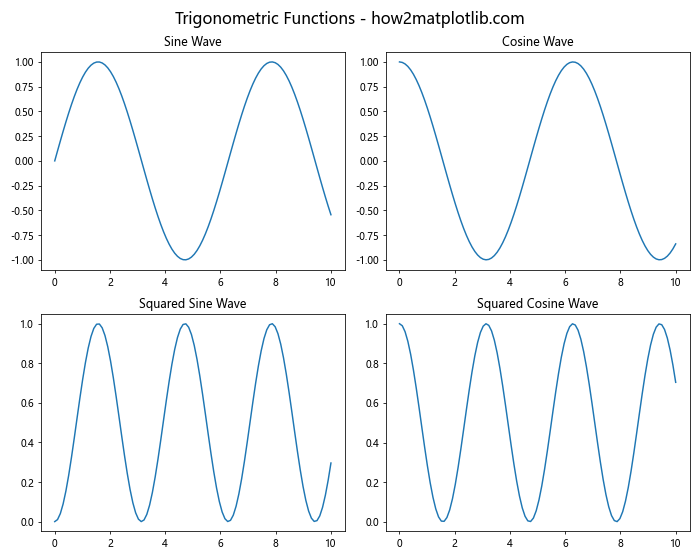
在这个例子中,我们创建了一个2×2的子图布局,并在每个子图中绘制了不同的三角函数。通过使用subplots,我们可以轻松地在一个图形中比较这些不同的函数。
1.2 自定义子图布局
subplots函数还允许我们创建更复杂的子图布局。例如,我们可以创建不同大小的子图:
import matplotlib.pyplot as plt
import numpy as np

# 创建数据
x = np.linspace(0, 10, 100)
y1 = np.sin(x)
y2 = np.cos(x)
y3 = np.tan(x)

# 创建不同大小的子图布局
fig = plt.figure(figsize=(12, 8))
gs = fig.add_gridspec(2, 2)

ax1 = fig.add_subplot(gs[0, 0])
ax2 = fig.add_subplot(gs[0, 1])
ax3 = fig.add_subplot(gs[1, :])

# 在每个子图中绘制数据
ax1.plot(x, y1)
ax1.set_title('Sine Wave')
ax2.plot(x, y2)
ax2.set_title('Cosine Wave')
ax3.plot(x, y3)
ax3.set_title('Tangent Wave')

# 添加总标题
fig.suptitle('Custom Subplot Layout - how2matplotlib.com', fontsize=16)

# 调整子图之间的间距
plt.tight_layout()

# 显示图形
plt.show()

# 打印输出结果
print("The custom subplot layout has been displayed.")
Output:
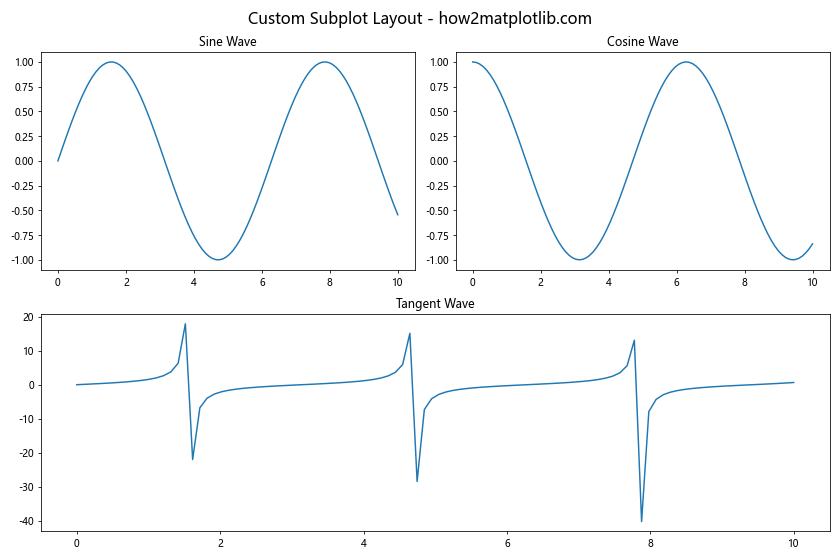
在这个例子中,我们使用GridSpec创建了一个自定义的子图布局,其中前两个子图占据上半部分,第三个子图占据整个下半部分。这种灵活性使我们能够创建更复杂和有趣的图形布局。
2. 使用ylim控制Y轴范围
ylim是Matplotlib中用于设置Y轴范围的函数。它允许我们精确控制图形的Y轴显示范围,这在许多情况下都非常有用,例如当我们需要突出显示数据的某个特定区域,或者当我们需要在多个子图之间保持一致的Y轴范围时。
2.1 基本用法
ylim函数的基本语法如下:
ax.set_ylim(bottom, top)
其中:
– ax是要设置Y轴范围的Axes对象
– bottom是Y轴的下限
– top是Y轴的上限
让我们看一个简单的例子:
import matplotlib.pyplot as plt
import numpy as np

# 创建数据
x = np.linspace(0, 10, 100)
y = np.sin(x)

# 创建图形和子图
fig, ax = plt.subplots(figsize=(8, 6))

# 绘制数据
ax.plot(x, y)

# 设置Y轴范围
ax.set_ylim(-1.5, 1.5)

# 设置标题和标签
ax.set_title('Sine Wave with Custom Y-axis Range - how2matplotlib.com')
ax.set_xlabel('X')
ax.set_ylabel('Y')

# 显示图形
plt.show()

# 打印输出结果
print("The figure with custom Y-axis range has been displayed.")
Output:
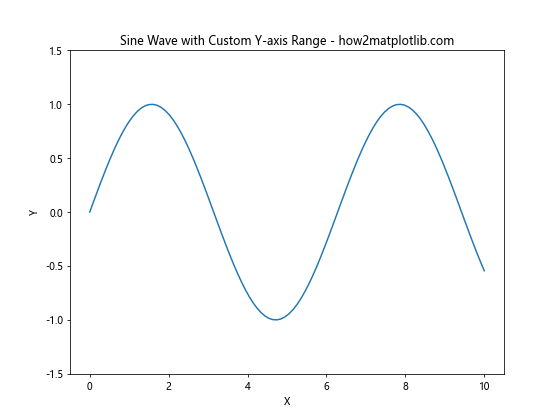
在这个例子中,我们绘制了一个正弦波,并使用ylim将Y轴范围设置为-1.5到1.5。这使得波形在图中更加居中,并留出了一些额外的空间。
2.2 在多子图中使用ylim
当我们有多个子图时,使用ylim可以确保所有子图具有相同的Y轴范围,这对于比较不同数据集非常有用:
import matplotlib.pyplot as plt
import numpy as np

# 创建数据
x = np.linspace(0, 10, 100)
y1 = np.sin(x)
y2 = np.cos(x)

# 创建2x1的子图布局
fig, (ax1, ax2) = plt.subplots(2, 1, figsize=(8, 10))

# 在每个子图中绘制数据
ax1.plot(x, y1)
ax1.set_title('Sine Wave')
ax2.plot(x, y2)
ax2.set_title('Cosine Wave')

# 设置相同的Y轴范围
ylim = (-1.5, 1.5)
ax1.set_ylim(ylim)
ax2.set_ylim(ylim)

# 添加总标题
fig.suptitle('Trigonometric Functions with Consistent Y-axis - how2matplotlib.com', fontsize=16)

# 调整子图之间的间距
plt.tight_layout()

# 显示图形
plt.show()

# 打印输出结果
print("The figure with consistent Y-axis ranges has been displayed.")
Output:
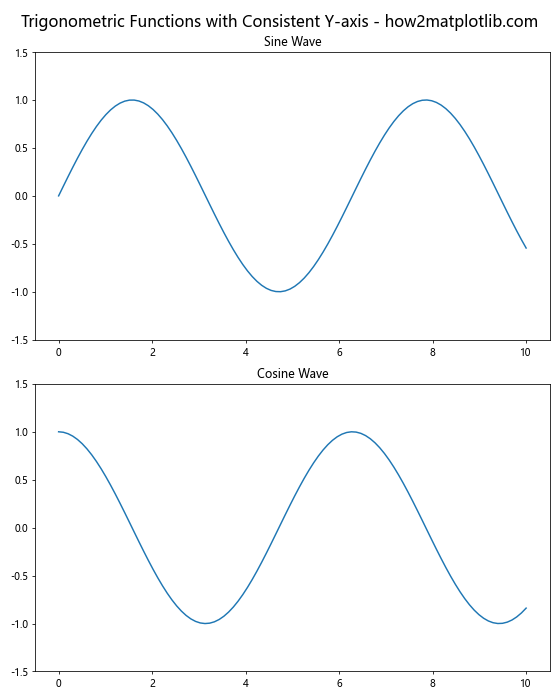
在这个例子中,我们创建了两个子图,分别显示正弦波和余弦波。通过为两个子图设置相同的Y轴范围,我们可以更容易地比较这两个函数的波形。
3. 结合subplots和ylim创建复杂图形
现在我们已经了解了subplots和ylim的基本用法,让我们来看看如何结合这两个功能来创建更复杂和信息丰富的图形。
3.1 创建具有不同Y轴范围的多子图
有时,我们可能需要在同一个图形中显示具有不同数量级的数据。在这种情况下,为每个子图设置不同的Y轴范围可能会更有意义:
import matplotlib.pyplot as plt
import numpy as np

# 创建数据
x = np.linspace(0, 10, 100)
y1 = np.sin(x)
y2 = np.exp(x)
y3 = x ** 2

# 创建3x1的子图布局
fig, (ax1, ax2, ax3) = plt.subplots(3, 1, figsize=(8, 12))

# 在每个子图中绘制数据并设置不同的Y轴范围
ax1.plot(x, y1)
ax1.set_title('Sine Wave')
ax1.set_ylim(-1.5, 1.5)

ax2.plot(x, y2)
ax2.set_title('Exponential Function')
ax2.set_ylim(0, 25000)

ax3.plot(x, y3)
ax3.set_title('Quadratic Function')
ax3.set_ylim(0, 100)

# 添加总标题
fig.suptitle('Functions with Different Scales - how2matplotlib.com', fontsize=16)

# 调整子图之间的间距
plt.tight_layout()

# 显示图形
plt.show()

# 打印输出结果
print("The figure with different Y-axis ranges has been displayed.")
Output:
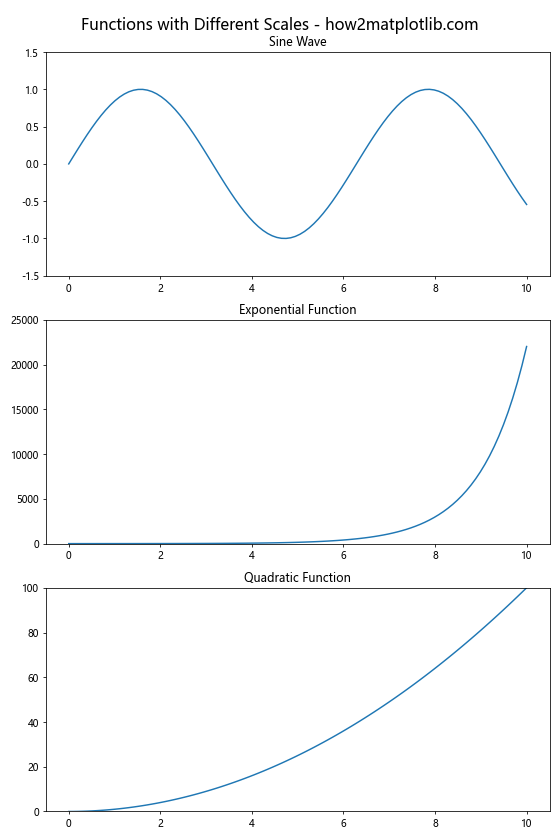
在这个例子中,我们创建了三个子图,分别显示正弦函数、指数函数和二次函数。由于这些函数的值范围差异很大,我们为每个子图设置了不同的Y轴范围,以便更好地显示每个函数的特征。
3.2 创建具有共享Y轴的子图
在某些情况下,我们可能希望创建具有共享Y轴的子图。这在比较相似数量级的数据时特别有用:
import matplotlib.pyplot as plt
import numpy as np

# 创建数据
x = np.linspace(0, 10, 100)
y1 = np.sin(x)
y2 = np.cos(x)
y3 = np.tan(x)

# 创建3x1的子图布局,共享Y轴
fig, (ax1, ax2, ax3) = plt.subplots(3, 1, figsize=(8, 12), sharex=True, sharey=True)

# 在每个子图中绘制数据
ax1.plot(x, y1)
ax1.set_title('Sine Wave')

ax2.plot(x, y2)
ax2.set_title('Cosine Wave')

ax3.plot(x, y3)
ax3.set_title('Tangent Wave')

# 设置共享的Y轴范围
plt.setp((ax1, ax2, ax3), ylim=(-2, 2))

# 添加总标题
fig.suptitle('Trigonometric Functions with Shared Y-axis - how2matplotlib.com', fontsize=16)

# 调整子图之间的间距
plt.tight_layout()

# 显示图形
plt.show()

# 打印输出结果
print("The figure with shared Y-axis has been displayed.")
Output:
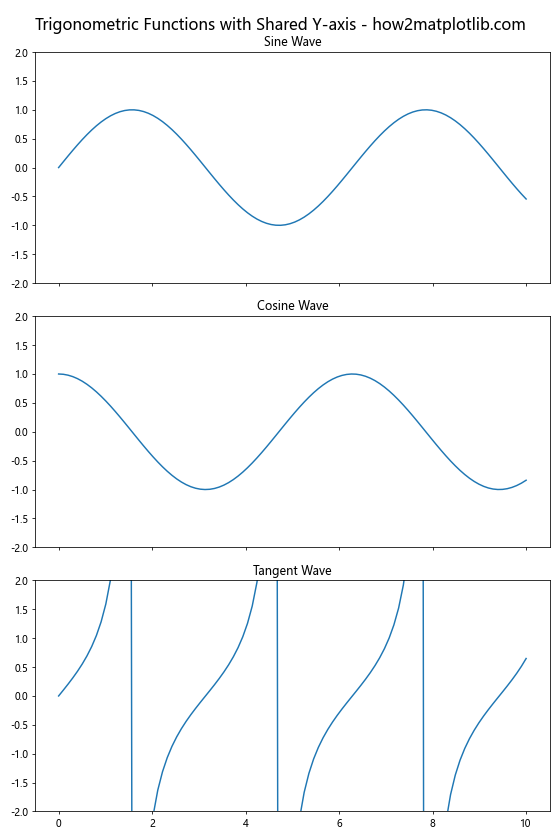
在这个例子中,我们创建了三个子图,分别显示正弦、余弦和正切函数。通过使用sharex=True和sharey=True参数,我们创建了具有共享X轴和Y轴的子图。然后,我们使用plt.setp()函数为所有子图设置相同的Y轴范围。
3.3 创建具有双Y轴的子图
有时,我们可能需要在同一个子图中显示两个不同数量级的数据集。在这种情况下,创建具有双Y轴的子图可能会很有用:
import matplotlib.pyplot as plt
import numpy as np

# 创建数据
x = np.linspace(0, 10, 100)
y1 = np.sin(x)
y2 = np.exp(x)

# 创建图形和主Y轴
fig, ax1 = plt.subplots(figsize=(10, 6))

# 绘制第一个数据集
color = 'tab:blue'
ax1.set_xlabel('X')
ax1.set_ylabel('sin(x)', color=color)
ax1.plot(x, y1, color=color)
ax1.tick_params(axis='y', labelcolor=color)
ax1.set_ylim(-1.5, 1.5)

# 创建次Y轴
ax2 = ax1.twinx()

# 绘制第二个数据集
color = 'tab:orange'
ax2.set_ylabel('exp(x)', color=color)
ax2.plot(x, y2, color=color)
ax2.tick_params(axis='y', labelcolor=color)
ax2.set_ylim(0, 25000)

# 设置标题
plt.title('Sine and Exponential Functions - how2matplotlib.com')

# 调整布局
fig.tight_layout()

# 显示图形
plt.show()

# 打印输出结果
print("The figure with dual Y-axes has been displayed.")
Output:
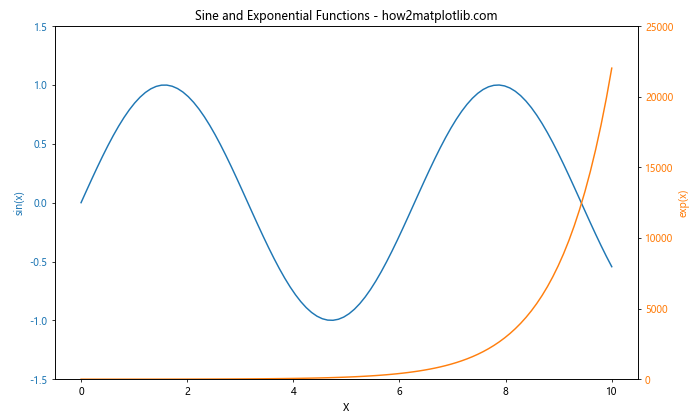
在这个例子中,我们在同一个子图中绘制了正弦函数和指数函数。通过使用twinx()方法创建一个次Y轴,我们可以为每个函数设置不同的Y轴范围,从而在一个图中清晰地显示两个不同数量级的数据集。
4. 高级技巧和最佳实践
在使用subplots和ylim时,有一些高级技巧和最佳实践可以帮助我们创建更专业和信息丰富的图形。
4.1 使用GridSpec创建复杂布局
GridSpec允许我们创建更复杂和灵活的子图布局。以下是一个使用GridSpec创建不规则子图布局的例子:
import matplotlib.pyplot as plt
import numpy as np
from matplotlib.gridspec import GridSpec

# 创建数据
x = np.linspace(0, 10, 100)
y1 = np.sin(x)
y2 = np.cos(x)
y3 = np.tan(x)
y4 = x**2

# 创建图形
fig = plt.figure(figsize=(12, 8))
gs = GridSpec(3, 3, figure=fig)

# 创建子图
ax1 = fig.add_subplot(gs[0, :])
ax2 = fig.add_subplot(gs[1, :-1])
ax3 = fig.add_subplot(gs[1:, -1])
ax4 = fig.add_subplot(gs[-1, 0])
ax5 = fig.add_subplot(gs[-1, -2])

# 绘制数据
ax1.plot(x, y1)
ax1.set_title('Sine Wave')
ax1.set_ylim(-1.5, 1.5)

ax2.plot(x, y2)
ax2.set_title('Cosine Wave')
ax2.set_ylim(-1.5, 1.5)

ax3.plot(y3, x)
ax3.set_title('Tangent Wave')
ax3.set_xlim(-10, 10)

ax4.plot(x, y4)
ax4.set_title('Quadratic Function')
ax4.set_ylim(0, 100)

ax5.plot(x, np.log(x))
ax5.set_title('Logarithmic Function')
ax5.set_ylim(-2, 3)

# 添加总标题
fig.suptitle('Complex Subplot Layout - how2matplotlib.com', fontsize=16)

# 调整子图之间的间距
plt.tight_layout()

# 显示图形
plt.show()

# 打印输出结果
print("The figure with complex subplot layout has been displayed.")
在这个例子中,我们使用GridSpec创建了一个3×3的网格,然后在这个网格上创建了5个不同大小和位置的子图。这种方法允许我们创建非常灵活和复杂的图形布局。
4.2 动态调整Y轴范围
有时,我们可能不知道数据的确切范围,或者希望Y轴范围能够自动适应数据。以下是一个动态调整Y轴范围的例子:
import matplotlib.pyplot as plt
import numpy as np

# 创建数据
x = np.linspace(0, 10, 100)
y1 = np.sin(x) * np.random.randn(100)
y2 = np.cos(x) * np.random.randn(100)

# 创建2x1的子图布局
fig, (ax1, ax2) = plt.subplots(2, 1, figsize=(8, 10))

# 在每个子图中绘制数据
ax1.plot(x, y1)
ax1.set_title('Random Sine Wave')
ax2.plot(x, y2)
ax2.set_title('Random Cosine Wave')

# 动态调整Y轴范围
def adjust_ylim(ax, factor=1.1):
    ylim = ax.get_ylim()
    yrange = ylim[1] - ylim[0]
    ymean = np.mean(ylim)
    ax.set_ylim(ymean - factor * yrange / 2, ymean + factor * yrange / 2)

adjust_ylim(ax1)
adjust_ylim(ax2)

# 添加总标题
fig.suptitle('Dynamic Y-axis Range Adjustment - how2matplotlib.com', fontsize=16)

# 调整子图之间的间距
plt.tight_layout()

# 显示图形
plt.show()

# 打印输出结果
print("The figure with dynamically adjusted Y-axis ranges has been displayed.")
Output:
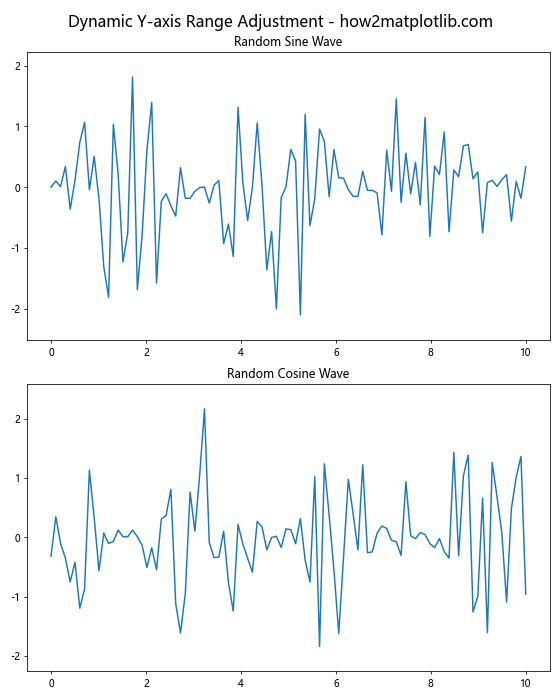
在这个例子中,我们定义了一个adjust_ylim函数,它可以根据数据的实际范围动态调整Y轴的范围。这个函数首先获取当前的Y轴范围,然后计算新的范围,使数据在Y轴上更居中,并留出一些额外的空间。
4.3 使用不同的Y轴刻度
有时,我们可能需要在不同的子图中使用不同的Y轴刻度。以下是一个例子,展示了如何在线性、对数和符号对数刻度之间切换:
import matplotlib.pyplot as plt
import numpy as np

# 创建数据
x = np.linspace(0, 10, 100)
y1 = np.exp(x)
y2 = x**2
y3 = np.sin(x)

# 创建3x1的子图布局
fig, (ax1, ax2, ax3) = plt.subplots(3, 1, figsize=(8, 12))

# 在每个子图中绘制数据并设置不同的Y轴刻度
ax1.plot(x, y1)
ax1.set_title('Exponential Function (Log Scale)')
ax1.set_yscale('log')
ax1.set_ylim(1, 25000)

ax2.plot(x, y2)
ax2.set_title('Quadratic Function (Linear Scale)')
ax2.set_yscale('linear')
ax2.set_ylim(0, 100)

ax3.plot(x, y3)
ax3.set_title('Sine Function (Symlog Scale)')
ax3.set_yscale('symlog', linthresh=0.1)
ax3.set_ylim(-2, 2)

# 添加总标题
fig.suptitle('Different Y-axis Scales - how2matplotlib.com', fontsize=16)

# 调整子图之间的间距
plt.tight_layout()

# 显示图形
plt.show()

# 打印输出结果
print("The figure with different Y-axis scales has been displayed.")
Output:
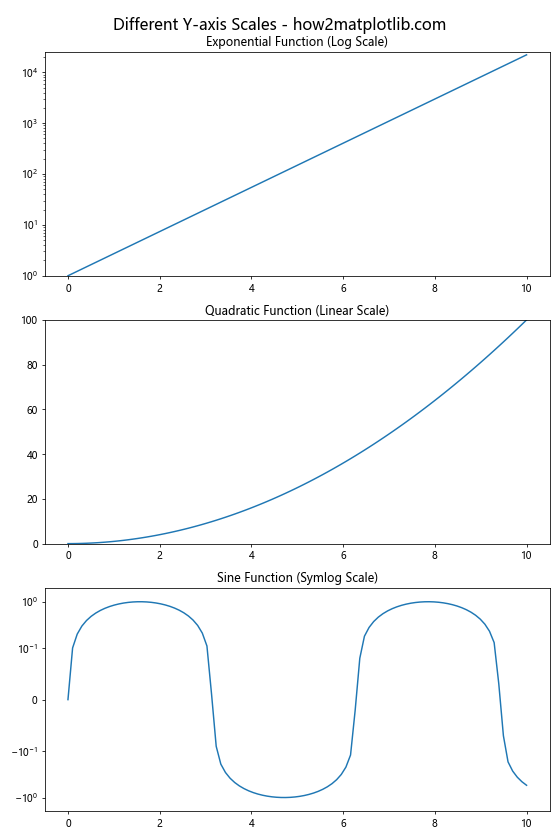
在这个例子中,我们为三个不同的函数使用了三种不同的Y轴刻度:对数刻度、线性刻度和符号对数刻度。对数刻度适用于显示指数增长的数据,线性刻度适用于线性关系,而符号对数刻度适用于既有正值又有负值的数据。
4.4 添加辅助线和网格
添加辅助线和网格可以帮助读者更好地理解数据。以下是一个添加水平线、垂直线和网格的例子:
import matplotlib.pyplot as plt
import numpy as np

# 创建数据
x = np.linspace(0, 10, 100)
y = np.sin(x)

# 创建图形和子图
fig, ax = plt.subplots(figsize=(10, 6))

# 绘制数据
ax.plot(x, y)

# 设置Y轴范围
ax.set_ylim(-1.5, 1.5)

# 添加水平线
ax.axhline(y=0, color='r', linestyle='--')

# 添加垂直线
ax.axvline(x=np.pi, color='g', linestyle=':')

# 添加网格
ax.grid(True, linestyle='-', alpha=0.7)

# 设置标题和标签
ax.set_title('Sine Wave with Auxiliary Lines and Grid - how2matplotlib.com')
ax.set_xlabel('X')
ax.set_ylabel('Y')

# 显示图形
plt.show()

# 打印输出结果
print("The figure with auxiliary lines and grid has been displayed.")
Output:
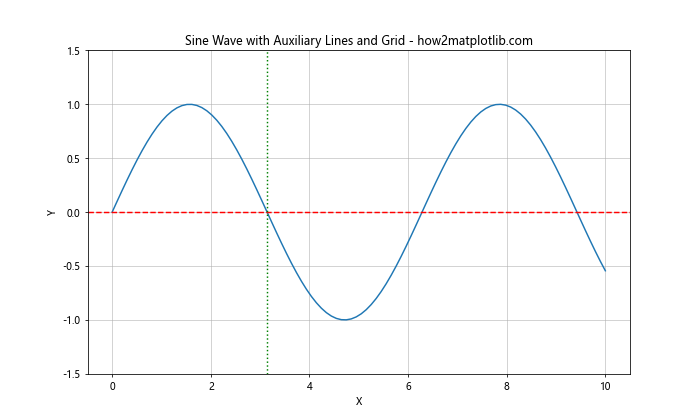
在这个例子中,我们添加了一条红色的水平虚线(y=0),一条绿色的垂直点线(x=π),以及一个灰色的网格。这些辅助元素可以帮助读者更好地理解数据的位置和尺度。
4.5 使用颜色映射
当我们有多个数据系列时,使用颜色映射可以使图形更加清晰和美观。以下是一个使用颜色映射的例子:
import matplotlib.pyplot as plt
import numpy as np

# 创建数据
x = np.linspace(0, 10, 100)
y = np.array([np.sin(x + i/5.0) for i in range(10)])

# 创建图形和子图
fig, ax = plt.subplots(figsize=(10, 6))

# 使用颜色映射绘制多条线
cmap = plt.get_cmap('viridis')
for i in range(10):
    color = cmap(i / 10)
    ax.plot(x, y[i], color=color, label=f'Wave {i+1}')

# 设置Y轴范围
ax.set_ylim(-1.5, 1.5)

# 添加图例
ax.legend(loc='upper right', bbox_to_anchor=(1.3, 1))

# 设置标题和标签
ax.set_title('Multiple Sine Waves with Color Mapping - how2matplotlib.com')
ax.set_xlabel('X')
ax.set_ylabel('Y')

# 调整布局以适应图例
plt.tight_layout()

# 显示图形
plt.show()

# 打印输出结果
print("The figure with color mapping has been displayed.")
Output:
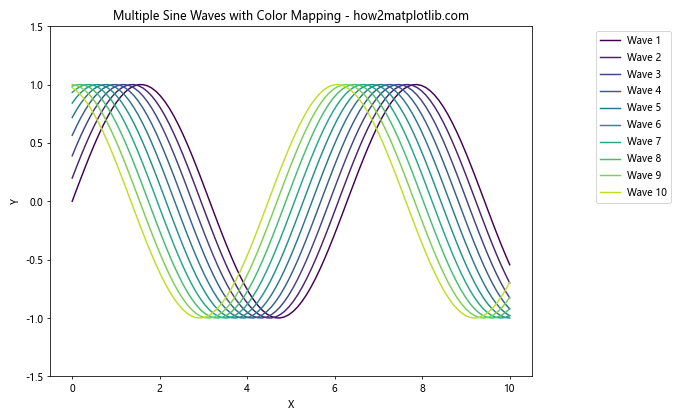
在这个例子中,我们创建了10个稍微不同的正弦波,并使用’viridis’颜色映射为每个波形分配不同的颜色。这种方法可以帮助读者更容易地区分不同的数据系列。
5. 处理常见问题和挑战
在使用Matplotlib的subplots和ylim时,可能会遇到一些常见的问题和挑战。以下是一些解决方案:
5.1 处理重叠的子图标题
当子图很多或者间距很小时,子图的标题可能会重叠。以下是一个解决这个问题的例子:
import matplotlib.pyplot as plt
import numpy as np

# 创建数据
x = np.linspace(0, 10, 100)
y = np.sin(x)

# 创建3x3的子图布局
fig, axes = plt.subplots(3, 3, figsize=(12, 12))

# 在每个子图中绘制数据
for i, ax in enumerate(axes.flat):
    ax.plot(x, y * (i+1))
    ax.set_title(f'Sine Wave {i+1}', pad=20)  # 增加标题和图形之间的间距
    ax.set_ylim(-10, 10)

# 添加总标题
fig.suptitle('Multiple Sine Waves - how2matplotlib.com', fontsize=16, y=0.95)

# 调整子图之间的间距
plt.tight_layout(rect=[0, 0.03, 1, 0.95])  # 为总标题留出空间

# 显示图形
plt.show()

# 打印输出结果
print("The figure with non-overlapping subplot titles has been displayed.")
Output:
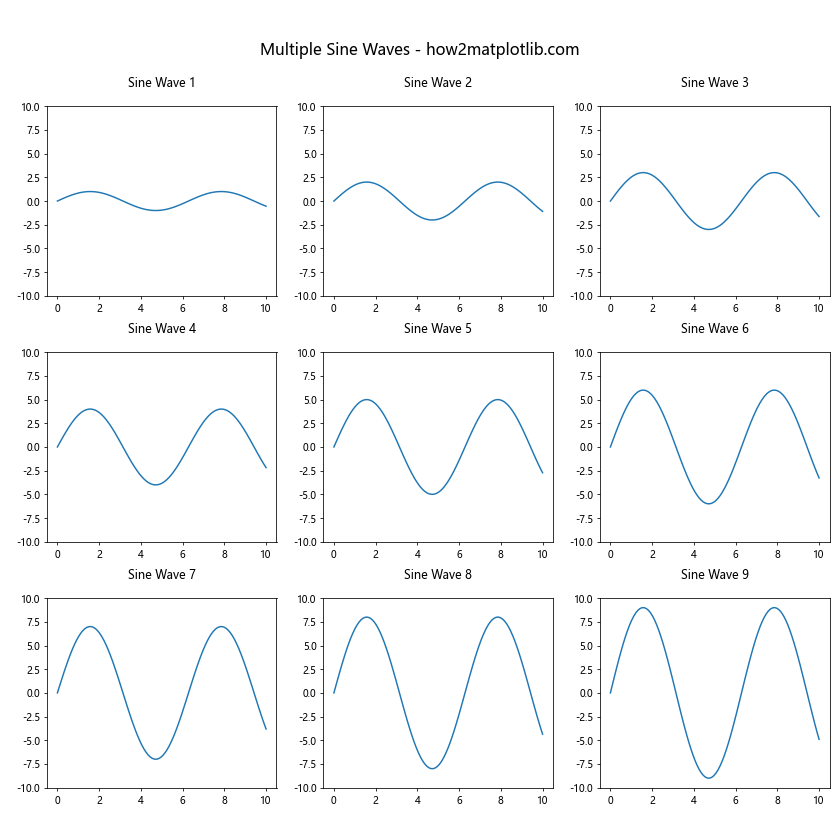
在这个例子中,我们通过增加标题和图形之间的间距(使用pad参数),以及调整整体布局(使用tight_layout的rect参数)来避免标题重叠。
5.2 处理Y轴标签重叠
当有多个子图时,Y轴标签可能会重叠。以下是一个解决这个问题的例子:
import matplotlib.pyplot as plt
import numpy as np

# 创建数据
x = np.linspace(0, 10, 100)
y = np.sin(x)

# 创建2x2的子图布局
fig, axes = plt.subplots(2, 2, figsize=(12, 10))

# 在每个子图中绘制数据
for i, ax in enumerate(axes.flat):
    ax.plot(x, y * (i+1))
    ax.set_title(f'Sine Wave {i+1}')
    ax.set_ylim(-5, 5)

    # 只为左侧的子图设置Y轴标签
    if i % 2 == 0:
        ax.set_ylabel('Amplitude')
    else:
        ax.set_ylabel('')
        ax.yaxis.set_tick_params(labelright=True, labelleft=False)
        ax.yaxis.set_label_position("right")

# 添加总标题
fig.suptitle('Multiple Sine Waves - how2matplotlib.com', fontsize=16)

# 调整子图之间的间距
plt.tight_layout()

# 显示图形
plt.show()

# 打印输出结果
print("The figure with non-overlapping Y-axis labels has been displayed.")
Output:
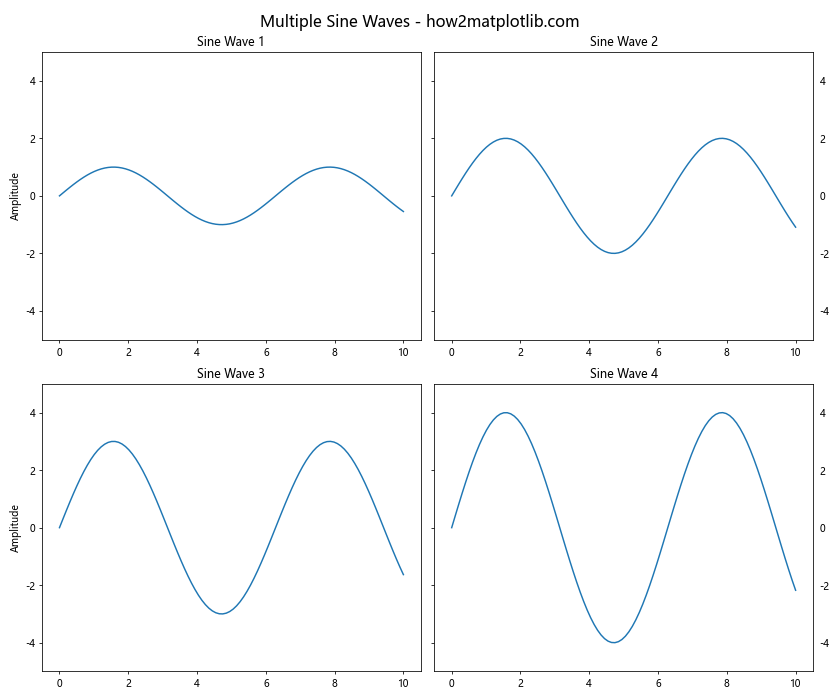
在这个例子中,我们只为左侧的子图设置Y轴标签,并将右侧子图的Y轴刻度标签移到右侧。这样可以避免Y轴标签的重叠,同时保持图形的可读性。
5.3 处理长标题和标签
当标题或标签很长时,可能会超出图形边界。以下是一个处理这个问题的例子:
import matplotlib.pyplot as plt
import numpy as np

# 创建数据
x = np.linspace(0, 10, 100)
y = np.sin(x)

# 创建图形和子图
fig, ax = plt.subplots(figsize=(10, 6))

# 绘制数据
ax.plot(x, y)

# 设置Y轴范围
ax.set_ylim(-1.5, 1.5)

# 设置长标题和标签
ax.set_title('This is a Very Long Title That Might Exceed the Figure Boundaries - how2matplotlib.com',
             fontsize=12, wrap=True)
ax.set_xlabel('This is a Very Long X-axis Label That Might Exceed the Figure Boundaries',
              fontsize=10, wrap=True)
ax.set_ylabel('This is a Very Long Y-axis Label\nThat Might Exceed the\nFigure Boundaries',
              fontsize=10, wrap=True)

# 调整布局
plt.tight_layout()

# 显示图形
plt.show()

# 打印输出结果
print("The figure with long titles and labels has been displayed.")
Output:
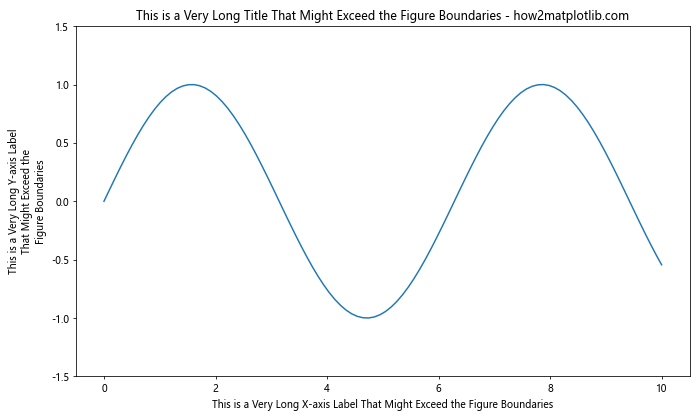
在这个例子中,我们使用wrap=True参数来自动换行长标题和标签,并使用\n来手动换行Y轴标签。这样可以确保所有文本都在图形边界内。
5.4 处理不同尺度的数据
当我们需要在同一个图形中显示不同尺度的数据时,可以使用双Y轴或对数刻度。以下是一个结合这两种方法的例子:
import matplotlib.pyplot as plt
import numpy as np

# 创建数据
x = np.linspace(0, 10, 100)
y1 = np.sin(x)
y2 = np.exp(x)

# 创建图形和主Y轴
fig, ax1 = plt.subplots(figsize=(10, 6))

# 绘制第一个数据集(使用主Y轴)
color = 'tab:blue'
ax1.set_xlabel('X')
ax1.set_ylabel('sin(x)', color=color)
ax1.plot(x, y1, color=color)
ax1.tick_params(axis='y', labelcolor=color)
ax1.set_ylim(-1.5, 1.5)

# 创建次Y轴
ax2 = ax1.twinx()

# 绘制第二个数据集(使用次Y轴,对数刻度)
color = 'tab:orange'
ax2.set_ylabel('exp(x)', color=color)
ax2.plot(x, y2, color=color)
ax2.tick_params(axis='y', labelcolor=color)
ax2.set_yscale('log')
ax2.set_ylim(1, 25000)

# 设置标题
plt.title('Sine and Exponential Functions with Different Scales - how2matplotlib.com')

# 调整布局
fig.tight_layout()

# 显示图形
plt.show()

# 打印输出结果
print("The figure with different scales has been displayed.")
Output:
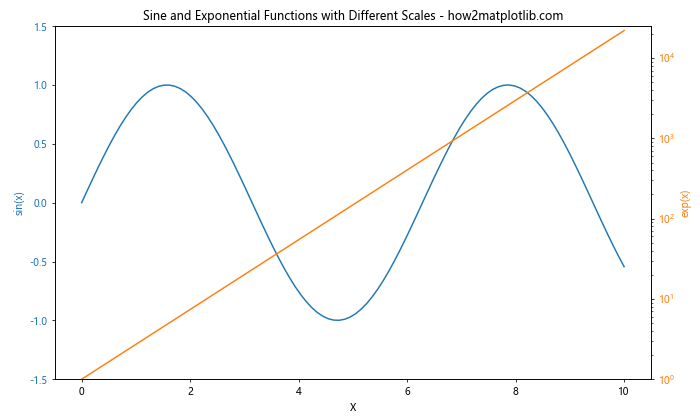
在这个例子中,我们使用双Y轴来显示正弦函数和指数函数。主Y轴使用线性刻度显示正弦函数,而次Y轴使用对数刻度显示指数函数。这样可以在同一个图形中清晰地展示两个不同尺度的数据集。
5.5 处理大量数据点
当我们需要绘制包含大量数据点的图形时,可能会遇到性能问题。以下是一个处理这个问题的例子:
import matplotlib.pyplot as plt
import numpy as np

# 创建大量数据点
x = np.linspace(0, 100, 1000000)
y = np.sin(x) + np.random.normal(0, 0.1, 1000000)

# 创建图形和子图
fig, (ax1, ax2) = plt.subplots(1, 2, figsize=(15, 6))

# 使用所有数据点绘制
ax1.plot(x, y, linewidth=0.5, alpha=0.5)
ax1.set_title('All Data Points')
ax1.set_ylim(-1.5, 1.5)

# 使用数据抽样绘制
step = 100
ax2.plot(x[::step], y[::step], linewidth=0.5)
ax2.set_title(f'Every {step}th Data Point')
ax2.set_ylim(-1.5, 1.5)

# 添加总标题
fig.suptitle('Handling Large Datasets - how2matplotlib.com', fontsize=16)

# 调整布局
plt.tight_layout()

# 显示图形
plt.show()

# 打印输出结果
print("The figure demonstrating handling of large datasets has been displayed.")
Output:
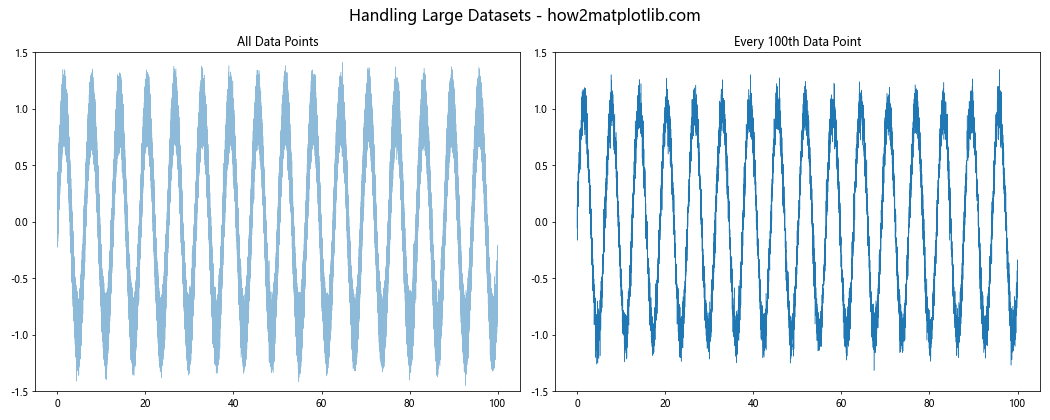
在这个例子中,我们创建了一个包含100万个数据点的数据集。左侧的子图显示所有数据点,而右侧的子图只显示每100个点中的一个。这种数据抽样方法可以显著提高大数据集的绘图性能,同时仍然保持数据的整体趋势。
6. 高级应用示例
让我们来看一些更复杂的应用示例,这些例子综合了我们之前讨论的多个概念。
6.1 创建交互式股票图表
以下是一个创建交互式股票图表的例子,它使用了subplots、ylim和其他高级功能:
import matplotlib.pyplot as plt
import numpy as np
from matplotlib.widgets import Slider, Button

# 模拟股票数据
np.random.seed(0)
dates = np.arange('2020-01-01', '2023-01-01', dtype='datetime64[D]')
prices = np.cumsum(np.random.randn(len(dates))) + 100

# 创建图形和子图
fig, (ax1, ax2) = plt.subplots(2, 1, figsize=(12, 10), height_ratios=[3, 1])
plt.subplots_adjust(bottom=0.25)

# 绘制股票价格
line, = ax1.plot(dates, prices, lw=2)
ax1.set_title('Interactive Stock Chart - how2matplotlib.com')
ax1.set_ylabel('Price')
ax1.grid(True)

# 绘制成交量(随机生成)
volume = np.random.randint(1000000, 10000000, size=len(dates))
ax2.bar(dates, volume, width=1, align='center', alpha=0.5)
ax2.set_ylabel('Volume')
ax2.set_xlabel('Date')

# 创建滑块
ax_slider = plt.axes([0.2, 0.1, 0.6, 0.03])
slider = Slider(ax_slider, 'Zoom', 0.1, 1.0, valinit=1.0)

# 创建重置按钮
ax_button = plt.axes([0.8, 0.025, 0.1, 0.04])
button = Button(ax_button, 'Reset')

# 定义滑块更新函数
def update(val):
    zoom = slider.val
    y_mean = np.mean(prices)
    y_range = np.ptp(prices)
    ax1.set_ylim(y_mean - y_range / (2 * zoom), y_mean + y_range / (2 * zoom))
    fig.canvas.draw_idle()

# 定义按钮点击函数
def reset(event):
    slider.reset()

# 连接事件
slider.on_changed(update)
button.on_clicked(reset)

# 显示图形
plt.show()

# 打印输出结果
print("The interactive stock chart has been displayed.")
Output:
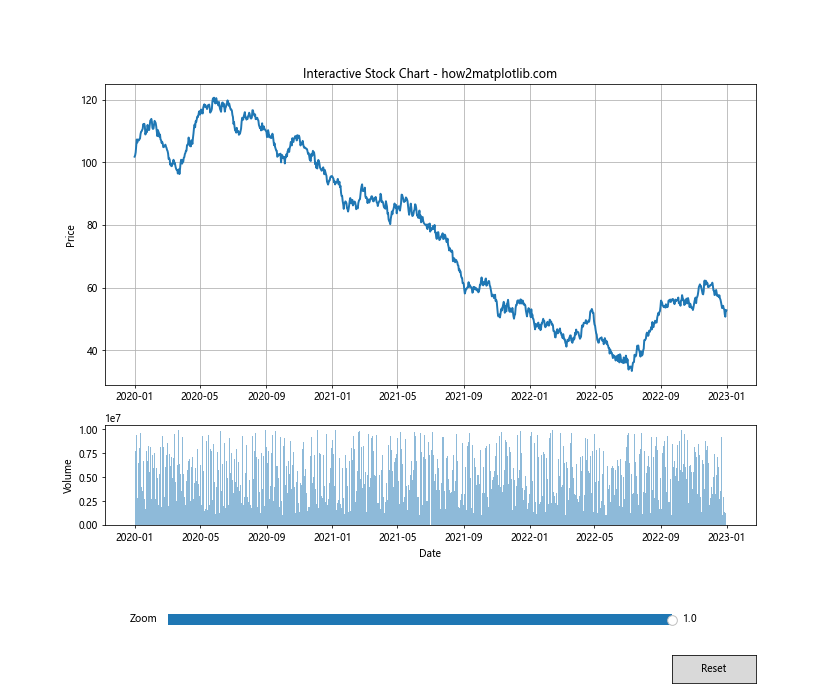
这个例子创建了一个交互式的股票图表,包括价格和成交量。用户可以使用滑块来调整价格图的缩放级别,还可以使用重置按钮恢复原始视图。
6.2 创建多变量数据可视化
以下是一个创建多变量数据可视化的例子,它使用了subplots和颜色映射:
import matplotlib.pyplot as plt
import numpy as np
from mpl_toolkits.mplot3d import Axes3D

# 创建数据
n = 100
x = np.random.rand(n)
y = np.random.rand(n)
z = np.random.rand(n)
colors = np.random.rand(n)
sizes = 1000 * np.random.rand(n)

# 创建2x2的子图布局
fig = plt.figure(figsize=(15, 15))
fig.suptitle('Multi-variable Data Visualization - how2matplotlib.com', fontsize=16)

# 3D散点图
ax1 = fig.add_subplot(221, projection='3d')
scatter1 = ax1.scatter(x, y, z, c=colors, s=sizes, alpha=0.6, cmap='viridis')
ax1.set_title('3D Scatter Plot')
ax1.set_xlabel('X')
ax1.set_ylabel('Y')
ax1.set_zlabel('Z')
fig.colorbar(scatter1, ax=ax1, label='Color Value')

# 2D散点图
ax2 = fig.add_subplot(222)
scatter2 = ax2.scatter(x, y, c=colors, s=sizes, alpha=0.6, cmap='viridis')
ax2.set_title('2D Scatter Plot')
ax2.set_xlabel('X')
ax2.set_ylabel('Y')
fig.colorbar(scatter2, ax=ax2, label='Color Value')

# 直方图
ax3 = fig.add_subplot(223)
ax3.hist(colors, bins=20, alpha=0.6)
ax3.set_title('Histogram of Color Values')
ax3.set_xlabel('Color Value')
ax3.set_ylabel('Frequency')

# 箱线图
ax4 = fig.add_subplot(224)
ax4.boxplot([x, y, z, colors], labels=['X', 'Y', 'Z', 'Colors'])
ax4.set_title('Box Plot of Variables')
ax4.set_ylabel('Value')

# 调整布局
plt.tight_layout(rect=[0, 0.03, 1, 0.95])

# 显示图形
plt.show()

# 打印输出结果
print("The multi-variable data visualization has been displayed.")
Output:
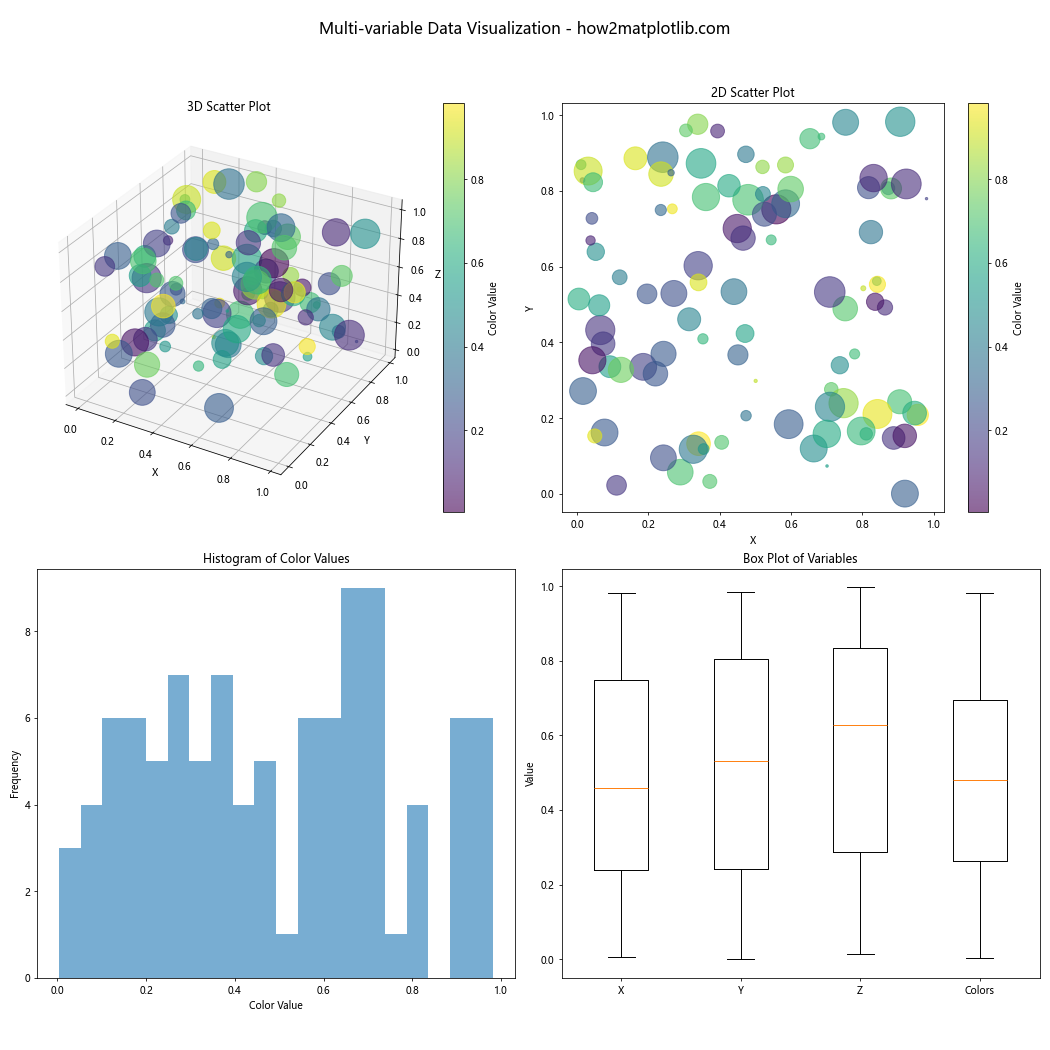
这个例子创建了四个子图,分别是3D散点图、2D散点图、直方图和箱线图,用于可视化多变量数据。每个子图都展示了数据的不同方面,使用了不同的ylim设置和可视化技术。
6.3 创建动态更新的实时数据图
以下是一个创建动态更新的实时数据图的例子:
import matplotlib.pyplot as plt
import numpy as np
from matplotlib.animation import FuncAnimation

# 创建初始数据
x_data = []
y_data = []

# 创建图形和子图
fig, ax = plt.subplots(figsize=(10, 6))
line, = ax.plot([], [], lw=2)
ax.set_xlim(0, 100)
ax.set_ylim(-1, 1)
ax.grid(True)
ax.set_title('Real-time Data Visualization - how2matplotlib.com')
ax.set_xlabel('Time')
ax.set_ylabel('Value')

# 定义初始化函数
def init():
    line.set_data([], [])
    return line,

# 定义更新函数
def update(frame):
    x_data.append(frame)
    y_data.append(np.sin(frame * 0.1) + np.random.randn() * 0.1)
    line.set_data(x_data, y_data)

    # 动态调整x轴范围
    if frame > 100:
        ax.set_xlim(frame - 100, frame)

    # 动态调整y轴范围
    if len(y_data) > 1:
        ymin, ymax = min(y_data[-100:]), max(y_data[-100:])
        ax.set_ylim(ymin - 0.1, ymax + 0.1)

    return line,

# 创建动画
anim = FuncAnimation(fig, update, frames=np.linspace(0, 1000, 1000),
                     init_func=init, blit=True, interval=50)

# 显示图形
plt.show()

# 打印输出结果
print("The real-time data visualization has been displayed.")
Output:
这个例子创建了一个动态更新的实时数据图。它使用FuncAnimation来持续更新图形,模拟实时数据流。y轴的范围会根据最近的数据动态调整,确保数据始终可见。
7. 总结
在本文中,我们深入探讨了Matplotlib中subplots和ylim的使用,以及它们在创建复杂和信息丰富的可视化中的重要性。我们学习了如何:
- 使用subplots创建多子图布局
- 使用ylim精确控制Y轴范围
- 结合subplots和ylim创建复杂图形
- 处理常见的问题和挑战,如重叠的标题和标签
- 创建高级应用,如交互式图表和实时数据可视化
通过掌握这些技能,你将能够创建更专业、更有洞察力的数据可视化。记住,好的数据可视化不仅仅是展示数据,更是讲述数据背后的故事。通过适当使用subplots和ylim,你可以确保你的图形清晰地传达你想要表达的信息。
继续练习和实验这些技术,你会发现Matplotlib提供了无限的可能性来创建独特和引人注目的数据可视化。无论你是在进行科学研究、数据分析还是商业报告,这些技能都将帮助你更有效地传达你的发现和见解。
 极客笔记
极客笔记