Matplotlib绘制误差棒
Matplotlib是Python中最流行的数据可视化库之一,可以用来创建各种类型的图表,包括条形图、折线图、散点图等。在实际的数据分析中,我们经常需要展示数据的均值和误差范围,这时就需要用到误差棒(error bar)。
误差棒是指在数据点周围绘制的线段,用来表示数据的不确定性或变异范围。Matplotlib提供了丰富的方法来绘制误差棒,本文将介绍如何使用Matplotlib来绘制不同类型的误差棒图。
1. 基本误差棒图
首先,我们来看一个简单的例子,如何使用Matplotlib绘制基本的误差棒图。下面是一个示例代码:
import matplotlib.pyplot as plt

x = [1, 2, 3, 4, 5]
y = [2, 3, 5, 7, 6]
errors = [0.5, 0.3, 0.4, 0.6, 0.2]

plt.errorbar(x, y, yerr=errors, fmt='o')
plt.show()
Output:
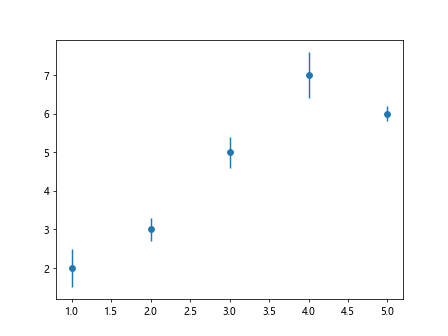
上面的代码中,我们首先定义了x轴和y轴的数据,然后定义了每个数据点的误差范围errors,接着使用plt.errorbar函数来绘制误差棒图,其中yerr参数指定了y轴上的误差范围,fmt参数定义了数据点的样式。
2. 不对称误差棒
有时候,数据点的误差范围可能不是对称的,比如上限误差和下限误差不相等。在这种情况下,可以使用yerr=[lower_error, upper_error]来指定不对称的误差范围。下面是一个示例代码:
import matplotlib.pyplot as plt

x = [1, 2, 3, 4, 5]
y = [2, 3, 5, 7, 6]
lower_errors = [0.5, 0.3, 0.4, 0.6, 0.2]
upper_errors = [0.2, 0.4, 0.3, 0.5, 0.1]

plt.errorbar(x, y, yerr=[lower_errors, upper_errors], fmt='o')
plt.show()
Output:
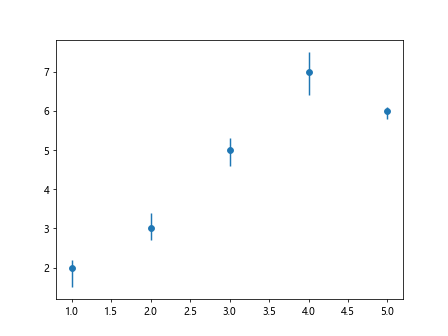
在上面的代码中,我们分别定义了上限误差和下限误差,然后传递给yerr参数即可。
3. 横向误差棒
除了纵向误差棒,Matplotlib也支持绘制横向误差棒。下面是一个示例代码:
import matplotlib.pyplot as plt

x = [1, 2, 3, 4, 5]
y = [2, 3, 5, 7, 6]
errors = [0.5, 0.3, 0.4, 0.6, 0.2]

plt.errorbar(x, y, xerr=errors, fmt='o')
plt.show()
Output:
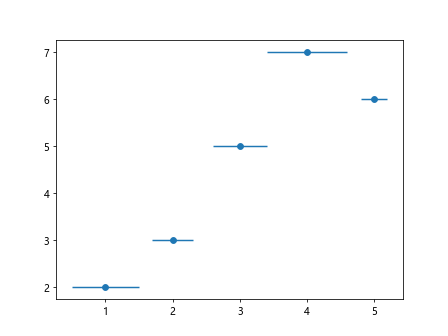
在上面的代码中,我们通过xerr参数指定了横向误差棒的范围。
4. 自定义误差棒样式
Matplotlib允许用户自定义误差棒的样式,比如线型、颜色、标记等。下面是一个示例代码:
import matplotlib.pyplot as plt

x = [1, 2, 3, 4, 5]
y = [2, 3, 5, 7, 6]
errors = [0.5, 0.3, 0.4, 0.6, 0.2]

plt.errorbar(x, y, yerr=errors, fmt='o', ecolor='red', capsize=5, elinewidth=2, capthick=2)
plt.show()
Output:
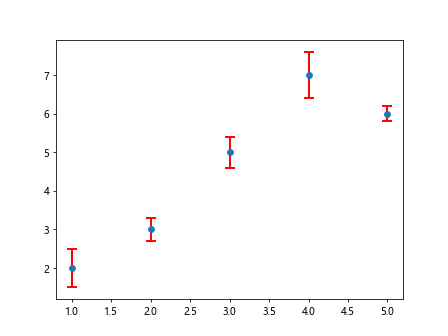
在上面的代码中,我们通过ecolor参数指定了误差棒的颜色,capsize参数指定了误差棒顶部和底部的横线长度,elinewidth参数指定了误差棒的线宽,capthick参数指定了误差棒顶部和底部的横线宽度。
5. 多组误差棒
有时候,我们需要同时展示多组数据的误差范围,可以通过多次调用plt.errorbar函数来实现。下面是一个示例代码:
import matplotlib.pyplot as plt

x = [1, 2, 3, 4, 5]
y1 = [2, 3, 5, 7, 6]
y2 = [3, 4, 6, 8, 7]
errors1 = [0.5, 0.3, 0.4, 0.6, 0.2]
errors2 = [0.3, 0.2, 0.5, 0.4, 0.1]

plt.errorbar(x, y1, yerr=errors1, fmt='o', label='Data 1')
plt.errorbar(x, y2, yerr=errors2, fmt='^', label='Data 2')
plt.legend()
plt.show()
Output:
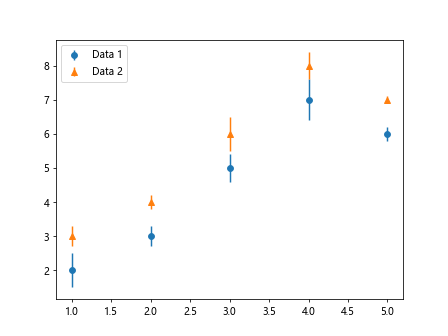
在上面的代码中,我们分别定义了两组数据及它们的误差范围,然后分别调用plt.errorbar函数来绘制。
6. 离散误差棒
有时候,数据点的x轴坐标是离散的,比如类别数据,Matplotlib也支持绘制离散误差棒。下面是一个示例代码:
import matplotlib.pyplot as plt

x = ['A', 'B', 'C', 'D', 'E']
y = [2, 3, 5, 7, 6]
errors = [0.5, 0.3, 0.4, 0.6, 0.2]

plt.errorbar(x, y, yerr=errors, fmt='o')
plt.show()
Output:
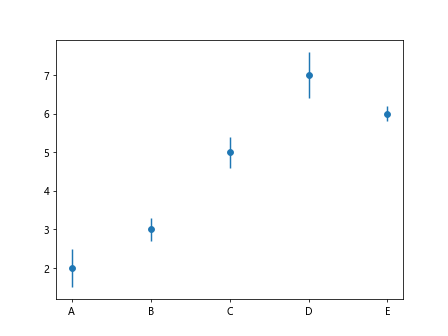
在上面的代码中,我们将x轴坐标改为类别数据,然后调用plt.errorbar函数绘制离散误差棒。
7. 区间误差棒
除了点到点的误差范围,Matplotlib还支持绘制区间误差棒,即指定一个区间范围。下面是一个示例代码:
import matplotlib.pyplot as plt

segments = [(1, 2, 3), (3, 4, 5), (5, 6, 7)]
x, ymin, ymax = zip(*segments)

plt.errorbar(x, y=None, yerr=[np.array(ymin), np.array(ymax)], fmt='o')
plt.show()
在上面的代码中,我们使用segments列表来表示每个区间的起始点、中间点和终止点,然后通过zip(*segments)将列表解压为三个分离的列表。最
“`
后,我们使用np.array将最小值和最大值转换为数组,并传递给`yerr`参数。
8. 自定义误差棒标签
有时候,我们需要在误差棒图中显示具体的误差数值,可以使用label参数来自定义误差棒标签。下面是一个示例代码:
import matplotlib.pyplot as plt

x = [1, 2, 3, 4, 5]
y = [2, 3, 5, 7, 6]
errors = [0.5, 0.3, 0.4, 0.6, 0.2]

plt.errorbar(x, y, yerr=errors, fmt='o', label='Error', errorevery=2)
plt.legend()
plt.show()
Output:
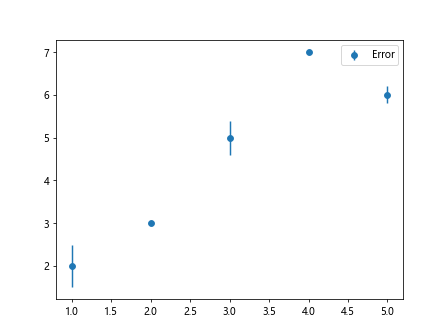
在上面的代码中,我们通过label参数指定了误差棒的标签名称,并使用errorevery参数来设置每隔多少个数据点显示一个误差棒。
9. 设置误差棒显示方向
Matplotlib还支持设置误差棒的显示方向,可以通过capthick参数设置误差棒的朝向。下面是一个示例代码:
import matplotlib.pyplot as plt

x = [1, 2, 3, 4, 5]
y = [2, 3, 5, 7, 6]
errors = [0.5, 0.3, 0.4, 0.6, 0.2]

plt.errorbar(x, y, yerr=errors, fmt='o', capthick=2, uplims=True)
plt.show()
Output:
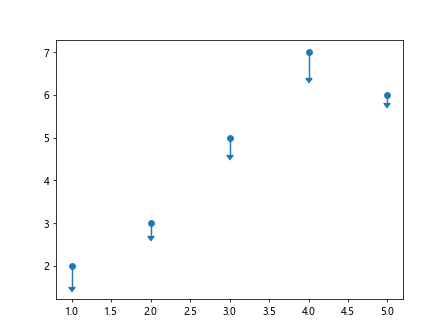
在上面的代码中,我们通过设置capthick参数来调整误差棒的线宽,并通过uplims=True来设置误差棒朝向上方。
10. 多种样式混合误差棒
有时候,我们需要在同一张图中展示多种样式的误差棒,比如纵向和横向,可以通过适当调整参数来实现。下面是一个示例代码:
import matplotlib.pyplot as plt

x = [1, 2, 3, 4, 5]
y = [2, 3, 5, 7, 6]
errors_y = [0.5, 0.3, 0.4, 0.6, 0.2]
errors_x = [0.2, 0.4, 0.3, 0.5, 0.1]

plt.errorbar(x, y, yerr=errors_y, xerr=errors_x, fmt='o', capsize=5)
plt.show()
Output:
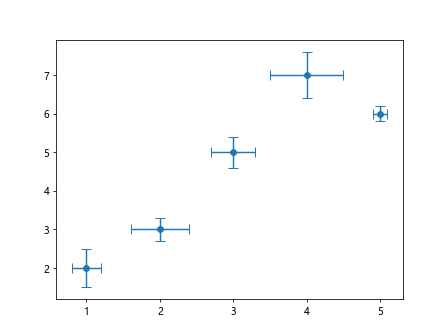
在上面的代码中,我们同时设置了y轴误差和x轴误差,并通过capsize参数调整误差棒的长度。
总结:Matplotlib提供了丰富的功能和参数来绘制各种类型的误差棒图,可以根据实际需求来选择合适的方法和样式。
 极客笔记
极客笔记