matplotlib绘图颜色
在使用matplotlib进行数据可视化时,颜色选择是非常重要的。正确选择适合的颜色可以使图表更具吸引力,并且更容易理解。在matplotlib中,我们可以通过多种方式指定颜色,包括使用颜色名称、RGB值、RGBA值、十六进制颜色代码等。
使用颜色名称
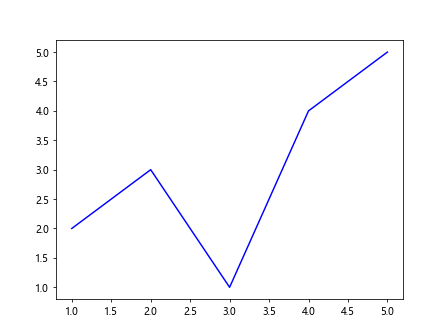
在matplotlib中,我们可以直接使用颜色名称来指定颜色。以下是一些常用的颜色名称:
import matplotlib.pyplot as plt

x = [1, 2, 3, 4, 5]
y = [2, 3, 1, 4, 5]

plt.plot(x, y, color='blue') # 蓝色
plt.show()
Output:
使用RGB值
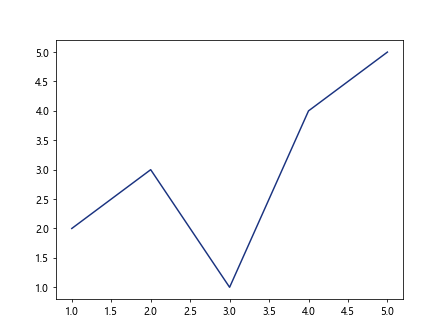
我们也可以使用RGB值来指定颜色。RGB值由三个整数值组成,分别表示红色、绿色和蓝色的分量。每个颜色分量的取值范围为0-1。
import matplotlib.pyplot as plt

x = [1, 2, 3, 4, 5]
y = [2, 3, 1, 4, 5]

plt.plot(x, y, color=(0.1, 0.2, 0.5)) # 自定义RGB值
plt.show()
Output:
使用RGBA值
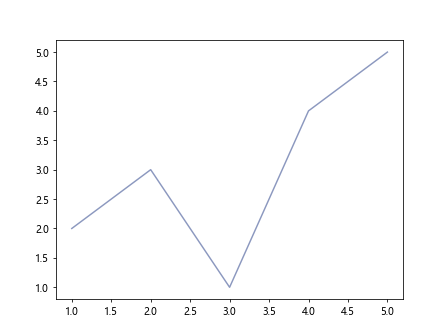
除了RGB值外,我们还可以使用RGBA值来指定颜色。RGBA值由四个浮点数值组成,分别表示红色、绿色、蓝色和透明度的分量。每个颜色分量的取值范围为0-1。
import matplotlib.pyplot as plt

x = [1, 2, 3, 4, 5]
y = [2, 3, 1, 4, 5]

plt.plot(x, y, color=(0.1, 0.2, 0.5, 0.5)) # 自定义RGBA值
plt.show()
Output:
使用十六进制颜色代码
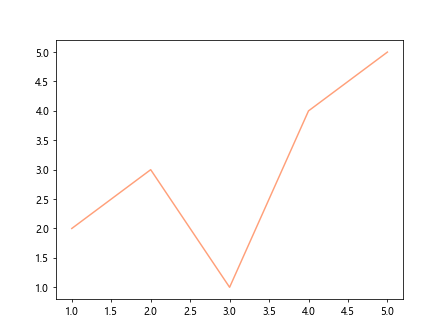
另一种指定颜色的方式是使用十六进制颜色代码。每种颜色都有对应的十六进制代码,我们可以直接使用这些代码来指定颜色。
import matplotlib.pyplot as plt

x = [1, 2, 3, 4, 5]
y = [2, 3, 1, 4, 5]

plt.plot(x, y, color='#FFA07A') # 桃色
plt.show()
Output:
自定义颜色映射
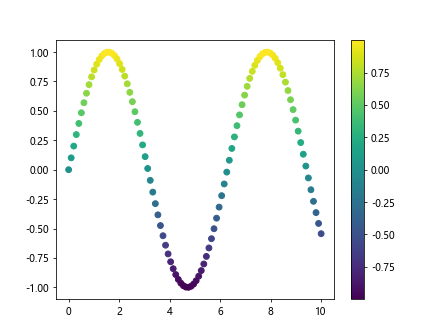
在某些情况下,我们需要根据数据值来动态调整颜色。这种情况下,我们可以使用colormap来实现颜色映射。
import numpy as np
import matplotlib.pyplot as plt

x = np.linspace(0, 10, 100)
y = np.sin(x)

plt.scatter(x, y, c=y, cmap='viridis') # 根据y值选择颜色,使用viridis colormap
plt.colorbar()
plt.show()
Output:
颜色循环
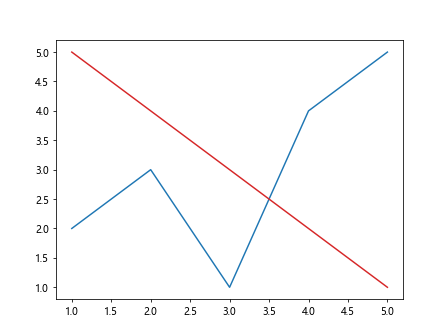
在绘制多个数据集时,我们通常希望每个数据集有不同的颜色以区分。matplotlib提供了一些默认的颜色循环,可以很方便地对数据集着色。
import matplotlib.pyplot as plt

x = [1, 2, 3, 4, 5]
y1 = [2, 3, 1, 4, 5]
y2 = [5, 4, 3, 2, 1]

plt.plot(x, y1, color='tab:blue') # 使用tab:blue着色
plt.plot(x, y2, color='tab:red') # 使用tab:red着色
plt.show()
Output:
调整线条颜色
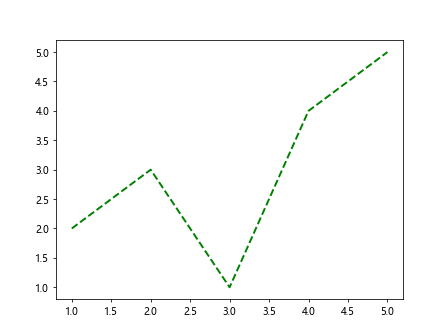
除了线条的颜色,我们也可以调整线条的样式和宽度。下面是一些调整线条颜色、样式和宽度的示例代码。
import matplotlib.pyplot as plt

x = [1, 2, 3, 4, 5]
y = [2, 3, 1, 4, 5]

plt.plot(x, y, color='green', linestyle='--', linewidth=2) # 绿色虚线,线宽2
plt.show()
Output:
调整散点图颜色
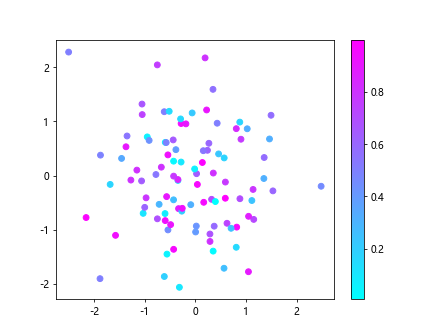
在绘制散点图时,我们可以使用不同的颜色来表示不同的数据点。以下是示例代码:
import numpy as np
import matplotlib.pyplot as plt

x = np.random.randn(100)
y = np.random.randn(100)
colors = np.random.rand(100) # 随机颜色

plt.scatter(x, y, c=colors, cmap='cool') # 使用cool colormap
plt.colorbar()
plt.show()
Output:
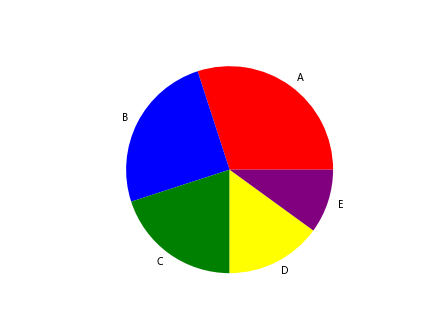
饼图颜色设置
绘制饼图时,我们也可以设置每个扇形的颜色。以下是示例代码:
import matplotlib.pyplot as plt

sizes = [30, 25, 20, 15, 10]
labels = ['A', 'B', 'C', 'D', 'E']
colors = ['red', 'blue', 'green', 'yellow', 'purple']

plt.pie(sizes, labels=labels, colors=colors)
plt.show()
Output:
箱线图颜色设置
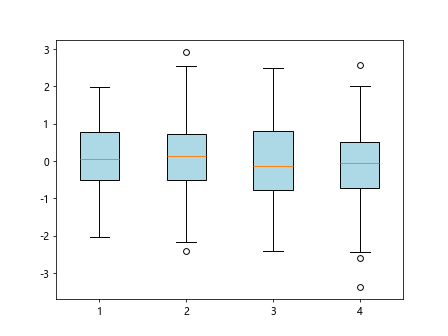
在绘制箱线图时,我们也可以设置不同箱体、中位数线和异常值的颜色。以下是示例代码:
import matplotlib.pyplot as plt
import numpy as np

data = np.random.randn(100, 4)

plt.boxplot(data, patch_artist=True, boxprops=dict(facecolor='lightblue')) # 箱体颜色设置为浅蓝色
plt.show()
Output:
绘制图例
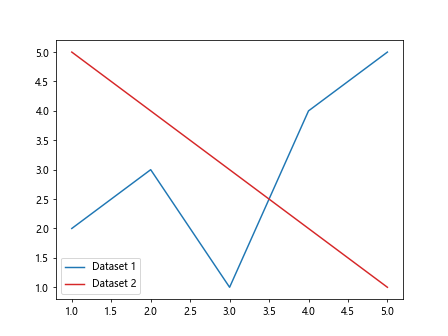
最后,在图表中添加图例是很重要的,可以帮助读者更好地理解数据。以下是示例代码:
import matplotlib.pyplot as plt

x = [1, 2, 3, 4, 5]
y1 = [2, 3, 1, 4, 5]
y2 = [5, 4, 3, 2, 1]

plt.plot(x, y1, color='tab:blue', label='Dataset 1') # 数据集1
plt.plot(x, y2, color='tab:red', label='Dataset 2') # 数据集2
plt.legend()
plt.show()
Output:
通过以上示例代码,我们可以看到在matplotlib中如何灵活地设置图表的颜色,从而创建出更具吸引力和可读性的数据可视化图表。
 极客笔记
极客笔记