Matplotlib 线型选项详解
参考:matplotlib linestyle options
matplotlib linestyle options
Matplotlib 是 Python 中最流行的数据可视化库之一,它提供了丰富的绘图功能和选项。其中,线型(linestyle)是绘制线图时非常重要的一个属性,它可以帮助我们区分不同的数据系列,突出重要信息,或者simply美化图表。本文将深入探讨 Matplotlib 中的线型选项,包括其基本用法、高级技巧以及实际应用场景。
1. 基本线型选项
Matplotlib 提供了多种预定义的线型选项,可以通过字符串或元组来指定。最常用的线型包括实线、虚线、点线等。
1.1 使用字符串指定线型
最简单的方式是使用字符串来指定线型。以下是一些常用的线型字符串:
- ‘-‘:实线
- ‘–‘:虚线
- ‘-.’:点划线
- ‘:’:点线
- ‘ ‘:无线(只有标记)
让我们来看一个使用不同线型的示例:
import matplotlib.pyplot as plt
import numpy as np

x = np.linspace(0, 10, 100)
y1 = np.sin(x)
y2 = np.cos(x)
y3 = np.tan(x)
y4 = np.exp(-x/10)

plt.figure(figsize=(10, 6))
plt.plot(x, y1, linestyle='-', label='Solid')
plt.plot(x, y2, linestyle='--', label='Dashed')
plt.plot(x, y3, linestyle='-.', label='Dash-dot')
plt.plot(x, y4, linestyle=':', label='Dotted')

plt.title('Different Line Styles in Matplotlib - how2matplotlib.com')
plt.xlabel('X-axis')
plt.ylabel('Y-axis')
plt.legend()
plt.grid(True)
plt.show()

print("The plot has been displayed.")
Output:
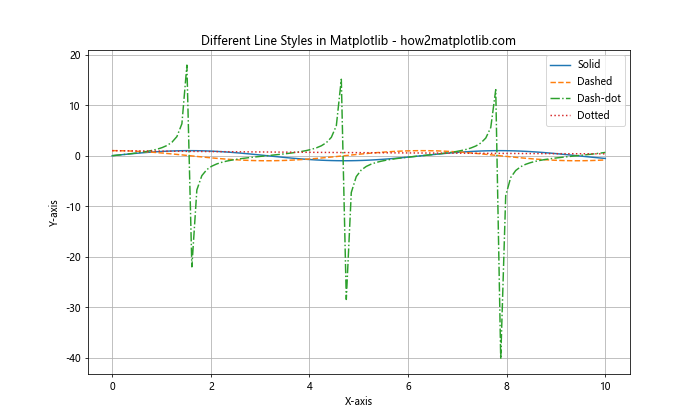
在这个示例中,我们绘制了四条不同线型的曲线。通过 linestyle 参数,我们分别指定了实线、虚线、点划线和点线。这样可以清晰地区分不同的数据系列。
1.2 使用元组指定线型
除了使用字符串,我们还可以使用元组来更精细地控制线型。元组的格式为 (offset, (on, off, on, off, ...)):
offset:线段模式的偏移量on:可见线段的长度off:不可见线段的长度
以下是一个使用元组指定线型的示例:
import matplotlib.pyplot as plt
import numpy as np

x = np.linspace(0, 10, 100)
y = np.sin(x)

plt.figure(figsize=(12, 8))
plt.plot(x, y + 0, linestyle=(0, (1, 1)), label='(0, (1, 1))')
plt.plot(x, y + 1, linestyle=(0, (5, 1)), label='(0, (5, 1))')
plt.plot(x, y + 2, linestyle=(0, (5, 5)), label='(0, (5, 5))')
plt.plot(x, y + 3, linestyle=(0, (5, 1, 1, 1)), label='(0, (5, 1, 1, 1))')
plt.plot(x, y + 4, linestyle=(0, (3, 5, 1, 5)), label='(0, (3, 5, 1, 5))')

plt.title('Custom Line Styles using Tuples - how2matplotlib.com')
plt.xlabel('X-axis')
plt.ylabel('Y-axis')
plt.legend()
plt.grid(True)
plt.show()

print("The plot with custom line styles has been displayed.")
Output:
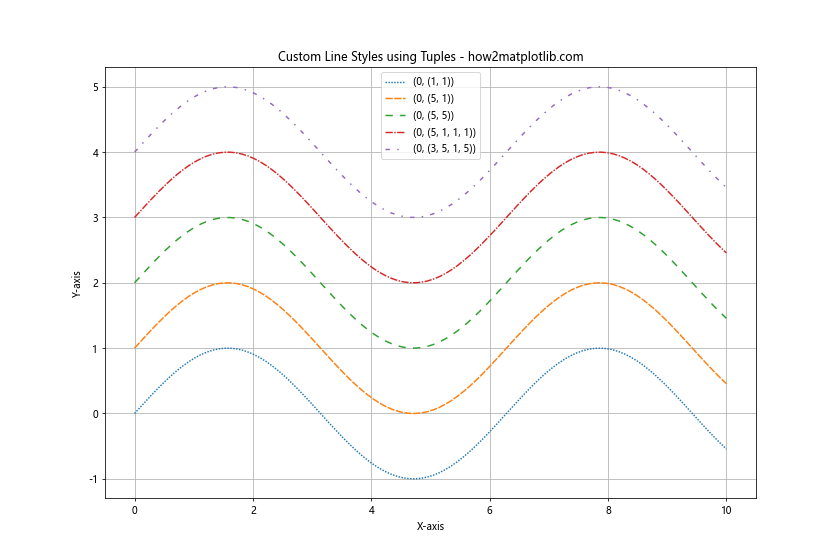
在这个示例中,我们使用元组来定义了五种不同的自定义线型。这种方法允许我们创建更复杂和独特的线型,以满足特定的可视化需求。
2. 线型与颜色的结合
线型和颜色的结合可以进一步增强图表的可读性和美观性。Matplotlib 允许我们同时指定线型和颜色。
import matplotlib.pyplot as plt
import numpy as np

x = np.linspace(0, 10, 100)
y1 = np.sin(x)
y2 = np.cos(x)
y3 = np.tan(x)

plt.figure(figsize=(10, 6))
plt.plot(x, y1, linestyle='-', color='red', label='Sin (Solid Red)')
plt.plot(x, y2, linestyle='--', color='blue', label='Cos (Dashed Blue)')
plt.plot(x, y3, linestyle='-.', color='green', label='Tan (Dash-dot Green)')

plt.title('Line Styles and Colors - how2matplotlib.com')
plt.xlabel('X-axis')
plt.ylabel('Y-axis')
plt.legend()
plt.grid(True)
plt.show()

print("The plot with different line styles and colors has been displayed.")
Output:
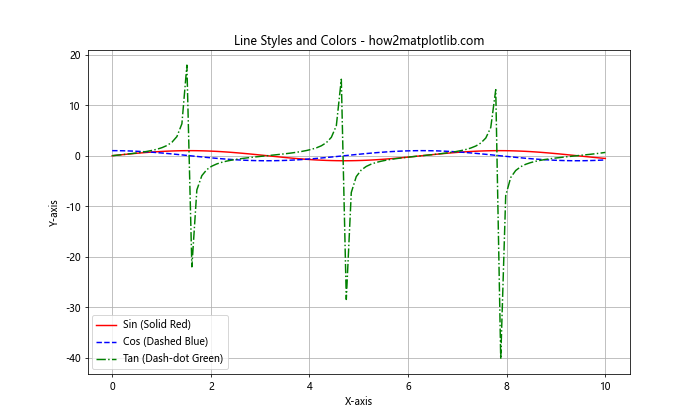
在这个示例中,我们为每条线同时指定了线型和颜色。这种组合可以帮助观众更容易地区分和理解不同的数据系列。
3. 线宽与线型
线宽是另一个可以与线型结合使用的重要属性。通过调整线宽,我们可以强调某些数据系列或创造层次感。
import matplotlib.pyplot as plt
import numpy as np

x = np.linspace(0, 10, 100)
y = np.sin(x)

plt.figure(figsize=(12, 8))
plt.plot(x, y + 0, linestyle='-', linewidth=1, label='Solid (width 1)')
plt.plot(x, y + 1, linestyle='--', linewidth=2, label='Dashed (width 2)')
plt.plot(x, y + 2, linestyle='-.', linewidth=3, label='Dash-dot (width 3)')
plt.plot(x, y + 3, linestyle=':', linewidth=4, label='Dotted (width 4)')

plt.title('Line Styles with Different Widths - how2matplotlib.com')
plt.xlabel('X-axis')
plt.ylabel('Y-axis')
plt.legend()
plt.grid(True)
plt.show()

print("The plot with different line styles and widths has been displayed.")
Output:
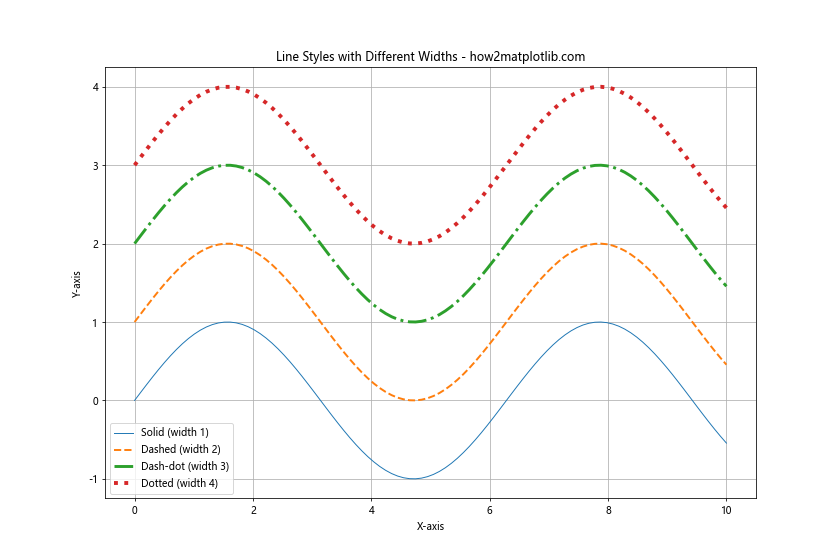
在这个示例中,我们展示了如何结合使用线型和线宽。通过增加线宽,我们可以使某些线条更加突出,这在展示重要数据或趋势时特别有用。
4. 自定义虚线样式
Matplotlib 还允许我们自定义虚线的样式,包括破折号的长度和间隔。这可以通过 dashes 参数来实现。
import matplotlib.pyplot as plt
import numpy as np

x = np.linspace(0, 10, 100)
y = np.sin(x)

plt.figure(figsize=(12, 8))
plt.plot(x, y + 0, linestyle='--', dashes=(5, 2), label='Dashes (5, 2)')
plt.plot(x, y + 1, linestyle='--', dashes=(10, 2, 2, 2), label='Dashes (10, 2, 2, 2)')
plt.plot(x, y + 2, linestyle='--', dashes=(5, 1, 1, 1), label='Dashes (5, 1, 1, 1)')
plt.plot(x, y + 3, linestyle='--', dashes=(3, 3, 1, 3), label='Dashes (3, 3, 1, 3)')

plt.title('Custom Dash Styles - how2matplotlib.com')
plt.xlabel('X-axis')
plt.ylabel('Y-axis')
plt.legend()
plt.grid(True)
plt.show()

print("The plot with custom dash styles has been displayed.")
Output:
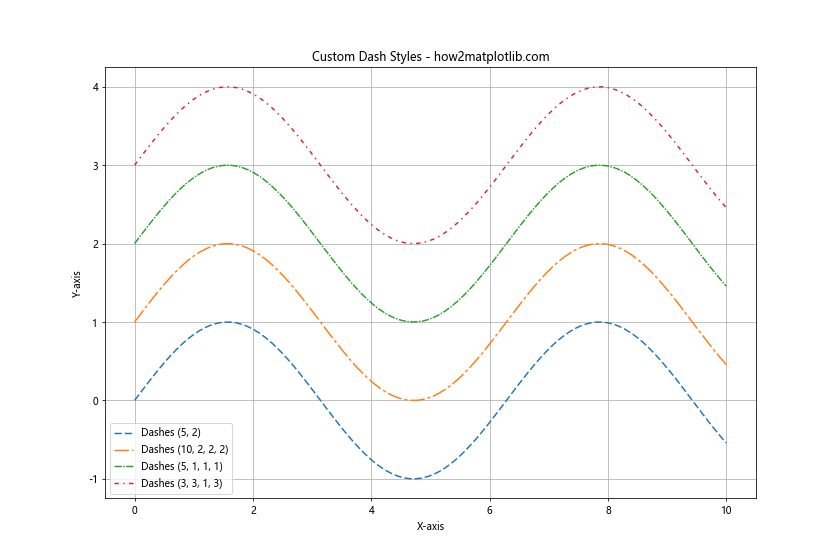
在这个示例中,我们使用 dashes 参数创建了四种不同的自定义虚线样式。这种方法提供了更大的灵活性,允许我们创建独特的线型来满足特定的可视化需求。
5. 线型循环
当绘制多条线时,我们可能希望自动循环使用不同的线型。这可以通过设置 plt.rcParams['axes.prop_cycle'] 来实现。
import matplotlib.pyplot as plt
import numpy as np
import cycler

x = np.linspace(0, 10, 100)
y1 = np.sin(x)
y2 = np.cos(x)
y3 = np.tan(x)
y4 = np.exp(-x/10)

plt.rcParams['axes.prop_cycle'] = cycler.cycler(linestyle=['-', '--', '-.', ':'])

plt.figure(figsize=(10, 6))
plt.plot(x, y1, label='Sin')
plt.plot(x, y2, label='Cos')
plt.plot(x, y3, label='Tan')
plt.plot(x, y4, label='Exp')

plt.title('Automatic Line Style Cycling - how2matplotlib.com')
plt.xlabel('X-axis')
plt.ylabel('Y-axis')
plt.legend()
plt.grid(True)
plt.show()

print("The plot with automatic line style cycling has been displayed.")
Output:
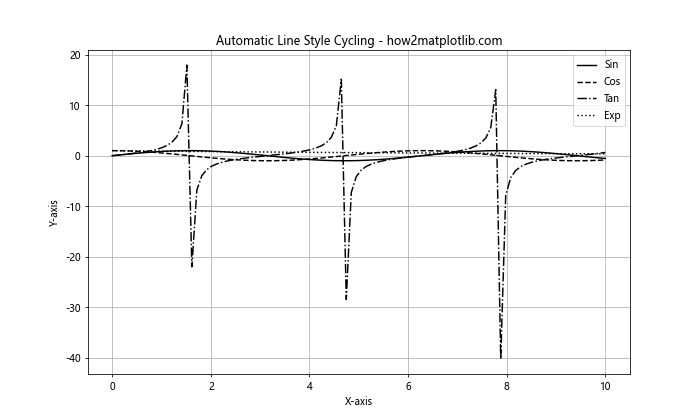
在这个示例中,我们设置了一个线型循环,使得每条新的线自动使用不同的线型。这在绘制多条线时特别有用,可以自动区分不同的数据系列。
6. 线型与标记的结合
线型可以与标记(markers)结合使用,以增强数据点的可见性。这在数据点稀疏或需要强调特定点时特别有用。
import matplotlib.pyplot as plt
import numpy as np

x = np.linspace(0, 10, 20)
y1 = np.sin(x)
y2 = np.cos(x)
y3 = np.tan(x)

plt.figure(figsize=(12, 8))
plt.plot(x, y1, linestyle='-', marker='o', label='Sin (Line with Circles)')
plt.plot(x, y2, linestyle='--', marker='s', label='Cos (Dashed with Squares)')
plt.plot(x, y3, linestyle='-.', marker='^', label='Tan (Dash-dot with Triangles)')

plt.title('Line Styles with Markers - how2matplotlib.com')
plt.xlabel('X-axis')
plt.ylabel('Y-axis')
plt.legend()
plt.grid(True)
plt.show()

print("The plot with line styles and markers has been displayed.")
Output:
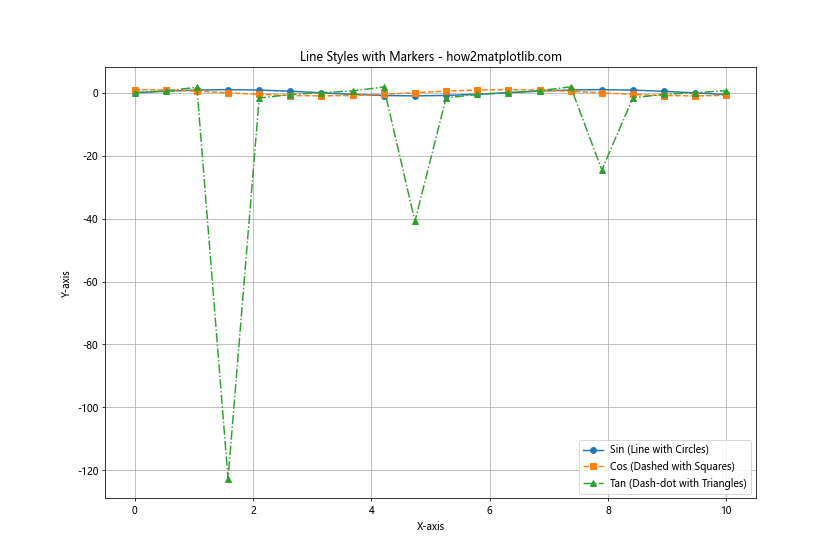
在这个示例中,我们为每条线添加了不同的标记。这不仅使得线型更加丰富,还能帮助读者更容易地识别具体的数据点。
7. 线型在填充区域中的应用
线型不仅可以用于绘制线条,还可以用于填充区域的边界。这在创建阴影区域或强调某些范围时非常有用。
import matplotlib.pyplot as plt
import numpy as np

x = np.linspace(0, 10, 100)
y1 = np.sin(x)
y2 = np.cos(x)

plt.figure(figsize=(12, 8))
plt.fill_between(x, y1, y2, where=(y1 > y2), alpha=0.3, linestyle='--', edgecolor='r', facecolor='r', label='Sin > Cos')
plt.fill_between(x, y1, y2, where=(y1 <= y2), alpha=0.3, linestyle='-.', edgecolor='b', facecolor='b', label='Sin <= Cos')

plt.plot(x, y1, label='Sin')
plt.plot(x, y2, label='Cos')

plt.title('Filled Areas with Different Line Styles - how2matplotlib.com')
plt.xlabel('X-axis')
plt.ylabel('Y-axis')
plt.legend()
plt.grid(True)
plt.show()

print("The plot with filled areas and different line styles has been displayed.")
Output:
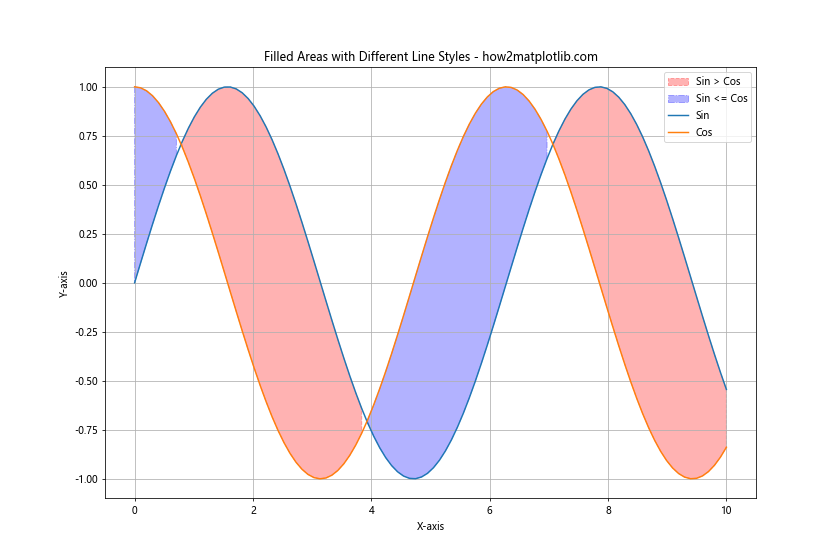
在这个示例中,我们使用 fill_between 函数创建了两个填充区域,并为它们的边界指定了不同的线型。这种技术可以用来强调数据的不同区域或展示数据的范围。
8. 在柱状图中使用线型
虽然线型主要用于线图,但它们也可以应用于其他类型的图表,如柱状图的边框。这可以帮助区分不同组的数据或增加图表的视觉吸引力。
import matplotlib.pyplot as plt
import numpy as np

categories = ['A', 'B', 'C', 'D']
values = [4, 7, 2, 8]

plt.figure(figsize=(10, 6))
bars = plt.bar(categories, values, edgecolor='black', linewidth=2)

# 为每个柱子设置不同的线型
linestyles = ['-', '--', '-.', ':']
for bar, linestyle in zip(bars, linestyles):
    bar.set_linestyle(linestyle)

plt.title('Bar Chart with Different Edge Line Styles - how2matplotlib.com')
plt.xlabel('Categories')
plt.ylabel('Values')
plt.show()

print("The bar chart with different edge line styles has been displayed.")
Output:
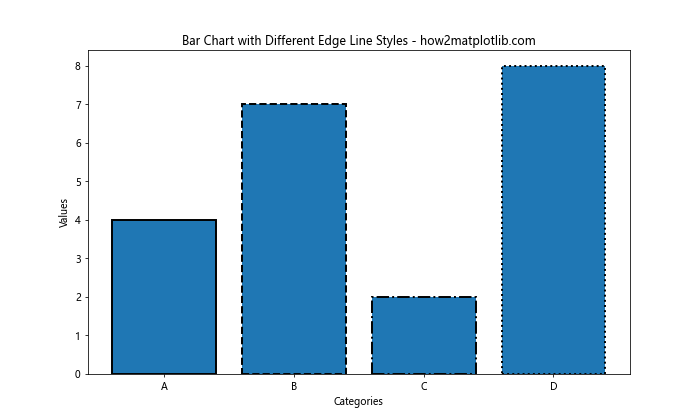
在这个示例中,我们创建了一个柱状图,并为每个柱子的边缘设置了不同的线型。这种技术可以用来增加柱状图的视觉多样性,或者区分不同类别的数据。
9. 在极坐标图中使用线型
线型选项也可以应用于极坐标图,这在展示周期性数据或角度相关数据时特别有用。
import matplotlib.pyplot as plt
import numpy as np

theta = np.linspace(0, 2*np.pi, 100)
r1 = np.sin(theta)
r2 = np.cos(theta)
r3 = np.sin(2*theta)

plt.figure(figsize=(10, 10))
ax = plt.subplot(111, projection='polar')
ax.plot(theta, r1, linestyle='-', label='Sin')ax.plot(theta, r2, linestyle='--', label='Cos')
ax.plot(theta, r3, linestyle='-.', label='Sin(2θ)')

plt.title('Polar Plot with Different Line Styles - how2matplotlib.com')
plt.legend(loc='upper left', bbox_to_anchor=(1.05, 1))
plt.show()

print("The polar plot with different line styles has been displayed.")
在这个极坐标图示例中,我们使用不同的线型来绘制三个不同的函数。这种方法可以帮助我们在极坐标系中更好地区分和比较不同的数据系列。
10. 动态改变线型
在某些情况下,我们可能需要根据数据的特征动态地改变线型。例如,我们可以根据数据的值来改变线型,以突出显示某些特定的数据范围。
import matplotlib.pyplot as plt
import numpy as np

x = np.linspace(0, 10, 1000)
y = np.sin(x)

fig, ax = plt.subplots(figsize=(12, 6))

# 分段绘制,根据y值的正负使用不同的线型
ax.plot(x[y>=0], y[y>=0], linestyle='-', color='blue', label='Positive')
ax.plot(x[y<0], y[y<0], linestyle='--', color='red', label='Negative')

plt.title('Dynamic Line Style Change - how2matplotlib.com')
plt.xlabel('X-axis')
plt.ylabel('Y-axis')
plt.legend()
plt.grid(True)
plt.show()

print("The plot with dynamic line style changes has been displayed.")
Output:
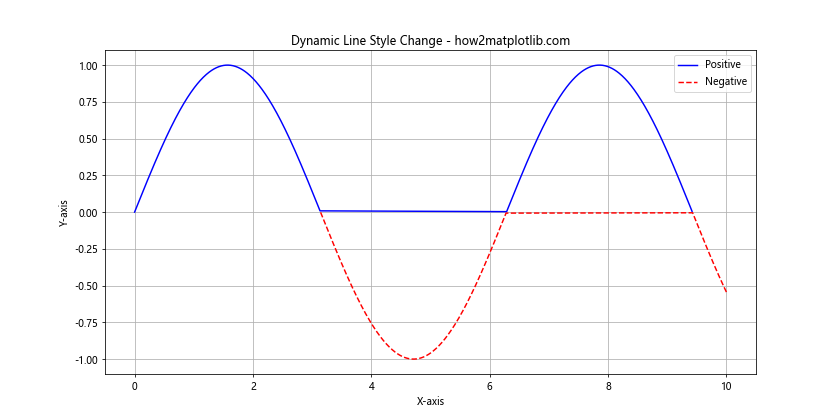
在这个示例中,我们根据 y 值的正负来动态改变线型。这种技术可以用来突出显示数据的某些特征,如正值和负值的区别。
11. 在误差线中使用线型
线型选项也可以应用于误差线(error bars),这在展示数据的不确定性时非常有用。
import matplotlib.pyplot as plt
import numpy as np

x = np.linspace(0, 10, 10)
y = np.sin(x)
error = np.random.rand(10) * 0.2

plt.figure(figsize=(12, 6))
plt.errorbar(x, y, yerr=error, fmt='o', linestyle='--', capsize=5, capthick=2, label='Data with Error')

plt.title('Error Bars with Custom Line Style - how2matplotlib.com')
plt.xlabel('X-axis')
plt.ylabel('Y-axis')
plt.legend()
plt.grid(True)
plt.show()

print("The plot with error bars and custom line style has been displayed.")
Output:
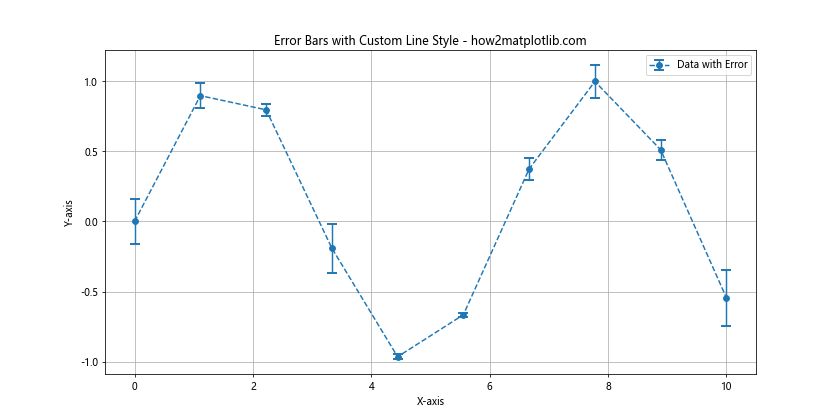
在这个示例中,我们使用虚线样式来绘制误差线。这不仅可以使误差线与数据点区分开来,还可以增加图表的整体美观性。
12. 在箱线图中使用线型
虽然箱线图主要由盒子和须组成,但我们也可以使用线型选项来自定义其外观。
import matplotlib.pyplot as plt
import numpy as np

data = [np.random.normal(0, std, 100) for std in range(1, 4)]

fig, ax = plt.subplots(figsize=(10, 6))
box_plot = ax.boxplot(data, patch_artist=True)

for element in ['boxes', 'whiskers', 'fliers', 'means', 'medians', 'caps']:
    plt.setp(box_plot[element], linestyle='--')

plt.title('Box Plot with Custom Line Style - how2matplotlib.com')
plt.xlabel('Groups')
plt.ylabel('Values')
plt.show()

print("The box plot with custom line style has been displayed.")
Output:
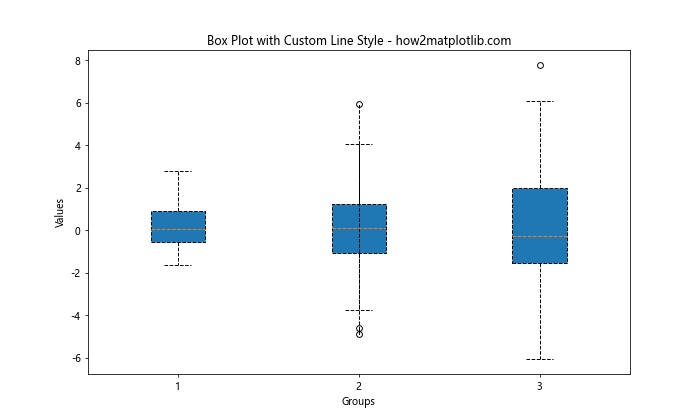
在这个示例中,我们将箱线图的所有线条元素设置为虚线样式。这种技术可以用来增加箱线图的视觉吸引力,或者区分不同的数据集。
13. 在等高线图中使用线型
等高线图是另一种可以应用线型选项的图表类型。不同的线型可以用来区分不同的等高线级别。
import matplotlib.pyplot as plt
import numpy as np

def f(x, y):
    return np.sin(np.sqrt(x ** 2 + y ** 2))

x = np.linspace(-6, 6, 30)
y = np.linspace(-6, 6, 30)
X, Y = np.meshgrid(x, y)
Z = f(X, Y)

plt.figure(figsize=(12, 10))
CS = plt.contour(X, Y, Z, levels=15, linestyles=['-', '--', '-.', ':'])
plt.clabel(CS, inline=True, fontsize=10)
plt.title('Contour Plot with Different Line Styles - how2matplotlib.com')
plt.xlabel('X-axis')
plt.ylabel('Y-axis')
plt.colorbar(CS)
plt.show()

print("The contour plot with different line styles has been displayed.")
Output:
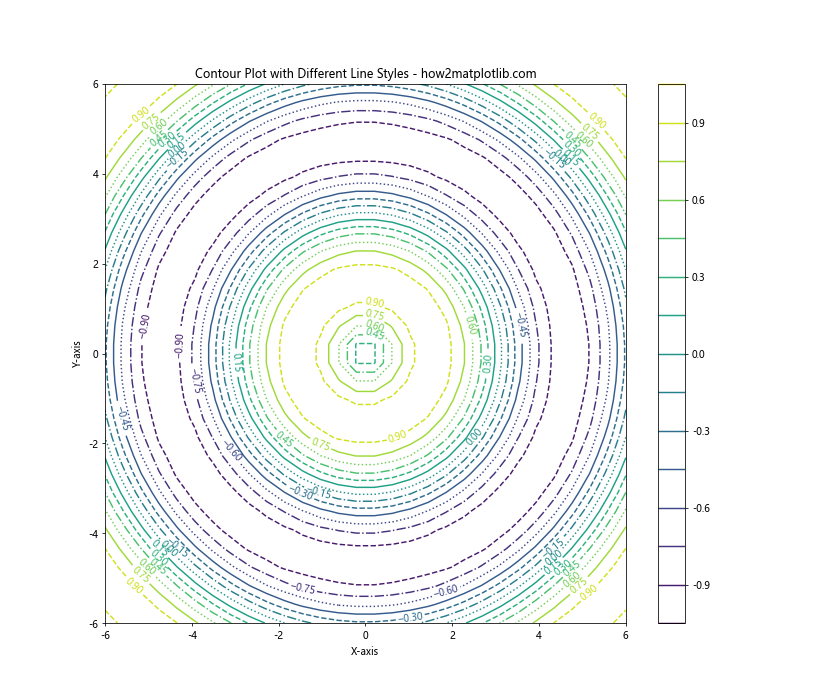
在这个等高线图示例中,我们使用了四种不同的线型来绘制等高线。这种方法可以帮助读者更容易地区分不同的等高线级别。
14. 在 3D 图中使用线型
线型选项也可以应用于 3D 图表,这可以帮助我们在三维空间中更好地区分不同的数据系列。
import matplotlib.pyplot as plt
import numpy as np

fig = plt.figure(figsize=(12, 8))
ax = fig.add_subplot(111, projection='3d')

t = np.linspace(0, 20, 100)
x = np.sin(t)
y = np.cos(t)
z = t

ax.plot(x, y, z, label='Spiral', linestyle='-')
ax.plot(x, y, -z, label='Inverse Spiral', linestyle='--')

ax.set_xlabel('X-axis')
ax.set_ylabel('Y-axis')
ax.set_zlabel('Z-axis')
ax.legend()
plt.title('3D Plot with Different Line Styles - how2matplotlib.com')
plt.show()

print("The 3D plot with different line styles has been displayed.")
Output:
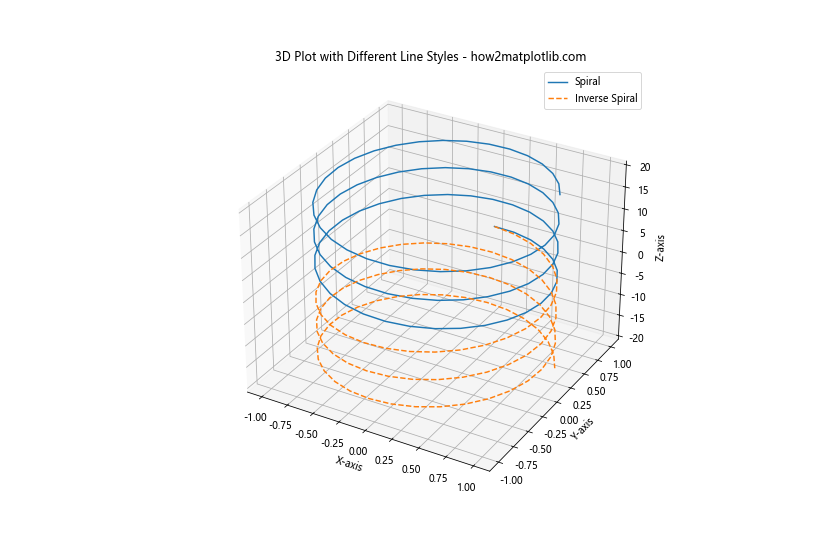
在这个 3D 图示例中,我们使用不同的线型来绘制两个螺旋线。这种技术可以帮助我们在复杂的三维空间中更好地区分和比较不同的数据系列。
15. 在时间序列图中使用线型
在时间序列数据的可视化中,线型可以用来区分不同的时间段或数据特征。
import matplotlib.pyplot as plt
import numpy as np
import pandas as pd

dates = pd.date_range(start='2023-01-01', end='2023-12-31', freq='D')
data = np.cumsum(np.random.randn(len(dates)))

plt.figure(figsize=(14, 6))
plt.plot(dates[:180], data[:180], linestyle='-', label='First Half')
plt.plot(dates[180:], data[180:], linestyle='--', label='Second Half')

plt.title('Time Series with Different Line Styles - how2matplotlib.com')
plt.xlabel('Date')
plt.ylabel('Cumulative Sum')
plt.legend()
plt.grid(True)
plt.show()

print("The time series plot with different line styles has been displayed.")
Output:
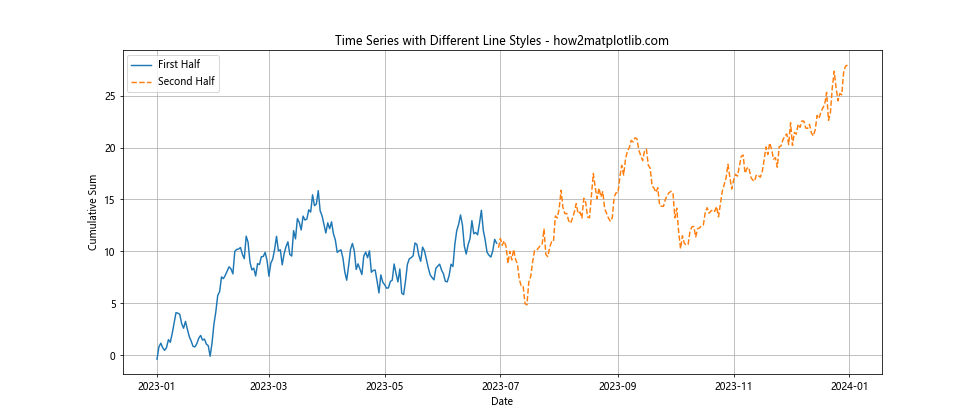
在这个时间序列图示例中,我们使用不同的线型来区分年份的上半年和下半年。这种方法可以帮助观众更容易地识别数据的不同时期或阶段。
16. 在散点图中使用线型连接点
虽然散点图主要用于显示离散的数据点,但有时我们可能希望用线连接这些点以显示趋势或顺序。
import matplotlib.pyplot as plt
import numpy as np

x = np.linspace(0, 10, 20)
y = np.sin(x) + np.random.normal(0, 0.1, 20)

plt.figure(figsize=(12, 6))
plt.plot(x, y, 'o', linestyle='-', label='Connected Points')
plt.plot(x, y, 'o', linestyle='', label='Scatter Points')

plt.title('Scatter Plot with Connected Points - how2matplotlib.com')
plt.xlabel('X-axis')
plt.ylabel('Y-axis')
plt.legend()
plt.grid(True)
plt.show()

print("The scatter plot with connected points has been displayed.")
Output:
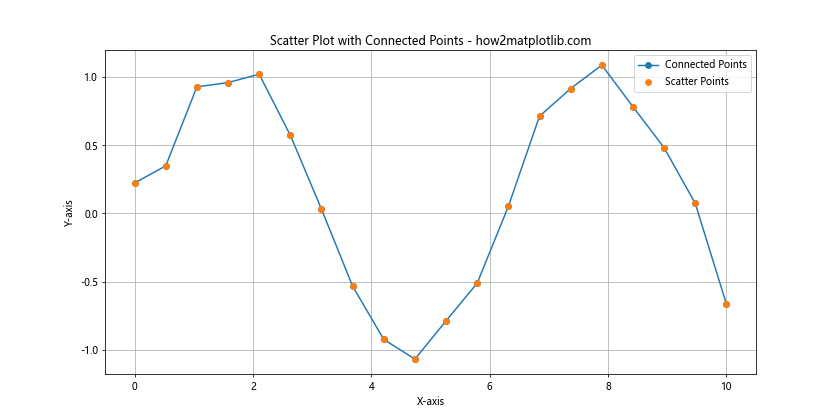
在这个示例中,我们首先绘制了带有连接线的散点图,然后又绘制了一个没有连接线的散点图。这种方法可以同时展示数据的离散特性和整体趋势。
17. 在阶梯图中使用线型
阶梯图是另一种可以应用线型选项的图表类型。不同的线型可以用来区分不同的数据系列或强调某些特定的阶梯。
import matplotlib.pyplot as plt
import numpy as np

x = np.linspace(0, 10, 15)
y1 = np.sin(x)
y2 = np.cos(x)

plt.figure(figsize=(12, 6))
plt.step(x, y1, where='pre', linestyle='-', label='Sin (pre)')
plt.step(x, y2, where='post', linestyle='--', label='Cos (post)')

plt.title('Step Plot with Different Line Styles - how2matplotlib.com')
plt.xlabel('X-axis')
plt.ylabel('Y-axis')
plt.legend()
plt.grid(True)
plt.show()

print("The step plot with different line styles has been displayed.")
Output:
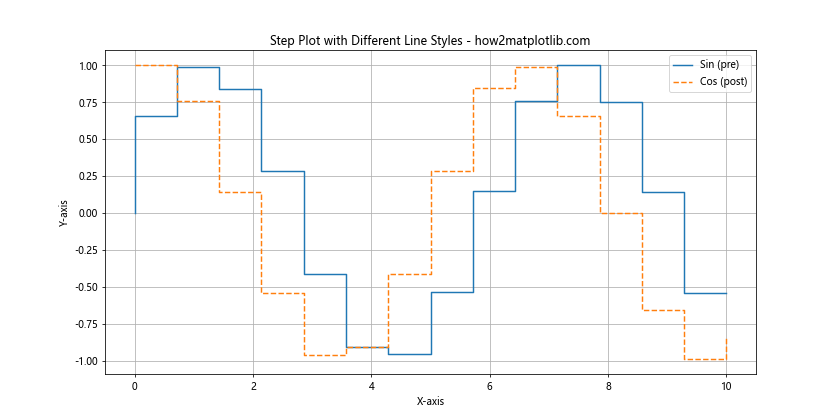
在这个阶梯图示例中,我们使用不同的线型来绘制两个不同的函数。这种方法不仅可以区分不同的数据系列,还可以强调阶梯图的特性。
18. 在堆叠图中使用线型
堆叠图通常用于显示多个数据系列的累积效果,但我们也可以使用线型来增强其可读性。
import matplotlib.pyplot as plt
import numpy as np

x = np.linspace(0, 10, 100)
y1 = np.sin(x)
y2 = np.cos(x) + 1
y3 = np.tan(x) + 2

plt.figure(figsize=(12, 6))
plt.fill_between(x, 0, y1, alpha=0.3, label='Sin')
plt.fill_between(x, y1, y2, alpha=0.3, label='Cos')
plt.fill_between(x, y2, y3, alpha=0.3, label='Tan')

plt.plot(x, y1, linestyle='-')
plt.plot(x, y2, linestyle='--')
plt.plot(x, y3, linestyle='-.')

plt.title('Stacked Plot with Different Line Styles - how2matplotlib.com')
plt.xlabel('X-axis')
plt.ylabel('Y-axis')
plt.legend()
plt.grid(True)
plt.show()

print("The stacked plot with different line styles has been displayed.")
Output:
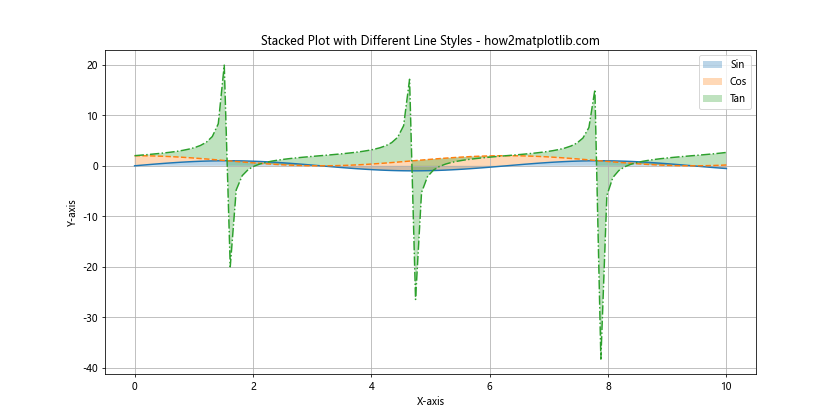
在这个堆叠图示例中,我们使用不同的线型来绘制每个数据系列的上边界。这种方法可以帮助读者更清晰地识别每个数据系列的贡献。
19. 在热图中使用线型
虽然热图主要用颜色来表示数据值,但我们可以使用线型来划分热图的不同区域或强调某些特定的单元格。
import matplotlib.pyplot as plt
import numpy as np

data = np.random.rand(10, 10)

plt.figure(figsize=(10, 8))
heatmap = plt.imshow(data, cmap='viridis')

# 添加网格线
for i in range(10):
    plt.axhline(y=i-0.5, color='white', linestyle='--', linewidth=0.5)
    plt.axvline(x=i-0.5, color='white', linestyle='--', linewidth=0.5)

plt.colorbar(heatmap)
plt.title('Heatmap with Grid Lines - how2matplotlib.com')
plt.xlabel('X-axis')
plt.ylabel('Y-axis')
plt.show()

print("The heatmap with grid lines has been displayed.")
Output:
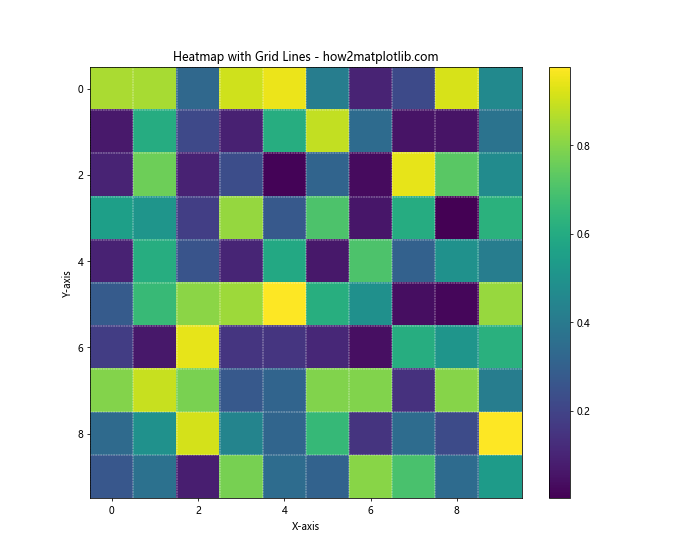
在这个热图示例中,我们使用虚线来绘制网格,以便更容易地区分热图中的各个单元格。这种方法可以增加热图的可读性,尤其是在数据密集的情况下。
20. 在雷达图中使用线型
雷达图(也称为蜘蛛图或星图)是另一种可以应用线型选项的图表类型。不同的线型可以用来区分不同的数据系列或强调某些特定的轴。
import matplotlib.pyplot as plt
import numpy as np

categories = ['A', 'B', 'C', 'D', 'E', 'F']
values1 = [4, 3, 5, 2, 4, 3]
values2 = [3, 4, 2, 5, 3, 4]

angles = np.linspace(0, 2*np.pi, len(categories), endpoint=False)
values1 = np.concatenate((values1, [values1[0]]))  # 闭合多边形
values2 = np.concatenate((values2, [values2[0]]))
angles = np.concatenate((angles, [angles[0]]))  # 闭合多边形

fig, ax = plt.subplots(figsize=(8, 8), subplot_kw=dict(projection='polar'))
ax.plot(angles, values1, 'o-', linewidth=2, label='Series 1')
ax.plot(angles, values2, 's--', linewidth=2, label='Series 2')
ax.set_thetagrids(angles[:-1] * 180/np.pi, categories)

ax.set_ylim(0, 6)
plt.title('Radar Chart with Different Line Styles - how2matplotlib.com')
plt.legend(loc='upper right', bbox_to_anchor=(1.3, 1.1))
plt.show()

print("The radar chart with different line styles has been displayed.")
Output:
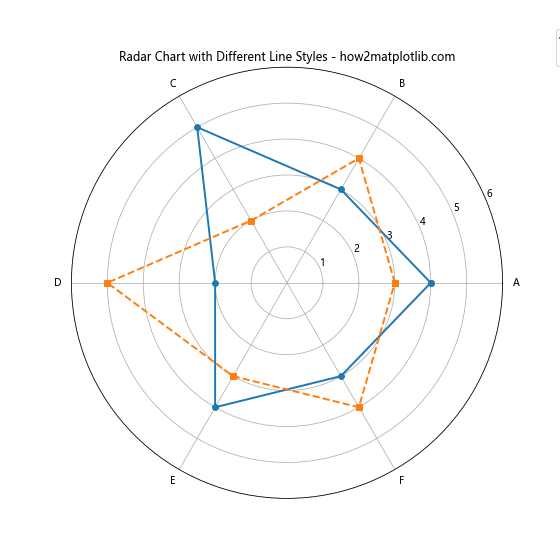
在这个雷达图示例中,我们使用不同的线型和标记来绘制两个数据系列。这种方法可以帮助读者更容易地区分和比较不同的数据系列。
总结
通过以上详细的探讨和丰富的示例,我们可以看到 Matplotlib 中线型选项的强大和灵活性。线型不仅仅是简单的视觉元素,它们是数据可视化中的重要工具,可以帮助我们更有效地传达信息、区分数据系列、突出重要趋势,并增强图表的整体美观性。
以下是一些关于使用线型的关键点:
- 基本线型:Matplotlib 提供了多种预定义的线型,如实线、虚线、点划线等,可以通过简单的字符串指定。
-
自定义线型:通过使用元组或
dashes参数,我们可以创建更复杂和独特的线型。 -
线型与其他属性的结合:线型可以与颜色、线宽、标记等其他属性结合使用,以创建更丰富的视觉效果。
-
动态线型:我们可以根据数据的特征动态地改变线型,以突出显示某些特定的数据范围或特征。
-
应用范围广泛:线型不仅可以用于基本的线图,还可以应用于各种其他类型的图表,如柱状图、散点图、等高线图、3D 图等。
-
增强可读性:合理使用线型可以显著提高图表的可读性,帮助观众更容易地理解和解释数据。
-
美化图表:不同的线型可以增加图表的视觉吸引力,使其更加美观和专业。
-
区分数据系列:在绘制多个数据系列时,不同的线型可以帮助有效地区分它们。
-
强调重要信息:通过使用特殊的线型,我们可以强调图表中的重要数据或趋势。
-
适应不同的图表类型:从简单的线图到复杂的 3D 图表,线型选项都可以灵活应用,以满足不同类型图表的需求。
在实际应用中,选择合适的线型需要考虑多个因素,包括数据的性质、图表的目的、目标受众等。一个好的做法是尝试不同的线型组合,并根据实际效果进行调整。同时,也要注意不要过度使用不同的线型,以免使图表变得混乱或难以理解。
最后,值得注意的是,Matplotlib 的线型选项是一个不断发展的特性。随着新版本的发布,可能会有新的线型选项或相关功能出现。因此,建议定期查看 Matplotlib 的官方文档,以了解最新的功能和最佳实践。
通过掌握和灵活运用这些线型选项,我们可以创建更加丰富、清晰和专业的数据可视化作品,更好地展示和分析数据,为观众提供更深入的洞察。无论是在科学研究、商业分析还是日常数据展示中,熟练运用 Matplotlib 的线型选项都将是一项宝贵的技能。
进阶技巧和注意事项
在深入理解和广泛应用 Matplotlib 的线型选项后,以下是一些进阶技巧和注意事项,可以帮助你更好地利用这一功能:
- 性能考虑:在处理大量数据点时,复杂的线型可能会影响绘图性能。在这种情况下,可以考虑使用简单的线型或降低数据点的密度。
-
可访问性:在设计图表时,要考虑色盲用户。不同的线型可以帮助这些用户区分不同的数据系列,而不仅仅依赖于颜色。
-
导出和打印:某些复杂的线型在导出为某些格式(如 PDF)或打印时可能会出现问题。在最终发布前,务必检查不同格式下的效果。
-
动画中的线型:在创建动画图表时,可以考虑动态改变线型,以突出显示某些特定的时间点或数据范围。
-
与其他库的兼容性:如果你在项目中同时使用其他可视化库(如 Seaborn),要注意线型设置的兼容性问题。
-
自定义线型库:对于经常使用的特殊线型,可以创建一个自定义的线型库,以便在不同的项目中重复使用。
-
响应式设计:在创建用于网页或应用程序的图表时,要考虑不同屏幕尺寸下线型的可见性。
-
版权和品牌考虑:在商业或品牌相关的图表中,线型可能需要符合特定的设计指南或品牌标准。
通过注意这些进阶技巧和考虑因素,你可以更专业、更有效地使用 Matplotlib 的线型选项,创造出既美观又实用的数据可视化作品。
结语
Matplotlib 的线型选项是一个强大而灵活的工具,它为数据可视化提供了丰富的表现力。通过本文的详细探讨和多样化的示例,我们看到了线型在各种图表类型和应用场景中的潜力。从基本的线图到复杂的 3D 可视化,从简单的实线虚线到自定义的复杂模式,线型选项为我们提供了无限的创意空间。
掌握这些技巧不仅可以提高图表的美观度,更重要的是可以增强数据的可读性和解释性。在数据日益成为决策核心的今天,能够清晰、准确、有吸引力地呈现数据变得越来越重要。通过灵活运用 Matplotlib 的线型选项,我们可以更好地讲述数据背后的故事,帮助受众更深入地理解和洞察数据。
记住,数据可视化是科学与艺术的结合。while掌握技术细节很重要,同样重要的是要培养审美感觉和设计思维。通过不断实践和探索,你将能够创造出既准确传达信息又视觉上令人愉悦的图表。
最后,我们鼓励读者继续探索 Matplotlib 的其他功能,并将所学应用到实际项目中。数据可视化是一个不断发展的领域,保持学习和创新的态度将帮助你在这个领域中不断进步。希望本文能为你的数据可视化之旅提供有价值的指导和灵感。
 极客笔记
极客笔记