Matplotlib 图例位置设置:全面指南与实用技巧
Matplotlib 是 Python 中最流行的数据可视化库之一,它提供了强大而灵活的工具来创建各种类型的图表。在数据可视化中,图例(legend)是一个非常重要的元素,它帮助读者理解图表中不同数据系列的含义。本文将深入探讨 Matplotlib 中图例位置的设置,包括内置位置、自定义位置、图例样式调整等多个方面,帮助你掌握图例位置控制的各种技巧。
1. Matplotlib 图例基础
在开始探讨图例位置设置之前,我们先来了解一下 Matplotlib 中图例的基本用法。
1.1 添加图例
要在 Matplotlib 图表中添加图例,我们通常使用 legend() 方法。以下是一个简单的示例:
import matplotlib.pyplot as plt

plt.figure(figsize=(8, 6))
plt.plot([1, 2, 3, 4], [1, 4, 2, 3], label='Line 1')
plt.plot([1, 2, 3, 4], [2, 3, 4, 1], label='Line 2')
plt.title('How to add legend in Matplotlib - how2matplotlib.com')
plt.legend()
plt.show()
Output:
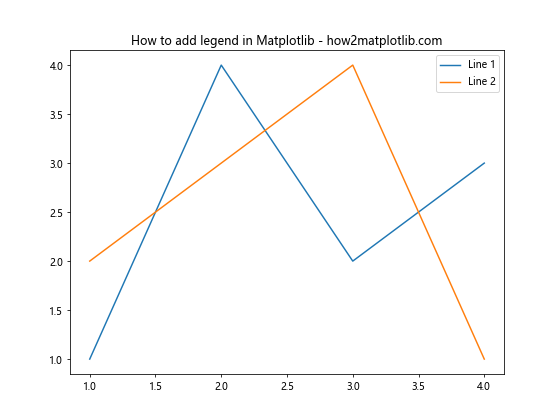
在这个例子中,我们创建了两条线,并为每条线设置了标签。通过调用 plt.legend(),Matplotlib 会自动创建一个包含这些标签的图例。
1.2 图例的组成部分
一个典型的 Matplotlib 图例由以下几个部分组成:
- 图例框:包含所有图例元素的边框
- 图例标题:可选的图例标题文本
- 图例项:每个数据系列的标识符和标签
- 图例句柄:用于表示数据系列的小图标或线条
了解这些组成部分对于后续自定义图例位置和样式非常重要。
2. 使用内置位置设置图例
Matplotlib 提供了一系列预定义的位置来放置图例。这些位置通过字符串或数字代码来指定。
2.1 字符串位置
最常用的方法是使用字符串来指定图例位置。以下是一个示例:
import matplotlib.pyplot as plt

plt.figure(figsize=(8, 6))
plt.plot([1, 2, 3, 4], [1, 4, 2, 3], label='Data')
plt.title('Legend position using string - how2matplotlib.com')
plt.legend(loc='upper right')
plt.show()
Output:
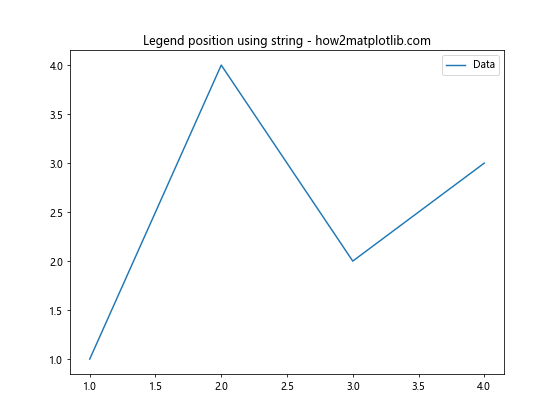
在这个例子中,我们使用 loc='upper right' 将图例放置在图表的右上角。常用的字符串位置包括:
- ‘best’
- ‘upper right’
- ‘upper left’
- ‘lower left’
- ‘lower right’
- ‘right’
- ‘center left’
- ‘center right’
- ‘lower center’
- ‘upper center’
- ‘center’
2.2 数字代码位置
除了字符串,我们还可以使用数字代码来指定图例位置。每个数字对应一个特定的位置:
import matplotlib.pyplot as plt

plt.figure(figsize=(8, 6))
plt.plot([1, 2, 3, 4], [1, 4, 2, 3], label='Data')
plt.title('Legend position using numeric code - how2matplotlib.com')
plt.legend(loc=1)  # 1 corresponds to 'upper right'
plt.show()
Output:
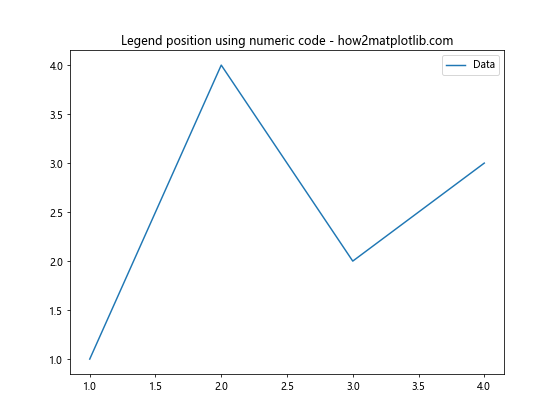
数字代码与位置的对应关系如下:
- 0: ‘best’
- 1: ‘upper right’
- 2: ‘upper left’
- 3: ‘lower left’
- 4: ‘lower right’
- 5: ‘right’
- 6: ‘center left’
- 7: ‘center right’
- 8: ‘lower center’
- 9: ‘upper center’
- 10: ‘center’
3. 自定义图例位置
虽然内置位置可以满足大多数需求,但有时我们可能需要更精确地控制图例的位置。Matplotlib 提供了多种方法来实现这一点。
3.1 使用相对坐标
我们可以使用相对坐标来精确定位图例。相对坐标使用 (x, y) 元组,其中 x 和 y 的值范围都是 0 到 1,分别表示图表宽度和高度的比例。
import matplotlib.pyplot as plt

plt.figure(figsize=(8, 6))
plt.plot([1, 2, 3, 4], [1, 4, 2, 3], label='Data')
plt.title('Custom legend position with relative coordinates - how2matplotlib.com')
plt.legend(loc='center', bbox_to_anchor=(0.5, 0.2))
plt.show()
Output:
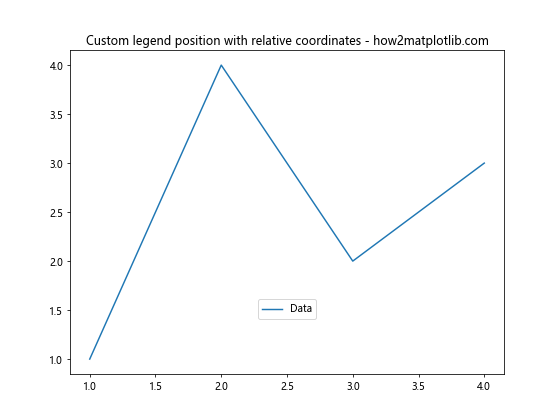
在这个例子中,bbox_to_anchor=(0.5, 0.2) 将图例放置在图表宽度的中间(x=0.5)和高度 20% 的位置(y=0.2)。
3.2 使用绝对坐标
如果你需要更精确的控制,可以使用绝对坐标来定位图例。这需要使用 transform 参数:
import matplotlib.pyplot as plt

fig, ax = plt.subplots(figsize=(8, 6))
ax.plot([1, 2, 3, 4], [1, 4, 2, 3], label='Data')
ax.set_title('Custom legend position with absolute coordinates - how2matplotlib.com')
ax.legend(bbox_to_anchor=(100, 100), loc='upper left', bbox_transform=ax.transData)
plt.show()
Output:
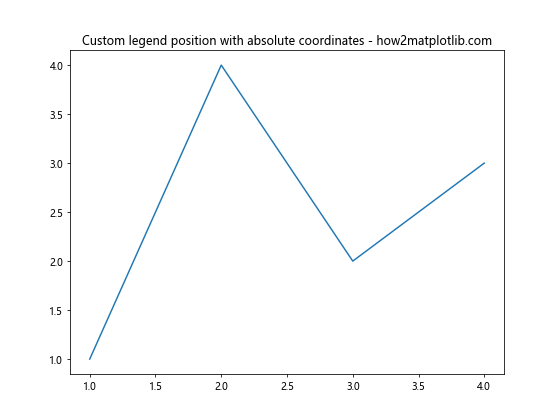
在这个例子中,我们将图例放置在数据坐标系中的 (100, 100) 位置。bbox_transform=ax.transData 指定我们使用的是数据坐标系。
3.3 图例放置在图表外部
有时,我们可能希望将图例放置在图表的外部。这可以通过调整 bbox_to_anchor 和 loc 参数来实现:
import matplotlib.pyplot as plt

plt.figure(figsize=(8, 6))
plt.plot([1, 2, 3, 4], [1, 4, 2, 3], label='Data 1')
plt.plot([1, 2, 3, 4], [2, 3, 4, 1], label='Data 2')
plt.title('Legend outside the plot - how2matplotlib.com')
plt.legend(bbox_to_anchor=(1.05, 1), loc='upper left')
plt.tight_layout()
plt.show()
Output:
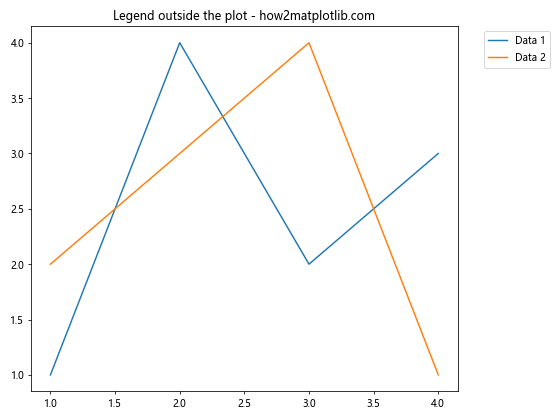
在这个例子中,我们将图例放置在图表的右侧。bbox_to_anchor=(1.05, 1) 将图例的左上角定位在图表右边缘稍微偏右的位置。
4. 调整图例样式
除了位置,我们还可以调整图例的各种样式属性来优化其外观。
4.1 更改图例框样式
我们可以通过设置 facecolor、edgecolor 和 shadow 等参数来自定义图例框的样式:
import matplotlib.pyplot as plt

plt.figure(figsize=(8, 6))
plt.plot([1, 2, 3, 4], [1, 4, 2, 3], label='Data')
plt.title('Customized legend box style - how2matplotlib.com')
plt.legend(facecolor='lightgray', edgecolor='blue', shadow=True)
plt.show()
Output:
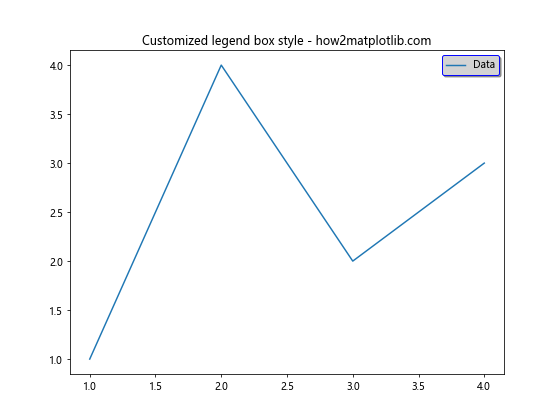
这个例子创建了一个浅灰色背景、蓝色边框、带阴影的图例框。
4.2 调整图例透明度
通过设置 alpha 参数,我们可以调整图例的透明度:
import matplotlib.pyplot as plt

plt.figure(figsize=(8, 6))
plt.plot([1, 2, 3, 4], [1, 4, 2, 3], label='Data')
plt.title('Semi-transparent legend - how2matplotlib.com')
plt.legend(loc='center', alpha=0.5)
plt.show()
这个例子创建了一个半透明的图例,使得背景的图表内容仍然可见。
4.3 更改图例字体样式
我们可以使用 prop 参数来设置图例文本的字体属性:
import matplotlib.pyplot as plt

plt.figure(figsize=(8, 6))
plt.plot([1, 2, 3, 4], [1, 4, 2, 3], label='Data')
plt.title('Customized legend font - how2matplotlib.com')
plt.legend(prop={'family': 'serif', 'size': 14, 'style': 'italic'})
plt.show()
Output:
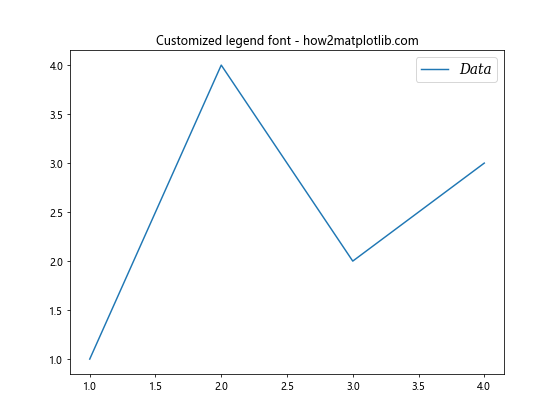
这个例子使用了衬线字体,字号为 14,样式为斜体。
5. 多列图例
当图表中有多个数据系列时,单列图例可能会变得很长。在这种情况下,我们可以创建多列图例。
5.1 使用 ncol 参数
最简单的方法是使用 ncol 参数:
import matplotlib.pyplot as plt

plt.figure(figsize=(10, 6))
for i in range(5):
    plt.plot([1, 2, 3, 4], [i+1, i+2, i+3, i+4], label=f'Data {i+1}')
plt.title('Multi-column legend - how2matplotlib.com')
plt.legend(ncol=3, loc='upper center', bbox_to_anchor=(0.5, -0.05))
plt.tight_layout()
plt.show()
Output:
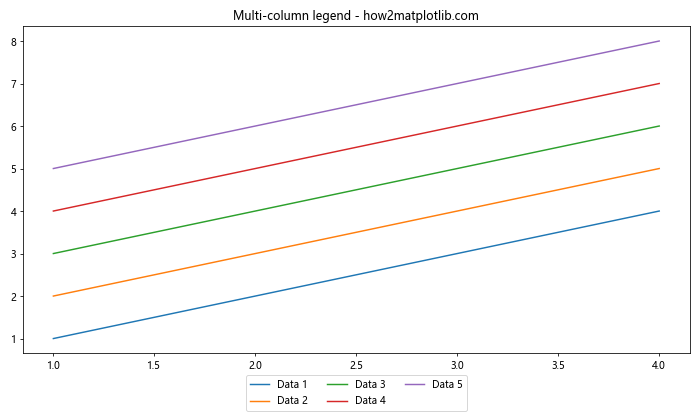
这个例子创建了一个三列的图例,并将其放置在图表下方。
5.2 自定义列宽
如果你需要更精细的控制,可以使用 columnspacing 参数来调整列之间的间距:
import matplotlib.pyplot as plt

plt.figure(figsize=(10, 6))
for i in range(5):
    plt.plot([1, 2, 3, 4], [i+1, i+2, i+3, i+4], label=f'Data {i+1}')
plt.title('Multi-column legend with custom spacing - how2matplotlib.com')
plt.legend(ncol=3, loc='upper center', bbox_to_anchor=(0.5, -0.05), columnspacing=1)
plt.tight_layout()
plt.show()
Output:
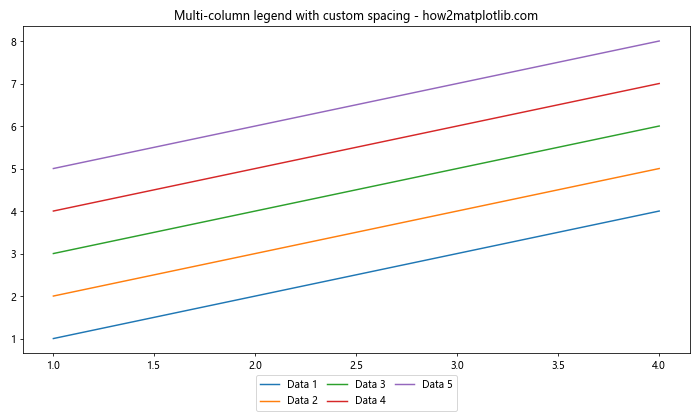
这个例子创建了一个三列的图例,并增加了列之间的间距。
6. 图例分组
有时,我们可能需要将相关的图例项分组在一起。Matplotlib 提供了几种方法来实现这一点。
6.1 使用 handler_map
我们可以使用 handler_map 来创建自定义的图例处理程序,从而实现图例分组:
import matplotlib.pyplot as plt
from matplotlib.legend_handler import HandlerLine2D, HandlerTuple

fig, ax = plt.subplots(figsize=(10, 6))

l1, = ax.plot([1, 2, 3], [1, 2, 3], 'ro-', label='Line 1')
l2, = ax.plot([1, 2, 3], [2, 3, 4], 'bo-', label='Line 2')
l3, = ax.plot([1, 2, 3], [3, 4, 5], 'go-', label='Line 3')

ax.legend([(l1, l2), l3], ['Group 1', 'Line 3'],
          handler_map={tuple: HandlerTuple(ndivide=None)},
          title='Grouped legend - how2matplotlib.com')

plt.show()
Output:
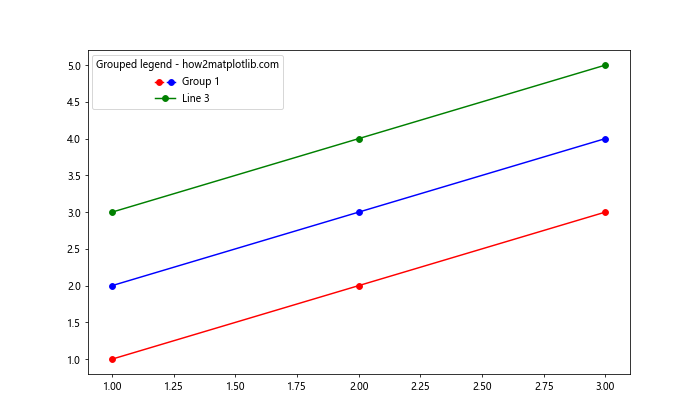
这个例子将前两条线分组为 “Group 1″,第三条线单独显示。
6.2 使用嵌套图例
另一种方法是创建嵌套的图例:
import matplotlib.pyplot as plt

fig, ax = plt.subplots(figsize=(10, 6))

l1, = ax.plot([1, 2, 3], [1, 2, 3], 'ro-', label='Line 1')
l2, = ax.plot([1, 2, 3], [2, 3, 4], 'bo-', label='Line 2')
l3, = ax.plot([1, 2, 3], [3, 4, 5], 'go-', label='Line 3')

# Create the first legend
first_legend = ax.legend(handles=[l1, l2], loc='upper left', title='Group 1')

# Add the first legend manually to the current Axes
ax.add_artist(first_legend)

# Create the second legend
ax.legend(handles=[l3], loc='lower right', title='Group 2')

ax.set_title('Nested legends - how2matplotlib.com')
plt.show()
Output:
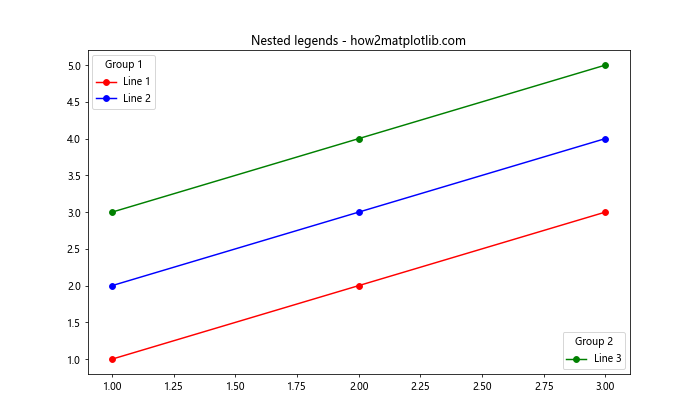
这个例子创建了两个独立的图例,一个用于 “Group 1″,另一个用于 “Group 2″。
7. 动态图例
在某些情况下,我们可能需要根据数据的变化动态更新图例。
7.1 更新图例标签
我们可以通过更新图例句柄的标签来动态修改图例:
import matplotlib.pyplot as plt

fig, ax = plt.subplots(figsize=(8, 6))

line, = ax.plot([1, 2, 3], [1, 2, 3], label='Initial label')
legend = ax.legend()

# Update the legend label
line.set_label('Updated label')
ax.legend()

ax.set_title('Dynamic legend update - how2matplotlib.com')
plt.show()
Output:
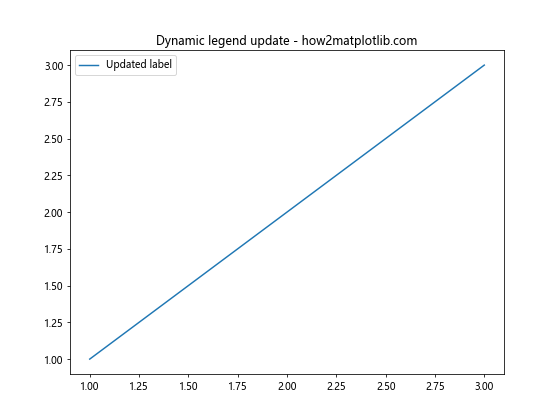
这个例子演示了如何更新图例标签。
7.2 添加或删除图例项
我们还可以动态地添加或删除图例项:
import matplotlib.pyplot as plt

fig, ax = plt以下是剩余内容的继续:

.subplots(figsize=(8, 6))

line1, = ax.plot([1, 2, 3], [1, 2, 3], label='Line 1')
line2, = ax.plot([1, 2, 3], [2, 3, 4], label='Line 2')

# Initial legend
legend = ax.legend()

# Add a new line and update the legend
line3, = ax.plot([1, 2, 3], [3, 4, 5], label='Line 3')
ax.legend(handles=[line1, line2, line3])

ax.set_title('Dynamic legend addition - how2matplotlib.com')
plt.show()
这个例子展示了如何动态添加新的图例项。
8. 图例与其他元素的交互
图例的位置可能会与图表中的其他元素产生冲突。Matplotlib 提供了一些方法来处理这种情况。
8.1 使用 bbox_inches=’tight’
当图例位于图表外部时,可能会被裁剪掉。使用 bbox_inches='tight' 可以确保图例完全显示:
import matplotlib.pyplot as plt

plt.figure(figsize=(8, 6))
plt.plot([1, 2, 3, 4], [1, 4, 2, 3], label='Data')
plt.title('Legend outside plot area - how2matplotlib.com')
plt.legend(bbox_to_anchor=(1.05, 1), loc='upper left')
plt.tight_layout()
plt.savefig('legend_outside.png', bbox_inches='tight')
plt.show()
Output:
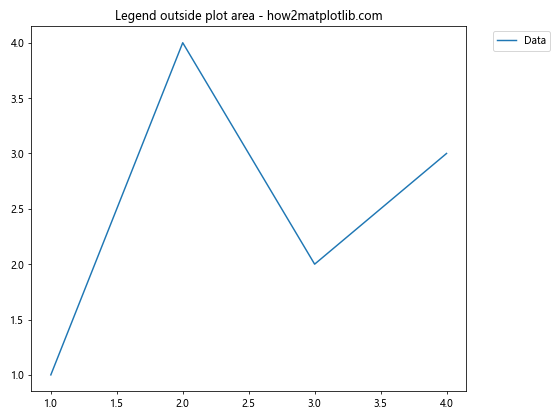
这个例子将图例放置在图表右侧,并确保在保存图片时不会被裁剪。
8.2 避免图例遮挡数据
有时图例可能会遮挡重要的数据点。我们可以使用 bbox_to_anchor 和 loc 的组合来微调图例位置:
import matplotlib.pyplot as plt

plt.figure(figsize=(8, 6))
plt.plot([1, 2, 3, 4], [1, 4, 2, 3], label='Data')
plt.scatter([2], [4], s=200, c='red')  # Important data point
plt.title('Avoiding legend overlap - how2matplotlib.com')
plt.legend(loc='upper right', bbox_to_anchor=(1, 0.95))
plt.show()
Output:
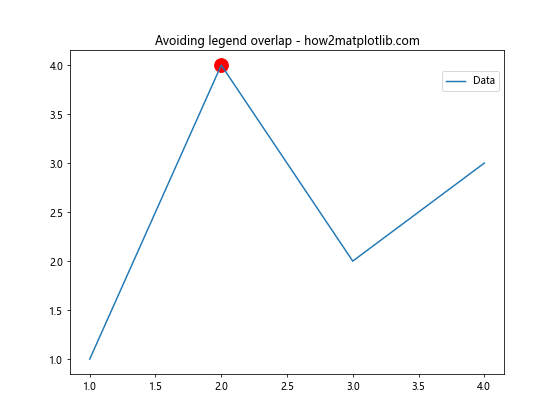
这个例子将图例稍微向下移动,以避免遮挡重要的数据点。
9. 高级图例技巧
对于更复杂的图表,我们可能需要使用一些高级技巧来优化图例的显示。
9.1 自定义图例标记
我们可以自定义图例中的标记样式:
import matplotlib.pyplot as plt

fig, ax = plt.subplots(figsize=(8, 6))

line = ax.plot([1, 2, 3], [1, 2, 3], 'ro-', label='Data')
ax.legend()

# Customize legend marker
legend = ax.get_legend()
legend.legendHandles[0].set_color('blue')
legend.legendHandles[0].set_marker('s')

ax.set_title('Custom legend markers - how2matplotlib.com')
plt.show()
Output:
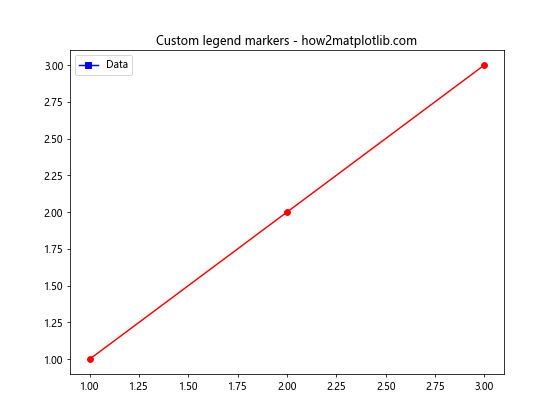
这个例子将图例中的标记颜色改为蓝色,形状改为正方形。
9.2 创建带有阴影文本的图例
为了增强可读性,我们可以为图例文本添加阴影效果:
import matplotlib.pyplot as plt
from matplotlib.patheffects import withStroke

fig, ax = plt.subplots(figsize=(8, 6))
ax.plot([1, 2, 3], [1, 2, 3], label='Data')

legend = ax.legend()
plt.setp(legend.get_texts(), path_effects=[withStroke(linewidth=3, foreground='w')])

ax.set_title('Legend with shadow text - how2matplotlib.com')
plt.show()
Output:
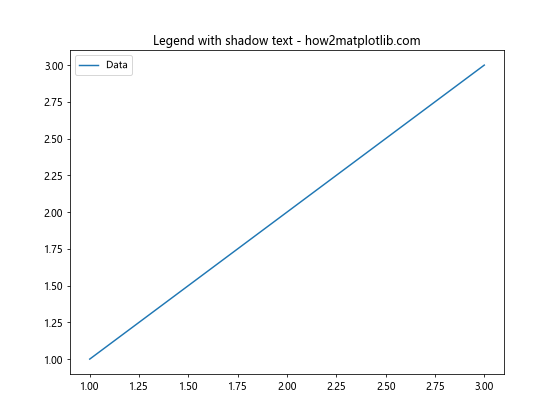
这个例子为图例文本添加了白色阴影,增强了其在各种背景下的可读性。
9.3 创建图例标题
我们可以为图例添加一个标题:
import matplotlib.pyplot as plt

fig, ax = plt.subplots(figsize=(8, 6))
ax.plot([1, 2, 3], [1, 2, 3], label='Line 1')
ax.plot([1, 2, 3], [2, 3, 4], label='Line 2')

legend = ax.legend(title='Data Series', title_fontsize='14', fontsize='12')

ax.set_title('Legend with title - how2matplotlib.com')
plt.show()
Output:
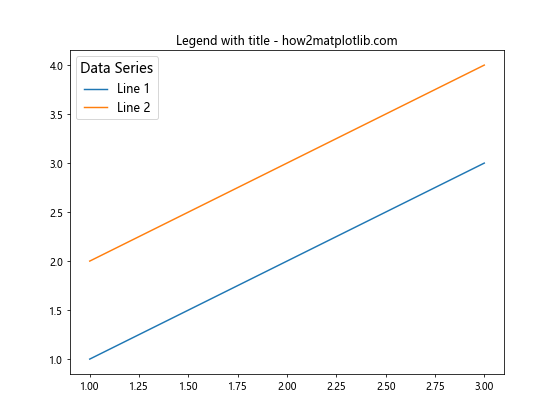
这个例子为图例添加了一个标题 “Data Series”,并设置了标题和图例项的字体大小。
10. 总结
通过本文,我们详细探讨了 Matplotlib 中图例位置设置的各种方法和技巧。从基本的内置位置设置,到精确的自定义位置控制,再到高级的样式调整和动态更新,我们涵盖了广泛的主题。这些技巧可以帮助你创建更加清晰、美观和信息丰富的数据可视化图表。
记住,图例的最佳位置和样式往往取决于你的具体数据和图表布局。不要害怕尝试不同的设置,找出最适合你的数据展示需求的方案。通过实践和经验,你将能够熟练运用这些技巧,创建出专业水准的数据可视化作品。
最后,建议你继续探索 Matplotlib 的其他功能,如颜色映射、子图布局、3D 绘图等,以进一步提升你的数据可视化技能。结合本文所学的图例控制技巧,你将能够创建出更加丰富多样的图表,更好地传达你的数据洞察。
 极客笔记
极客笔记