matplotlib图例位置
参考:matplotlib legend locations
在matplotlib中,图例位置是指将图例放置在图表中的具体位置。正确的图例位置可以使得图表更加清晰、易于阅读。本文将介绍matplotlib中常用的图例位置,以及如何使用这些位置参数来调整图例的位置。
1. 图例位置参数
在matplotlib中,图例位置可以通过loc参数来指定。常用的图例位置参数包括:
best: 自适应选择最佳的位置upper right: 右上角upper left: 左上角lower right: 右下角lower left: 左下角right: 右侧center left: 左侧中间center right: 右侧中间lower center: 底部中间upper center: 顶部中间center: 中间
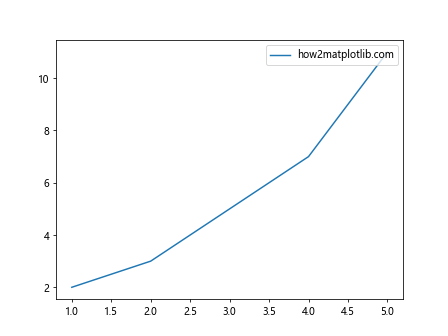
下面通过示例代码来演示如何使用这些位置参数来设置图例的位置:
import matplotlib.pyplot as plt

x = [1, 2, 3, 4, 5]
y = [2, 3, 5, 7, 11]

plt.plot(x, y, label='how2matplotlib.com')
plt.legend(loc='upper right')

plt.show()
Output:
2. 图例边界框
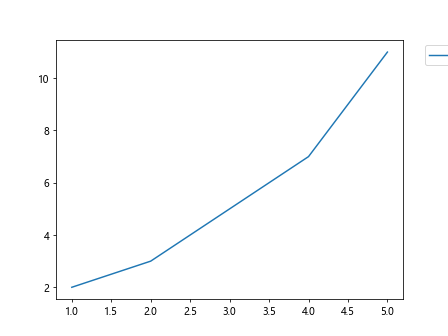
在matplotlib中,可以通过设置bbox_to_anchor参数来调整图例的位置。bbox_to_anchor参数接受一个元组,用来指定图例的边界框的位置。示例如下:
import matplotlib.pyplot as plt

x = [1, 2, 3, 4, 5]
y = [2, 3, 5, 7, 11]

plt.plot(x, y, label='how2matplotlib.com')
plt.legend(bbox_to_anchor=(1.05, 1), loc='upper left')

plt.show()
Output:
3. 自定义图例边框
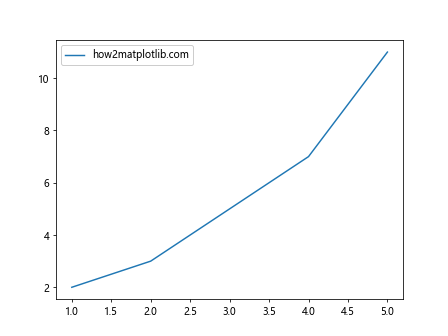
有时候我们希望自定义图例的边框,比如设置边框的颜色、宽度等。可以通过设置frameon参数来控制是否显示图例的边框,并通过framealpha参数来设置边框的透明度。示例如下:
import matplotlib.pyplot as plt

x = [1, 2, 3, 4, 5]
y = [2, 3, 5, 7, 11]

plt.plot(x, y, label='how2matplotlib.com')
plt.legend(frameon=True, framealpha=1)

plt.show()
Output:
4. 图例标题
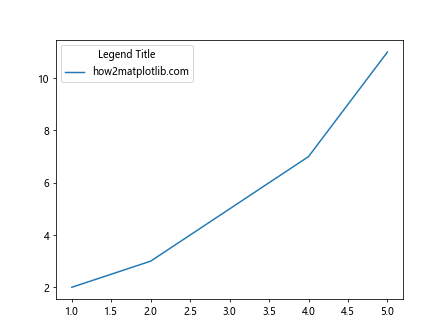
在matplotlib中,可以通过设置title参数来给图例添加标题。示例如下:
import matplotlib.pyplot as plt

x = [1, 2, 3, 4, 5]
y = [2, 3, 5, 7, 11]

plt.plot(x, y, label='how2matplotlib.com')
plt.legend(title='Legend Title')

plt.show()
Output:
5. 调整图例的大小
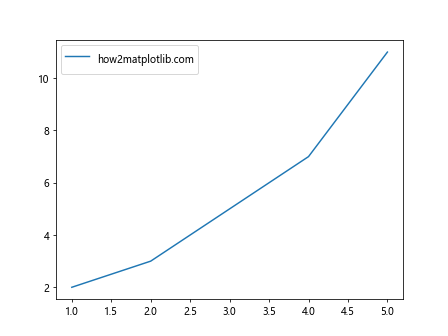
有时候我们希望调整图例的大小,可以通过设置handlelength参数来调整图例句柄的长度、handleheight参数来调整图例句柄的高度。示例如下:
import matplotlib.pyplot as plt

x = [1, 2, 3, 4, 5]
y = [2, 3, 5, 7, 11]

plt.plot(x, y, label='how2matplotlib.com')
plt.legend(handlelength=2.5, handleheight=3)

plt.show()
Output:
6. 调整图例文字的大小
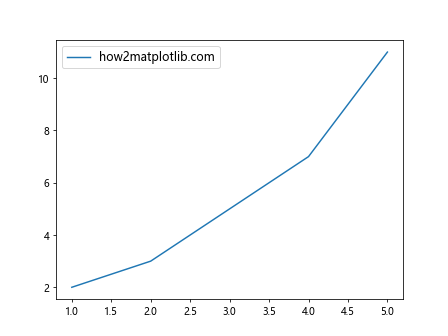
可以通过设置fontsize参数来调整图例文字的大小。示例如下:
import matplotlib.pyplot as plt

x = [1, 2, 3, 4, 5]
y = [2, 3, 5, 7, 11]

plt.plot(x, y, label='how2matplotlib.com')
plt.legend(fontsize='large')

plt.show()
Output:
7. 调整图例的排列方向
有时候我们希望调整图例的排列方向,可以通过设置orientation参数来实现。orientation参数接受horizontal和vertical两个值。示例如下:
import matplotlib.pyplot as plt

x = [1, 2, 3, 4, 5]
y = [2, 3, 5, 7, 11]

plt.plot(x, y, label='how2matplotlib.com')
plt.legend(loc='upper left', orientation='horizontal')

plt.show()
8. 调整图例文字的间距
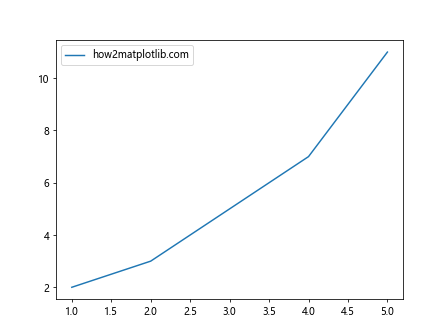
可以通过设置labelspacing参数来调整图例文字之间的间距。示例如下:
import matplotlib.pyplot as plt

x = [1, 2, 3, 4, 5]
y = [2, 3, 5, 7, 11]

plt.plot(x, y, label='how2matplotlib.com')
plt.legend(labelspacing=1.5)

plt.show()
Output:
9. 调整图例边框的圆角
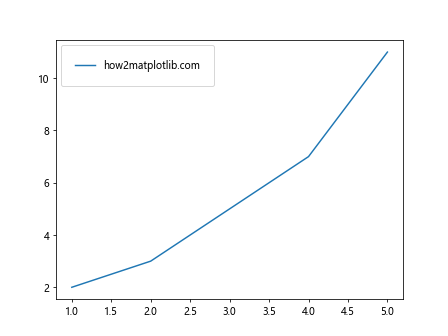
可以通过设置borderpad参数来调整图例边框的圆角半径。示例如下:
import matplotlib.pyplot as plt

x = [1, 2, 3, 4, 5]
y = [2, 3, 5, 7, 11]

plt.plot(x, y, label='how2matplotlib.com')
plt.legend(borderpad=1.5)

plt.show()
Output:
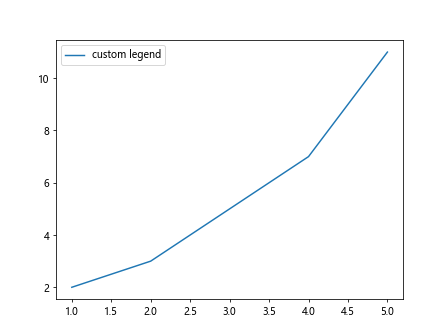
10. 自定义图例
有时候我们希望自定义图例的样式,比如修改图例文字的颜色、背景颜色等。可以通过Legend对象来实现自定义图例。示例如下:
import matplotlib.pyplot as plt
from matplotlib.legend import Legend

x = [1, 2, 3, 4, 5]
y = [2, 3, 5, 7, 11]

line, = plt.plot(x, y)
legend = Legend(plt.gca(), [line], ['custom legend'], loc='upper left', frameon=True)
plt.gca().add_artist(legend)

plt.show()
Output:
通过本文的介绍,相信读者对matplotlib中图例位置的设置有了更深入的了解。掌握这些知识,可以使得我们在绘制图表时更加灵活,呈现出更加美观、清晰的结果。
 极客笔记
极客笔记