将 matplotlib 图例放置在图形外部
参考:matplotlib legend outside figure
在Matplotlib中,我们可以很容易地将图例(legend)放置在图形外部。这在需要更灵活地控制图例位置时非常有用。接下来,我们将介绍如何在Matplotlib中将图例放置在图形外部。
首先,我们需要导入Matplotlib库:
import matplotlib.pyplot as plt
将图例放置在图形外部
要将图例放置在图形外部,我们可以使用bbox_to_anchor参数来控制图例的位置。该参数接受一个包含四个值的元组,分别表示图例的左下角在图形坐标系中的位置。
下面是一个简单的示例代码,将图例放置在图形右上方:
import matplotlib.pyplot as plt

x = [1, 2, 3, 4, 5]
y = [10, 15, 13, 18, 16]

plt.plot(x, y, label='Line 1')
plt.legend(loc='upper right', bbox_to_anchor=(1.3, 1))
plt.show()
Output:
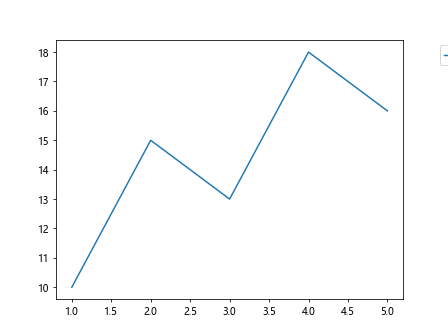
在上面的示例中,我们使用loc='upper right'将图例放置在右上角,然后使用bbox_to_anchor=(1.3, 1)将图例稍微向右移动。你可以根据需要调整bbox_to_anchor参数的值来进一步调整图例的位置。
示例代码
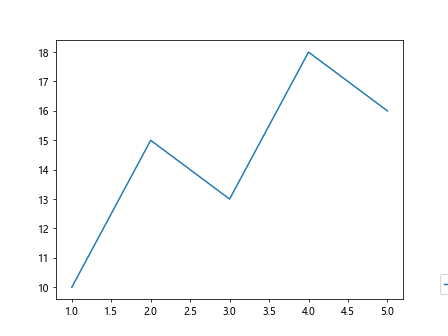
示例1:将图例放置在图形右下方
import matplotlib.pyplot as plt

x = [1, 2, 3, 4, 5]
y = [10, 15, 13, 18, 16]

plt.plot(x, y, label='Line 1')
plt.legend(loc='lower right', bbox_to_anchor=(1.3, 0))
plt.show()
Output:
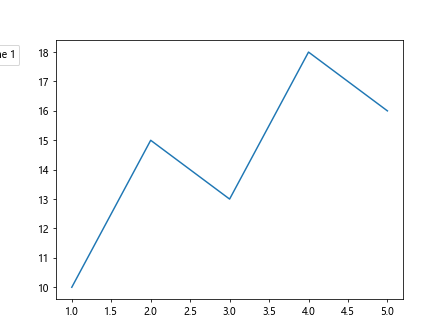
示例2:将图例放置在图形左上方
import matplotlib.pyplot as plt

x = [1, 2, 3, 4, 5]
y = [10, 15, 13, 18, 16]

plt.plot(x, y, label='Line 1')
plt.legend(loc='upper left', bbox_to_anchor=(-0.3, 1))
plt.show()
Output:
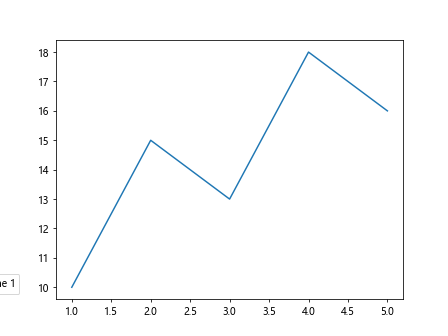
示例3:将图例放置在图形左下方
import matplotlib.pyplot as plt

x = [1, 2, 3, 4, 5]
y = [10, 15, 13, 18, 16]

plt.plot(x, y, label='Line 1')
plt.legend(loc='lower left', bbox_to_anchor=(-0.3, 0))
plt.show()
Output:
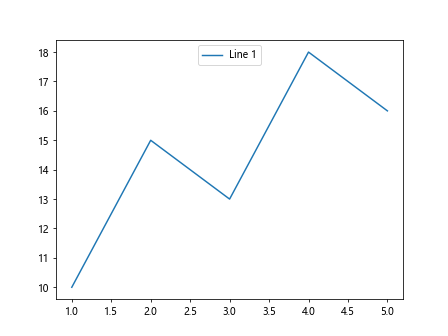
示例4:将图例放置在图形顶部中央
import matplotlib.pyplot as plt

x = [1, 2, 3, 4, 5]
y = [10, 15, 13, 18, 16]

plt.plot(x, y, label='Line 1')
plt.legend(loc='upper center', bbox_to_anchor=(0.5, 1))
plt.show()
Output:
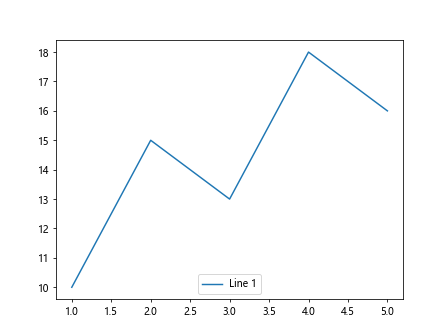
示例5:将图例放置在图形底部中央
import matplotlib.pyplot as plt

x = [1, 2, 3, 4, 5]
y = [10, 15, 13, 18, 16]

plt.plot(x, y, label='Line 1')
plt.legend(loc='lower center', bbox_to_anchor=(0.5, 0))
plt.show()
Output:
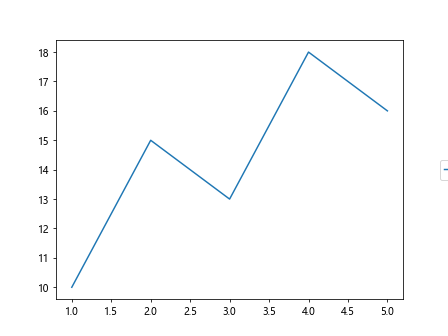
示例6:将图例放置在图形右侧中央
import matplotlib.pyplot as plt

x = [1, 2, 3, 4, 5]
y = [10, 15, 13, 18, 16]

plt.plot(x, y, label='Line 1')
plt.legend(loc='center right', bbox_to_anchor=(1.3, 0.5))
plt.show()
Output:
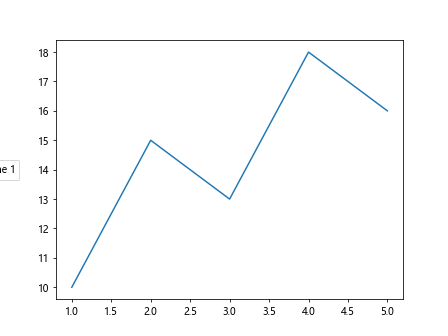
示例7:将图例放置在图形左侧中央
import matplotlib.pyplot as plt

x = [1, 2, 3, 4, 5]
y = [10, 15, 13, 18, 16]

plt.plot(x, y, label='Line 1')
plt.legend(loc='center left', bbox_to_anchor=(-0.3, 0.5))
plt.show()
Output:
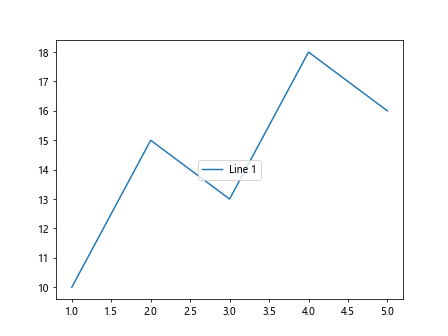
示例8:将图例放置在图形中央
import matplotlib.pyplot as plt

x = [1, 2, 3, 4, 5]
y = [10, 15, 13, 18, 16]

plt.plot(x, y, label='Line 1')
plt.legend(loc='center', bbox_to_anchor=(0.5, 0.5))
plt.show()
Output:
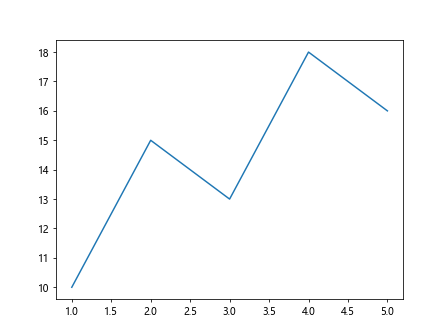
示例9:将图例放置在图形右上方并且分散对齐
import matplotlib.pyplot as plt

x = [1, 2, 3, 4, 5]
y = [10, 15, 13, 18, 16]

plt.plot(x, y, label='Line 1')
plt.legend(loc='upper right', bbox_to_anchor=(1.3, 1), mode='expand', ncol=2)
plt.show()
Output:
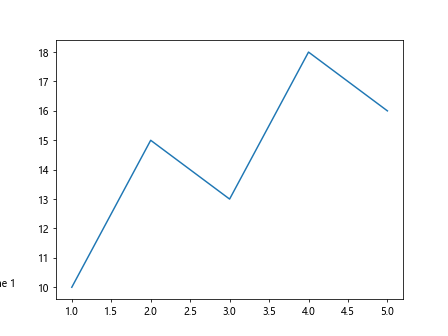
示例10:将图例放置在图形左下方并且分散对齐
import matplotlib.pyplot as plt

x = [1, 2, 3, 4, 5]
y = [10, 15, 13, 18, 16]

plt.plot(x, y, label='Line 1')
plt.legend(loc='lower left', bbox_to_anchor=(-0.3, 0), mode='expand', ncol=2)
plt.show()
Output:
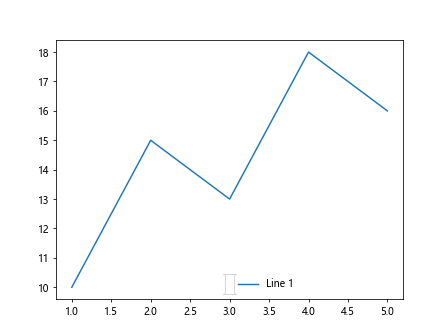
示例11:将图例放置在图形底部中央并且分散对齐
import matplotlib.pyplot as plt

x = [1, 2, 3, 4, 5]
y = [10, 15, 13, 18, 16]

plt.plot(x, y, label='Line 1')
plt.legend(loc='lower center', bbox_to_anchor=(0.5, 0), mode='expand', ncol=2)
plt.show()
Output:
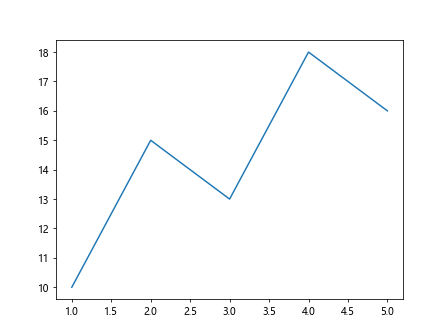
示例12:将图例放置在图形右侧中央并且分散对齐
import matplotlib.pyplot as plt

x = [1, 2, 3, 4, 5]
y = [10, 15, 13, 18, 16]

plt.plot(x, y, label='Line 1')
plt.legend(loc='center right', bbox_to_anchor=(1.3, 0.5), mode='expand', ncol=2)
plt.show()
Output:
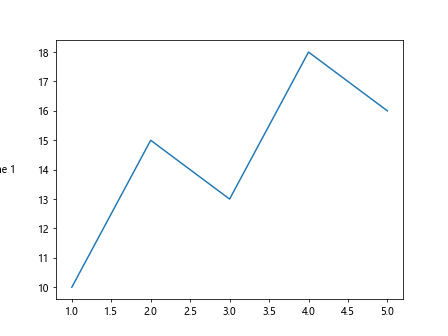
示例13:将图例放置在图形左侧中央并且分散对齐
import matplotlib.pyplot as plt

x = [1, 2, 3, 4, 5]
y = [10, 15, 13, 18, 16]

plt.plot(x, y, label='Line 1')
plt.legend(loc='center left', bbox_to_anchor=(-0.3, 0.5), mode='expand', ncol=2)
plt.show()
Output:
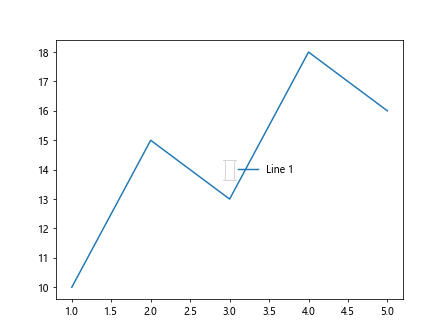
示例14:将图例放置在图形中央并且分散对齐
import matplotlib.pyplot as plt

x = [1, 2, 3, 4, 5]
y = [10, 15, 13, 18, 16]

plt.plot(x, y, label='Line 1')
plt.legend(loc='center', bbox_to_anchor=(0.5, 0.5), mode='expand', ncol=2)
plt.show()
Output:
总结
通过以上示例,我们学会了如何在Matplotlib中将图例放置在图形外部,并且通过调整bbox_to_anchor参数可以灵活控制图例的位置。
 极客笔记
极客笔记