matplotlib图例水平显示
参考:matplotlib legend horizontal
在使用matplotlib进行数据可视化时,图例是非常重要的组成部分,它可以帮助我们更清晰地理解图表中的数据含义。默认情况下,matplotlib的图例是垂直显示的,但有时候我们希望将图例水平显示,以节省空间或者使得图表更美观。本文将详细介绍如何在matplotlib中将图例水平显示。
简单水平图例显示
首先,我们来看一个简单的例子,如何将图例水平显示。我们可以使用legend函数的参数loc和bbox_to_anchor来控制图例的位置和方向。
import matplotlib.pyplot as plt

x = [1, 2, 3, 4, 5]
y1 = [1, 4, 9, 16, 25]
y2 = [1, 3, 6, 10, 15]

plt.plot(x, y1, label='Line 1')
plt.plot(x, y2, label='Line 2')
plt.legend(loc='upper center', bbox_to_anchor=(0.5, -0.1), ncol=2)
plt.show()
Output:
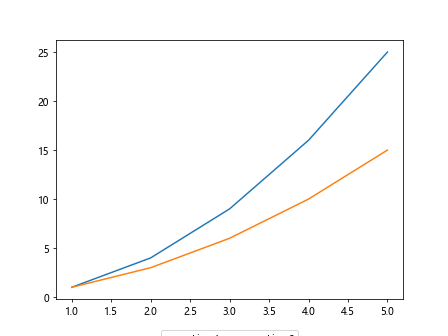
在上面的示例中,我们设置loc='upper center'和bbox_to_anchor=(0.5, -0.1),这样可以将图例水平显示在图表的下方。
自定义水平图例样式
为了进一步美化水平图例的样式,我们可以修改图例的字体大小、边框颜色、背景颜色等属性。下面是一个示例代码:
import matplotlib.pyplot as plt

x = [1, 2, 3, 4, 5]
y1 = [1, 4, 9, 16, 25]
y2 = [1, 3, 6, 10, 15]

plt.plot(x, y1, label='Line 1')
plt.plot(x, y2, label='Line 2')
plt.legend(loc='upper center', bbox_to_anchor=(0.5, -0.1), ncol=2, fontsize='large', edgecolor='red', facecolor='lightgray')
plt.show()
Output:
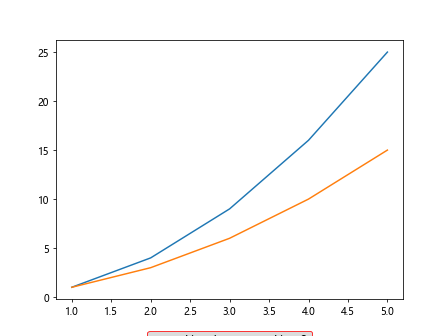
在上面的示例中,我们通过设置fontsize='large'来调整字体大小,edgecolor='red'来设置边框颜色,facecolor='lightgray'来设置背景颜色。
多行水平图例
有时候,我们可能需要在水平图例中显示多行文本,以便更清楚地说明每个数据系列的含义。下面是一个示例代码:
import matplotlib.pyplot as plt

x = [1, 2, 3, 4, 5]
y1 = [1, 4, 9, 16, 25]
y2 = [1, 3, 6, 10, 15]

plt.plot(x, y1, label='Line 1\nhow2matplotlib.com')
plt.plot(x, y2, label='Line 2\nhow2matplotlib.com')
plt.legend(loc='upper center', bbox_to_anchor=(0.5, -0.1), ncol=2)
plt.show()
Output:
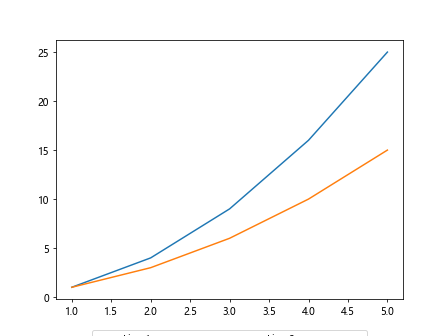
在上面的示例中,我们使用\n来换行,实现多行文本显示。
水平图例边框控制
有时候我们想要控制水平图例的边框宽度和样式,以便更好地突出图例。下面是一个示例代码:
import matplotlib.pyplot as plt

x = [1, 2, 3, 4, 5]
y1 = [1, 4, 9, 16, 25]
y2 = [1, 3, 6, 10, 15]

plt.plot(x, y1, label='Line 1')
plt.plot(x, y2, label='Line 2')
plt.legend(loc='upper center', bbox_to_anchor=(0.5, -0.1), ncol=2, borderpad=1, borderaxespad=1.5, handlelength=2, handleheight=0.7)
plt.show()
Output:
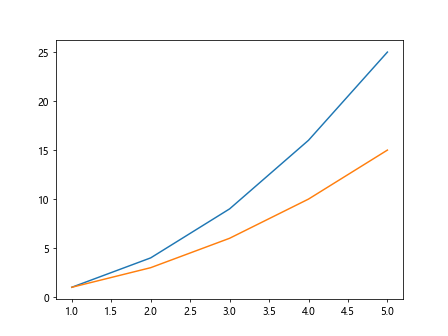
在上面的示例中,我们通过设置borderpad、borderaxespad、handlelength和handleheight来控制图例的边框宽度和样式。
水平图例间距调整
有时候我们需要调整水平图例之间的间距,使得图例更加美观。下面是一个示例代码:
import matplotlib.pyplot as plt

x = [1, 2, 3, 4, 5]
y1 = [1, 4, 9, 16, 25]
y2 = [1, 3, 6, 10, 15]

plt.plot(x, y1, label='Line 1')
plt.plot(x, y2, label='Line 2')
plt.legend(loc='upper center', bbox_to_anchor=(0.5, -0.1), ncol=2, columnspacing=2)
plt.show()
Output:
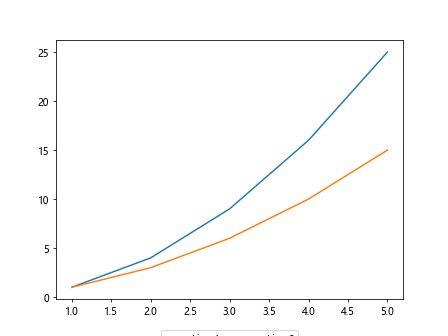
在上面的示例中,我们通过设置columnspacing来调整水平图例之间的间距。
自定义水平图例位置
除了设置loc和bbox_to_anchor之外,我们还可以通过移动水平图例的位置来获得更加灵活的控制。下面是一个示例代码:
import matplotlib.pyplot as plt

x = [1, 2, 3, 4, 5]
y1 = [1, 4, 9, 16, 25]
y2 = [1, 3, 6, 10, 15]

plt.plot(x, y1, label='Line 1')
plt.plot(x, y2, label='Line 2')
plt.legend(loc='upper center', bbox_to_anchor=(0.2, -0.1), ncol=2)
plt.show()
Output:
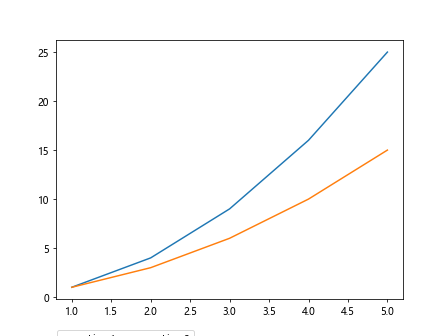
在上面的示例中,我们通过修改bbox_to_anchor的值来移动水平图例的位置。
水平图例标题
有时候我们需要为水平图例添加标题,以便更好地说明图例的含义。下面是一个示例代码:
import matplotlib.pyplot as plt

x = [1, 2, 3, 4, 5]
y1 = [1, 4, 9, 16, 25]
y2 = [1, 3, 6, 10, 15]

plt.plot(x, y1, label='Line 1')
plt.plot(x, y2, label='Line 2')
plt.legend(loc='upper center', bbox_to_anchor=(0.5, -0.1), ncol=2, title='Legend Title')
plt.show()
Output:
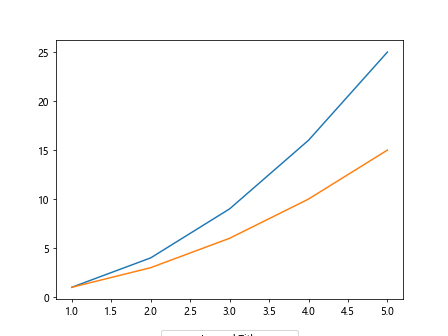
在上面的示例中,我们通过设置title参数来添加水平图例的标题。
水平图例文字旋转
有时候我们想要将水平图例的文字进行旋转,以便更好地适应图表的布局。下面是一个示例代码:
import matplotlib.pyplot as plt

x = [1, 2, 3, 4, 5]
y1 = [1, 4, 9, 16, 25]
y2 = [1, 3, 6, 10, 15]

plt.plot(x, y1, label='Line 1')
plt.plot(x, y2, label='Line 2')
plt.legend(loc='upper center', bbox_to_anchor=(0.5, -0.1), ncol=2, labelrotation=45)
plt.show()
在上面的示例中,我们通过设置labelrotation参数来使水平图例的文字旋转45度。
调整水平图例大小
如果我们希望调整水平图例的大小,可以通过设置handlelength和handleheight参数来实现。下面是一个示例代码:
import matplotlib.pyplot as plt

x = [1, 2, 3, 4, 5]
y1 = [1, 4, 9, 16, 25]
y2 = [1, 3, 6, 10, 15]

plt.plot(x, y1, label='Line 1')
plt.plot(x, y2, label='Line 2')
plt.legend(loc='upper center', bbox_to_anchor=(0.5, -0.1), ncol=2, handlelength=2, handleheight=0.7)
plt.show()
Output:
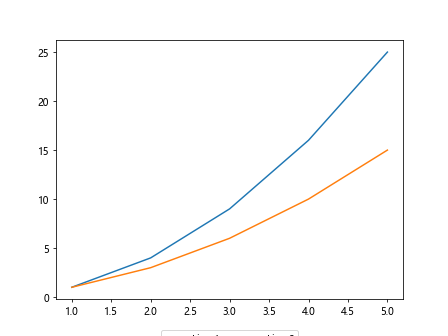
在上面的示例中,我们通过设置handlelength和handleheight参数来调整水平图例的大小。
自定义水平图例排列顺序
有时候我们想要自定义水平图例中每个数据系列出现的顺序,可以通过设置handles参数来实现。下面是一个示例代码:
import matplotlib.pyplot as plt
from matplotlib.lines import Line2D

x = [1, 2, 3, 4, 5]
y1 = [1, 4, 9, 16, 25]
y2 = [1, 3, 6, 10, 15]

line1 = Line2D([], [], color='blue', label='Line 1')
line2 = Line2D([], [], color='orange', label='Line 2')

plt.plot(x, y1, color='blue')
plt.plot(x, y2, color='orange')
plt.legend(handles=[line2, line1], loc='upper center', bbox_to_anchor=(0.5, -0.1), ncol=2)
plt.show()
Output:
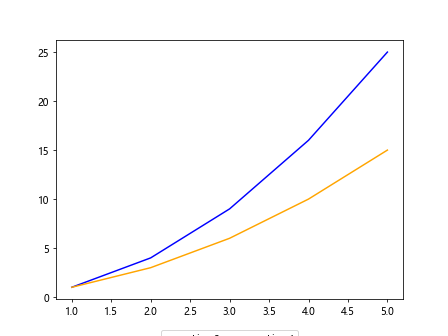
在上面的示例中,我们通过设置handles参数来定义水平图例中数据系列的排列顺序。
 极客笔记
极客笔记