Matplotlib 标签颜色设置:全面指南与实用技巧
Matplotlib 是 Python 中最流行的数据可视化库之一,它提供了丰富的功能来创建各种类型的图表和绘图。在数据可视化中,标签的颜色设置是一个重要的方面,它可以帮助我们突出重要信息,增强图表的可读性和美观性。本文将深入探讨 Matplotlib 中标签颜色的设置方法,包括坐标轴标签、图例标签、文本标签等多个方面,并提供大量实用的示例代码。
1. 坐标轴标签颜色设置
坐标轴标签是图表中最基本的元素之一,它们用于描述 x 轴和 y 轴的含义。通过设置适当的颜色,我们可以使坐标轴标签更加醒目或与整体设计相协调。
1.1 设置 x 轴和 y 轴标签颜色
我们可以使用 set_xlabel() 和 set_ylabel() 方法来设置坐标轴标签的颜色。
import matplotlib.pyplot as plt

fig, ax = plt.subplots()
ax.plot([1, 2, 3, 4], [1, 4, 2, 3])

ax.set_xlabel('X-axis (how2matplotlib.com)', color='red')
ax.set_ylabel('Y-axis (how2matplotlib.com)', color='blue')

plt.show()
Output:
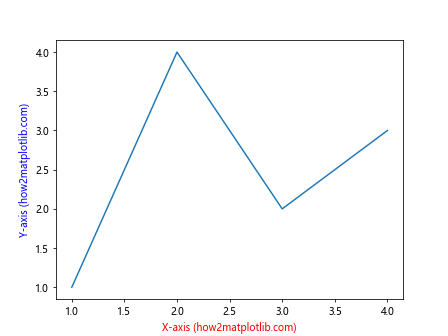
在这个示例中,我们设置了 x 轴标签为红色,y 轴标签为蓝色。通过 color 参数,我们可以直接指定颜色名称或使用颜色代码。
1.2 使用 RGB 值设置标签颜色
除了使用预定义的颜色名称,我们还可以使用 RGB 值来精确控制标签的颜色。
import matplotlib.pyplot as plt

fig, ax = plt.subplots()
ax.plot([1, 2, 3, 4], [1, 4, 2, 3])

ax.set_xlabel('X-axis (how2matplotlib.com)', color=(0.8, 0.2, 0.1))  # 红色偏暗
ax.set_ylabel('Y-axis (how2matplotlib.com)', color=(0.1, 0.5, 0.8))  # 蓝色偏亮

plt.show()
Output:
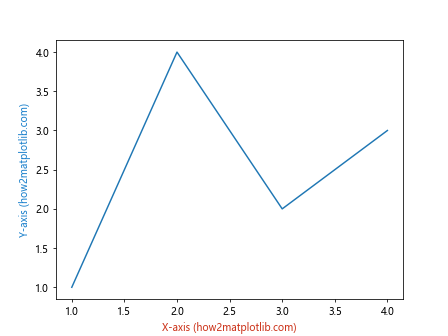
在这个例子中,我们使用 RGB 元组来设置标签颜色。每个值的范围是 0 到 1,分别代表红、绿、蓝三个颜色通道的强度。
1.3 设置刻度标签颜色
除了坐标轴标签,我们还可以设置刻度标签的颜色。这可以通过 tick_params() 方法来实现。
import matplotlib.pyplot as plt

fig, ax = plt.subplots()
ax.plot([1, 2, 3, 4], [1, 4, 2, 3])

ax.set_xlabel('X-axis (how2matplotlib.com)')
ax.set_ylabel('Y-axis (how2matplotlib.com)')

ax.tick_params(axis='x', colors='green')
ax.tick_params(axis='y', colors='orange')

plt.show()
Output:
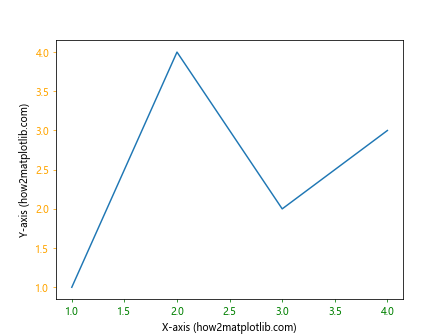
这个示例中,我们将 x 轴的刻度标签设置为绿色,y 轴的刻度标签设置为橙色。
2. 图例标签颜色设置
图例是解释图表中不同数据系列的重要元素。通过设置适当的颜色,我们可以使图例更加清晰易读。
2.1 设置图例标签颜色
我们可以在创建图例时直接设置标签颜色。
import matplotlib.pyplot as plt

fig, ax = plt.subplots()
ax.plot([1, 2, 3, 4], [1, 4, 2, 3], label='Data 1 (how2matplotlib.com)')
ax.plot([1, 2, 3, 4], [3, 2, 4, 1], label='Data 2 (how2matplotlib.com)')

ax.legend(labelcolor=['red', 'blue'])

plt.show()
Output:
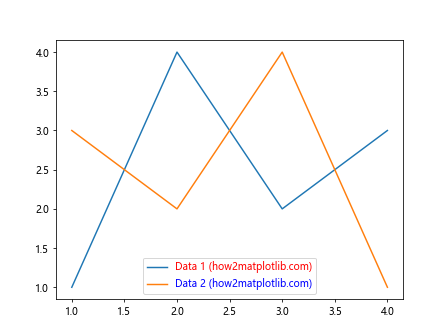
在这个例子中,我们为两个数据系列创建了图例,并分别设置了红色和蓝色的标签颜色。
2.2 使用自定义颜色循环
如果有多个数据系列,我们可以使用自定义的颜色循环来为图例标签设置颜色。
import matplotlib.pyplot as plt
import matplotlib.colors as mcolors

fig, ax = plt.subplots()

colors = list(mcolors.TABLEAU_COLORS.values())
for i in range(5):
    ax.plot([1, 2, 3, 4], [i, i+1, i+2, i+3], label=f'Data {i+1} (how2matplotlib.com)')

legend = ax.legend()
for i, text in enumerate(legend.get_texts()):
    text.set_color(colors[i % len(colors)])

plt.show()
Output:
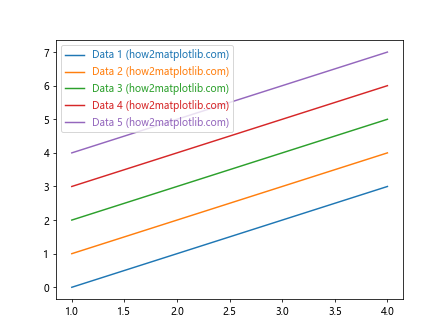
这个示例中,我们使用 Matplotlib 内置的 TABLEAU 颜色循环来为多个数据系列的图例标签设置不同的颜色。
2.3 设置图例标题颜色
除了图例标签,我们还可以设置图例标题的颜色。
import matplotlib.pyplot as plt

fig, ax = plt.subplots()
ax.plot([1, 2, 3, 4], [1, 4, 2, 3], label='Data 1 (how2matplotlib.com)')
ax.plot([1, 2, 3, 4], [3, 2, 4, 1], label='Data 2 (how2matplotlib.com)')

legend = ax.legend(title='Legend Title (how2matplotlib.com)')
legend.get_title().set_color('purple')

plt.show()
Output:
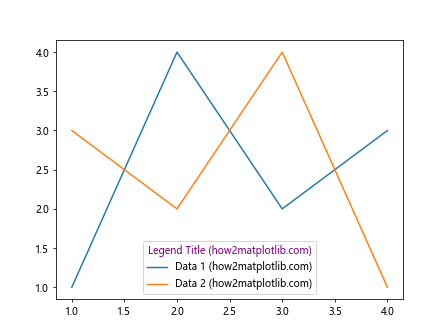
在这个例子中,我们创建了一个带有标题的图例,并将标题颜色设置为紫色。
3. 文本标签颜色设置
在图表中,我们经常需要添加额外的文本标签来解释数据或突出重要信息。设置适当的文本颜色可以帮助这些标签更好地融入图表或突出显示。
3.1 使用 text() 方法添加彩色文本
我们可以使用 text() 方法在图表的任意位置添加文本,并设置其颜色。
import matplotlib.pyplot as plt

fig, ax = plt.subplots()
ax.plot([1, 2, 3, 4], [1, 4, 2, 3])

ax.text(2, 3, 'Important Point (how2matplotlib.com)', color='red', fontweight='bold')
ax.text(3, 1, 'Note (how2matplotlib.com)', color='blue', style='italic')

plt.show()
Output:
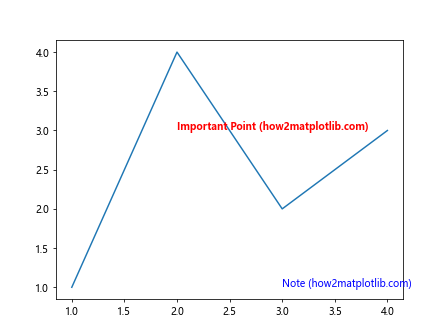
在这个示例中,我们添加了两个文本标签,一个是红色的粗体文本,另一个是蓝色的斜体文本。
3.2 使用 annotate() 方法添加带箭头的彩色注释
annotate() 方法允许我们添加带箭头的注释,这在指出图表中的特定点时非常有用。
import matplotlib.pyplot as plt

fig, ax = plt.subplots()
ax.plot([1, 2, 3, 4], [1, 4, 2, 3])

ax.annotate('Peak (how2matplotlib.com)', xy=(2, 4), xytext=(3, 4.5),
            arrowprops=dict(facecolor='green', shrink=0.05),
            color='green')

plt.show()
Output:
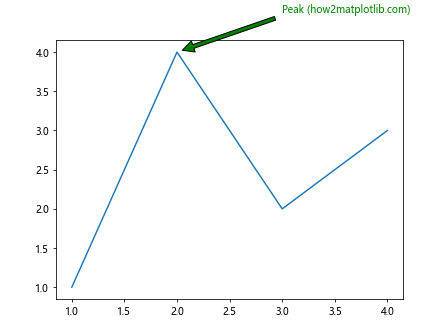
这个例子中,我们添加了一个绿色的注释,指向数据的峰值点。注释文本和箭头都是绿色的。
3.3 使用 ColorMap 为文本设置渐变色
我们可以使用 ColorMap 为文本设置渐变色,这在表示数值大小或重要性时特别有用。
import matplotlib.pyplot as plt
import numpy as np

fig, ax = plt.subplots()
ax.set_xlim(0, 10)
ax.set_ylim(0, 10)

cmap = plt.get_cmap('viridis')
for i in range(10):
    color = cmap(i / 10)
    ax.text(i, 5, f'Text {i} (how2matplotlib.com)', color=color, ha='center')

plt.show()
Output:
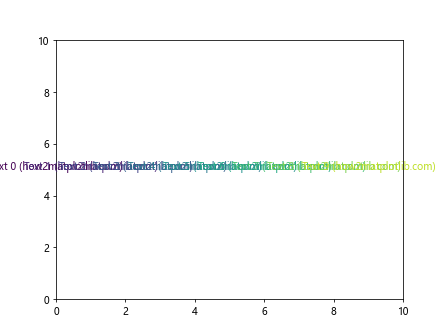
在这个示例中,我们使用 ‘viridis’ 颜色映射为一系列文本设置了渐变色。
4. 柱状图和条形图的标签颜色设置
在柱状图和条形图中,标签的颜色设置可以帮助我们更好地区分不同的类别或强调某些特定的数据。
4.1 设置柱状图的标签颜色
我们可以为柱状图的每个柱子设置不同的颜色,并相应地设置标签颜色。
import matplotlib.pyplot as plt

categories = ['A', 'B', 'C', 'D']
values = [3, 7, 2, 5]
colors = ['red', 'green', 'blue', 'orange']

fig, ax = plt.subplots()
bars = ax.bar(categories, values, color=colors)

for bar in bars:
    height = bar.get_height()
    ax.text(bar.get_x() + bar.get_width()/2, height,
            f'{height} (how2matplotlib.com)',
            ha='center', va='bottom', color=bar.get_facecolor())

plt.show()
Output:
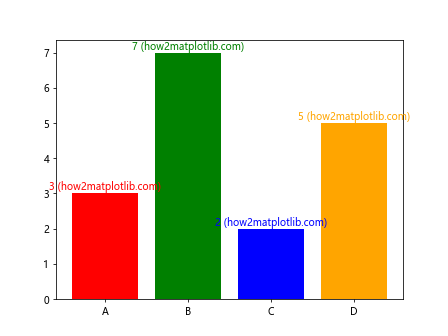
在这个例子中,我们创建了一个柱状图,每个柱子都有不同的颜色。我们还在每个柱子上方添加了与柱子颜色相同的文本标签。
4.2 设置水平条形图的标签颜色
对于水平条形图,我们可以类似地设置标签颜色。
import matplotlib.pyplot as plt

categories = ['Category A (how2matplotlib.com)', 'Category B (how2matplotlib.com)',
              'Category C (how2matplotlib.com)', 'Category D (how2matplotlib.com)']
values = [4, 7, 1, 6]
colors = ['#FF9999', '#66B2FF', '#99FF99', '#FFCC99']

fig, ax = plt.subplots()
bars = ax.barh(categories, values, color=colors)

for bar in bars:
    width = bar.get_width()
    ax.text(width, bar.get_y() + bar.get_height()/2,
            f'{width}',
            va='center', ha='left', color=bar.get_facecolor())

plt.show()
Output:
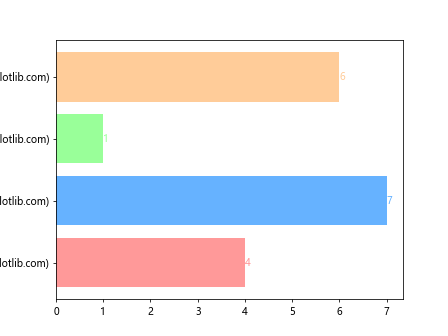
这个示例创建了一个水平条形图,每个条形都有不同的颜色,并在条形末端添加了相应颜色的标签。
4.3 使用颜色映射设置分组柱状图的标签颜色
对于分组柱状图,我们可以使用颜色映射来设置不同组的颜色和标签。
import matplotlib.pyplot as plt
import numpy as np

labels = ['Group A', 'Group B', 'Group C']
men_means = [20, 35, 30]
women_means = [25, 32, 34]

x = np.arange(len(labels))
width = 0.35

fig, ax = plt.subplots()
rects1 = ax.bar(x - width/2, men_means, width, label='Men (how2matplotlib.com)')
rects2 = ax.bar(x + width/2, women_means, width, label='Women (how2matplotlib.com)')

ax.set_ylabel('Scores')
ax.set_title('Scores by group and gender')
ax.set_xticks(x)
ax.set_xticklabels(labels)
ax.legend()

def autolabel(rects):
    for rect in rects:
        height = rect.get_height()
        ax.annotate(f'{height}',
                    xy=(rect.get_x() + rect.get_width() / 2, height),
                    xytext=(0, 3),
                    textcoords="offset points",
                    ha='center', va='bottom',
                    color=rect.get_facecolor())

autolabel(rects1)
autolabel(rects2)

plt.show()
Output:

在这个例子中,我们创建了一个分组柱状图,每组有两个柱子,分别代表男性和女性的得分。我们为每个柱子添加了与柱子颜色相同的标签。
5. 散点图的标签颜色设置
散点图是展示两个变量之间关系的有效方式,通过设置适当的标签颜色,我们可以更好地区分不同类别的数据点或突出特定的数据点。
5.1 使用颜色映射设置散点图的颜色和标签
我们可以使用颜色映射来根据数据的某个属性设置散点的颜色,并相应地设置标签颜色。
import matplotlib.pyplot as plt
import numpy as np

np.random.seed(42)
x = np.random.rand(50)
y = np.random.rand(50)
colors = np.random.rand(50)
sizes = 1000 * np.random.rand(50)

fig, ax = plt.subplots()
scatter = ax.scatter(x, y, c=colors, s=sizes, alpha=0.5, cmap='viridis')

colorbar = plt.colorbar(scatter)
colorbar.set_label('Color Value (how2matplotlib.com)', color='purple')

for i, (x_val, y_val) in enumerate(zip(x, y)):
    ax.annotate(f'Point {i} (how2matplotlib.com)', (x_val, y_val),
                xytext=(5, 5), textcoords='offset points',
                color=plt.cm.viridis(colors[i]))

plt.show()
Output:
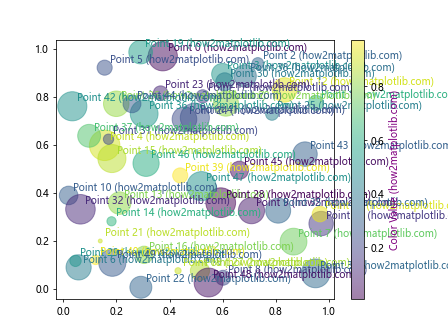
在这个示例中,我们创建了一个散点图,点的颜色和大小都是随机生成的。我们使用 ‘viridis’ 颜色映射来设置点的颜色,并为每个点添加了相应颜色的标签。
5.2 为不同类别的散点设置不同的颜色和标签
当散点图表示不同类别的数据时,我们可以为每个类别设置不同的颜色和标签。
import matplotlib.pyplot as plt
import numpy as np

np.random.seed(42)
x1 = np.random.rand(20)
y1 = np.random.rand(20)
x2 = np.random.rand(20) + 0.5
y2 = np.random.rand(20) + 0.5
x3 = np.random.rand(20) + 1
y3 = np.random.rand(20) + 1

fig, ax = plt.subplots()
ax.scatter(x1, y1, c='red', label='Class A (how2matplotlib.com)')
ax.scatter(x2, y2, c='blue', label='Class B (how2matplotlib.com)')
ax.scatter(x3, y3, c='green', label='Class C (how2matplotlib.com)')

ax.legend()

for x, y, c in zip(np.concatenate([x1, x2, x3]),
                   np.concatenate([y1, y2, y3]),
                   ['red']*20 + ['blue']*20 + ['green']*20):
    ax.annotate(f'({x:.2f}, {y:.2f})', (x, y),
                xytext=(5, 5), textcoords='offset points',
                color=c, fontsize=8)

plt.show()
Output:
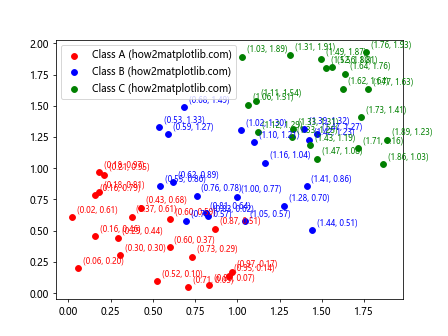
这个例子中,我们创建了三类散点,每类使用不同的颜色。我们还为每个点添加了坐标标签,标签颜色与点的颜色相匹配。
5.3 使用渐变色标签突出重要数据点
我们可以使用渐变色来突出显示某些重要的数据点。
import matplotlib.pyplot as plt
import numpy as np

np.random.seed(42)
x = np.random.rand(50)
y = np.random.rand(50)
importance = np.random.rand(50)

fig, ax = plt.subplots()
scatter = ax.scatter(x, y, c=importance, cmap='YlOrRd', s=100)

plt.colorbar(scatter, label='Importance (how2matplotlib.com)')

for i, (x_val, y_val, imp) in enumerate(zip(x, y, importance)):
    if imp > 0.8:  # 只标注重要性大于0.8的点
        ax.annotate(f'Important Point {i} (how2matplotlib.com)', (x_val, y_val),
                    xytext=(5, 5), textcoords='offset points',
                    color=plt.cm.YlOrRd(imp), fontweight='bold')

plt.show()
Output:
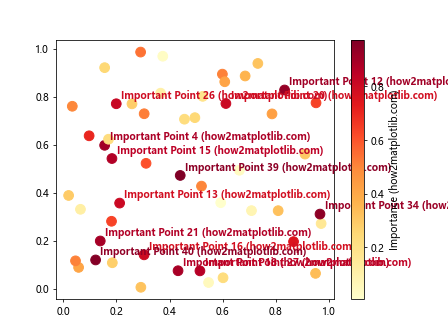
在这个示例中,我们使用 ‘YlOrRd’ 颜色映射来表示数据点的重要性。对于重要性超过某个阈值的点,我们添加了带有渐变色的标签。
6. 饼图的标签颜色设置
饼图是展示部分与整体关系的有效图表类型。通过设置适当的标签颜色,我们可以增强饼图的可读性和美观性。
6.1 设置饼图扇区和标签的颜色
我们可以为饼图的每个扇区设置不同的颜色,并相应地设置标签颜色。
import matplotlib.pyplot as plt

sizes = [30, 25, 20, 15, 10]
labels = ['A (how2matplotlib.com)', 'B (how2matplotlib.com)',
          'C (how2matplotlib.com)', 'D (how2matplotlib.com)',
          'E (how2matplotlib.com)']
colors = ['#ff9999', '#66b3ff', '#99ff99', '#ffcc99', '#ff99cc']

fig, ax = plt.subplots()
wedges, texts, autotexts = ax.pie(sizes, labels=labels, colors=colors,
                                  autopct='%1.1f%%', startangle=90)

for text, autotext, color in zip(texts, autotexts, colors):
    text.set_color(color)
    autotext.set_color('white')

ax.axis('equal')
plt.show()
Output:
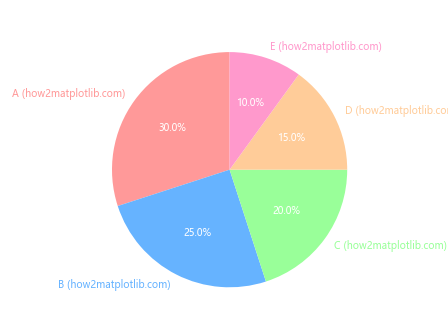
在这个例子中,我们创建了一个饼图,每个扇区都有不同的颜色。我们将扇区标签的颜色设置为与扇区相同,而将百分比标签设置为白色以增加对比度。
6.2 使用颜色映射设置饼图标签颜色
我们可以使用颜色映射来为饼图的扇区和标签设置渐变色。
import matplotlib.pyplot as plt
import numpy as np

sizes = [30, 25, 20, 15, 10]
labels = ['A (how2matplotlib.com)', 'B (how2matplotlib.com)',
          'C (how2matplotlib.com)', 'D (how2matplotlib.com)',
          'E (how2matplotlib.com)']

cmap = plt.get_cmap('coolwarm')
colors = cmap(np.linspace(0, 1, len(sizes)))

fig, ax = plt.subplots()
wedges, texts, autotexts = ax.pie(sizes, labels=labels, colors=colors,
                                  autopct='%1.1f%%', startangle=90)

for text, autotext, color in zip(texts, autotexts, colors):
    text.set_color(color)
    autotext.set_color('white')

ax.axis('equal')
plt.show()
Output:
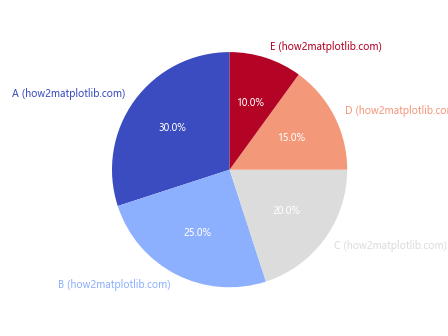
这个示例使用 ‘coolwarm’ 颜色映射为饼图的扇区和标签创建了一个渐变色方案。
6.3 突出显示特定扇区的标签
我们可以通过调整某些扇区的颜色和标签样式来突出显示它们。
import matplotlib.pyplot as plt

sizes = [30, 25, 20, 15, 10]
labels = ['A (how2matplotlib.com)', 'B (how2matplotlib.com)',
          'C (how2matplotlib.com)', 'D (how2matplotlib.com)',
          'E (how2matplotlib.com)']
colors = ['#ff9999', '#66b3ff', '#99ff99', '#ffcc99', '#ff99cc']
explode = (0.1, 0, 0, 0, 0)  # 突出显示第一个扇区

fig, ax = plt.subplots()
wedges, texts, autotexts = ax.pie(sizes, explode=explode, labels=labels, colors=colors,
                                  autopct='%1.1f%%', startangle=90,
                                  shadow=True, radius=0.7)

for i, (text, autotext) in enumerate(zip(texts, autotexts)):
    if i == 0:  # 突出显示第一个扇区的标签
        text.set_fontweight('bold')
        text.set_color('red')
        autotext.set_color('white')
        autotext.set_fontweight('bold')
    else:
        text.set_color(colors[i])
        autotext.set_color('white')

ax.axis('equal')
plt.show()
Output:
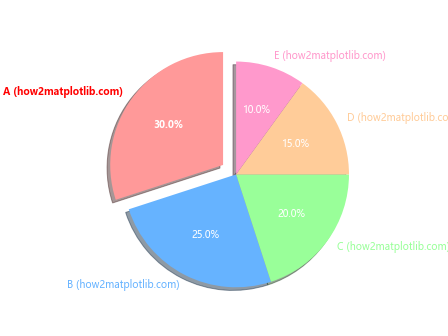
在这个例子中,我们突出显示了饼图的第一个扇区,使其略微分离,并将其标签设置为粗体红色。
7. 3D 图表的标签颜色设置
3D 图表可以提供更丰富的数据可视化效果。通过适当设置标签颜色,我们可以增强 3D 图表的可读性和立体感。
7.1 设置 3D 散点图的标签颜色
在 3D 散点图中,我们可以根据数据点的属性设置不同的颜色,并相应地设置标签颜色。
import matplotlib.pyplot as plt
import numpy as np

fig = plt.figure()
ax = fig.add_subplot(111, projection='3d')

n = 100
xs = np.random.rand(n)
ys = np.random.rand(n)
zs = np.random.rand(n)
colors = np.random.rand(n)

scatter = ax.scatter(xs, ys, zs, c=colors, cmap='viridis')

ax.set_xlabel('X Label (how2matplotlib.com)', color='red')
ax.set_ylabel('Y Label (how2matplotlib.com)', color='green')
ax.set_zlabel('Z Label (how2matplotlib.com)', color='blue')

for i in range(n):
    if colors[i] > 0.8:  # 只标注颜色值大于0.8的点
        ax.text(xs[i], ys[i], zs[i], f'Point {i}', color=plt.cm.viridis(colors[i]))

plt.colorbar(scatter)
plt.show()
Output:
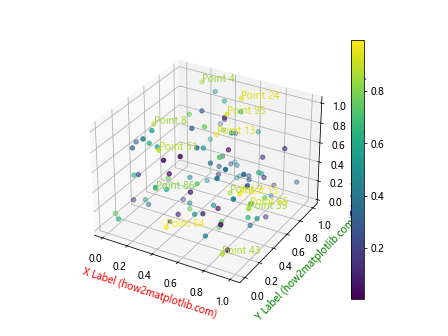
这个示例创建了一个 3D 散点图,点的颜色根据随机生成的值来确定。我们为坐标轴设置了不同的颜色,并为颜色值较高的点添加了标签。
7.2 设置 3D 柱状图的标签颜色
对于 3D 柱状图,我们可以为每个柱子设置不同的颜色,并相应地设置标签颜色。
import matplotlib.pyplot as plt
import numpy as np

fig = plt.figure()
ax = fig.add_subplot(111, projection='3d')

x = np.arange(5)
y = np.arange(5)
z = np.random.randint(10, 50, size=(5, 5))

x, y = np.meshgrid(x, y)
x = x.flatten()
y = y.flatten()
z = z.flatten()

colors = plt.cm.viridis(z / float(max(z)))

ax.bar3d(x, y, np.zeros_like(z), 1, 1, z, color=colors)

ax.set_xlabel('X Label (how2matplotlib.com)', color='red')
ax.set_ylabel('Y Label (how2matplotlib.com)', color='green')
ax.set_zlabel('Z Label (how2matplotlib.com)', color='blue')

for xi, yi, zi, color in zip(x, y, z, colors):
    ax.text(xi, yi, zi, f'{zi}', color=color, ha='center', va='bottom')

plt.show()
Output:
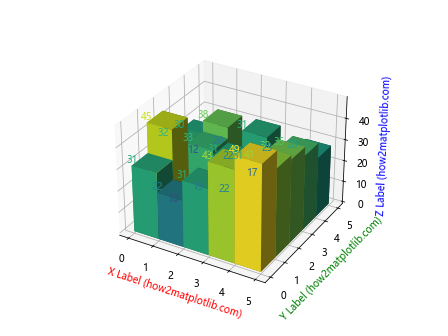
在这个例子中,我们创建了一个 3D 柱状图,柱子的颜色根据高度来确定。我们为每个柱子顶部添加了与柱子颜色相同的标签。
7.3 设置 3D 曲面图的标签颜色
对于 3D 曲面图,我们可以使用颜色映射来表示高度,并相应地设置标签颜色。
import matplotlib.pyplot as plt
import numpy as np
from matplotlib import cm

fig = plt.figure()
ax = fig.add_subplot(111, projection='3d')

X = np.arange(-5, 5, 0.25)
Y = np.arange(-5, 5, 0.25)
X, Y = np.meshgrid(X, Y)
R = np.sqrt(X**2 + Y**2)
Z = np.sin(R)

surf = ax.plot_surface(X, Y, Z, cmap=cm.coolwarm, linewidth=0, antialiased=False)

ax.set_xlabel('X Label (how2matplotlib.com)', color='red')
ax.set_ylabel('Y Label (how2matplotlib.com)', color='green')
ax.set_zlabel('Z Label (how2matplotlib.com)', color='blue')

fig.colorbar(surf, shrink=0.5, aspect=5)

# 添加一些文本标签
ax.text(0, 0, 1, 'Peak (how2matplotlib.com)', color='yellow')
ax.text(4, 4, -1, 'Valley (how2matplotlib.com)', color='purple')

plt.show()
Output:
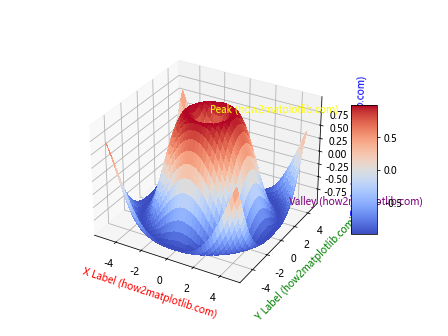
这个示例创建了一个 3D 曲面图,使用 ‘coolwarm’ 颜色映射来表示高度。我们为图表添加了彩色的坐标轴标签,并在曲面的特定位置添加了文本标签。
8. 动态图表中的标签颜色设置
在创建动态或交互式图表时,我们可能需要动态地更新标签颜色。这可以通过 Matplotlib 的动画功能或与其他库(如 ipywidgets)结合来实现。
8.1 使用动画更新标签颜色
我们可以创建一个简单的动画,其中标签的颜色随时间变化。
import matplotlib.pyplot as plt
import matplotlib.animation as animation
import numpy as np

fig, ax = plt.subplots()
x = np.linspace(0, 2*np.pi, 100)
line, = ax.plot(x, np.sin(x))

text = ax.text(np.pi, 0, 'Sine Wave (how2matplotlib.com)', ha='center', va='center')

def update(frame):
    line.set_ydata(np.sin(x + frame/10))
    color = plt.cm.viridis(frame / 100)
    text.set_color(color)
    return line, text

ani = animation.FuncAnimation(fig, update, frames=100, blit=True)
plt.show()
Output:
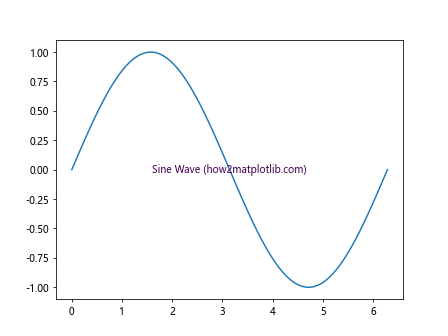
这个示例创建了一个正弦波的动画,文本标签的颜色随着动画的进行而变化。
8.2 使用交互式控件调整标签颜色
通过结合使用 ipywidgets,我们可以创建交互式控件来调整标签颜色。
import matplotlib.pyplot as plt
import ipywidgets as widgets
from IPython.display import display

fig, ax = plt.subplots()
ax.plot([1, 2, 3, 4], [1, 4, 2, 3])

text = ax.text(2, 3, 'Interactive Label (how2matplotlib.com)', ha='center', va='center')

def update_color(r, g, b):
    text.set_color((r/255, g/255, b/255))
    fig.canvas.draw_idle()

r_slider = widgets.IntSlider(value=0, min=0, max=255, description='Red:')
g_slider = widgets.IntSlider(value=0, min=0, max=255, description='Green:')
b_slider = widgets.IntSlider(value=0, min=0, max=255, description='Blue:')

widgets.interactive(update_color, r=r_slider, g=g_slider, b=b_slider)

display(r_slider, g_slider, b_slider)
plt.show()
这个示例创建了三个滑块,允许用户交互式地调整文本标签的 RGB 颜色值。
9. 高级标签颜色技巧
除了基本的颜色设置,Matplotlib 还提供了一些高级技巧来增强标签的视觉效果。
9.1 使用渐变色文本
我们可以创建具有渐变色效果的文本标签。
import matplotlib.pyplot as plt
from matplotlib import transforms
import numpy as np

fig, ax = plt.subplots()

t = ax.text(0.5, 0.5, 'Gradient Text (how2matplotlib.com)', ha='center', va='center', fontsize=20)

# 创建渐变色
gradient = np.linspace(0, 1, 100).reshape(1, -1)
gradient = np.vstack((gradient, gradient))

# 应用渐变色
t.set_path_effects([plt.patheffects.withTexture(plt.cm.viridis(gradient))])

ax.set_xlim(0, 1)
ax.set_ylim(0, 1)

plt.show()
这个示例创建了一个具有渐变色效果的文本标签,使用了 ‘viridis’ 颜色映射。
9.2 使用阴影效果增强标签可读性
在复杂的背景上,我们可以为标签添加阴影效果以增强可读性。
import matplotlib.pyplot as plt
import numpy as np
from matplotlib import patheffects

fig, ax = plt.subplots()

# 创建复杂背景
x = np.linspace(0, 10, 1000)
y = np.sin(x) + np.random.randn(1000) * 0.1
ax.plot(x, y, 'k-', lw=0.5, alpha=0.3)

# 添加带阴影的文本
text = ax.text(5, 0, 'Shadow Text (how2matplotlib.com)', color='white', fontsize=20,
               ha='center', va='center')

text.set_path_effects([
    patheffects.withStroke(linewidth=3, foreground='black'),
    patheffects.Normal()
])

plt.show()
Output:

这个例子在一个复杂的背景上添加了一个带有黑色阴影的白色文本标签,增强了文本的可读性。
9.3 使用颜色映射创建彩虹文本
我们可以使用颜色映射为文本的每个字符设置不同的颜色,创建彩虹效果。
import matplotlib.pyplot as plt
import numpy as np

fig, ax = plt.subplots()

text = "Rainbow Text (how2matplotlib.com)"
cmap = plt.get_cmap('rainbow')
colors = [cmap(i/len(text)) for i in range(len(text))]

for i, c in enumerate(text):
    ax.text(i*0.05, 0.5, c, color=colors[i], fontsize=20)

ax.set_xlim(0, 1)
ax.set_ylim(0, 1)
ax.axis('off')

plt.show()
Output:
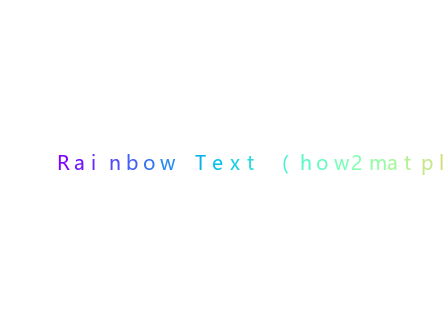
这个示例为文本的每个字符使用了不同的颜色,创造出彩虹效果。
10. 标签颜色与整体设计的协调
在设置标签颜色时,我们需要考虑整体图表设计的协调性。以下是一些建议和技巧:
10.1 使用配色方案
选择一个合适的配色方案可以使整个图表看起来更加专业和协调。
import matplotlib.pyplot as plt
import numpy as np

# 定义配色方案
colors = ['#1f77b4', '#ff7f0e', '#2ca02c', '#d62728', '#9467bd']

fig, ax = plt.subplots()

for i in range(5):
    x = np.linspace(0, 10, 100)
    y = np.sin(x + i*0.5) * (i+1)
    ax.plot(x, y, color=colors[i], label=f'Line {i+1} (how2matplotlib.com)')

ax.set_xlabel('X-axis', color=colors[0])
ax.set_ylabel('Y-axis', color=colors[1])
ax.set_title('Harmonious Color Scheme', color=colors[2])

ax.legend()

for spine in ax.spines.values():
    spine.set_color(colors[3])

ax.tick_params(colors=colors[4])

plt.show()
Output:
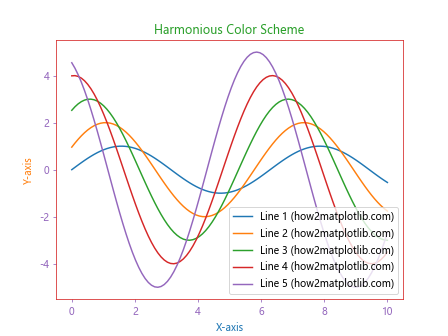
这个示例使用了一个预定义的配色方案,使图表的各个元素颜色协调一致。
10.2 考虑背景色
在设置标签颜色时,需要考虑背景色以确保足够的对比度。
import matplotlib.pyplot as plt
import numpy as np

fig, (ax1, ax2) = plt.subplots(1, 2, figsize=(12, 5))

# 浅色背景
ax1.set_facecolor('#f0f0f0')
ax1.plot([1, 2, 3, 4], [1, 4, 2, 3], 'k-')
ax1.set_title('Light Background (how2matplotlib.com)', color='#333333')
ax1.set_xlabel('X-axis', color='#666666')
ax1.set_ylabel('Y-axis', color='#666666')

# 深色背景
ax2.set_facecolor('#333333')
ax2.plot([1, 2, 3, 4], [1, 4, 2, 3], 'w-')
ax2.set_title('Dark Background (how2matplotlib.com)', color='#ffffff')
ax2.set_xlabel('X-axis', color='#cccccc')
ax2.set_ylabel('Y-axis', color='#cccccc')

plt.show()
Output:
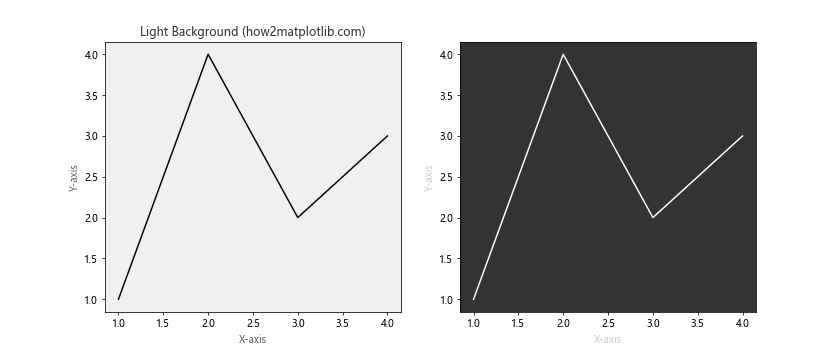
这个例子展示了如何在浅色和深色背景上选择合适的标签颜色。
10.3 使用对比色突出重要信息
我们可以使用对比色来突出图表中的重要信息。
import matplotlib.pyplot as plt
import numpy as np

fig, ax = plt.subplots()

x = np.linspace(0, 10, 100)
y1 = np.sin(x)
y2 = np.cos(x)

ax.plot(x, y1, color='#1f77b4', label='Sin (how2matplotlib.com)')
ax.plot(x, y2, color='#ff7f0e', label='Cos (how2matplotlib.com)')

ax.set_xlabel('X-axis', color='#333333')
ax.set_ylabel('Y-axis', color='#333333')
ax.set_title('Sine and Cosine', color='#333333')

# 突出显示重要点
ax.plot(np.pi/2, 1, 'ro', markersize=10)
ax.annotate('Important Point', xy=(np.pi/2, 1), xytext=(np.pi/2+0.5, 1.2),
            arrowprops=dict(facecolor='red', shrink=0.05),
            color='red', fontweight='bold')

ax.legend()

plt.show()
Output:
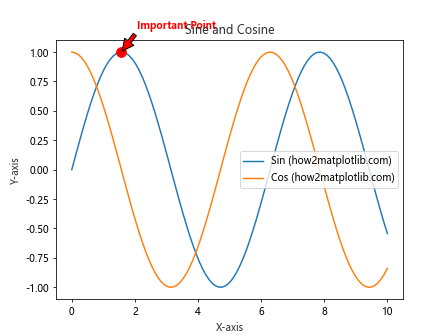
在这个示例中,我们使用红色来突出标注一个重要的数据点,使其在图表中更加醒目。
结论
通过本文的详细探讨,我们深入了解了 Matplotlib 中标签颜色设置的各种方法和技巧。从基本的坐标轴标签到复杂的 3D 图表,从静态图表到动态交互式图表,我们都提供了丰富的示例和实用技巧。
正确设置标签颜色不仅可以增强图表的美观性,还能提高数据的可读性和解释性。在实际应用中,我们需要根据具体的数据特征、图表类型和整体设计来选择合适的颜色方案。同时,也要考虑到色盲友好性和打印效果等因素。
通过灵活运用本文介绍的各种技巧,相信你能够创建出更加专业、美观且信息丰富的数据可视化图表。记住,颜色的选择和使用是一门艺术,需要不断实践和优化才能达到最佳效果。
 极客笔记
极客笔记