Matplotlib中使用十六进制颜色:全面指南与实用技巧
Matplotlib是Python中最流行的数据可视化库之一,它提供了丰富的绘图功能和自定义选项。在创建图表时,颜色选择扮演着至关重要的角色,而十六进制颜色代码是一种广泛使用的颜色表示方法。本文将深入探讨如何在Matplotlib中使用十六进制颜色,包括基本概念、应用技巧以及高级用法。
1. 十六进制颜色简介
十六进制颜色是一种使用十六进制值来表示颜色的方法。它通常由6位十六进制数字组成,前两位表示红色(R),中间两位表示绿色(G),最后两位表示蓝色(B)。每个颜色通道的取值范围是00到FF,对应十进制的0到255。
例如:
– #FF0000 表示纯红色
– #00FF00 表示纯绿色
– #0000FF 表示纯蓝色
– #000000 表示黑色
– #FFFFFF 表示白色
在Matplotlib中,我们可以直接使用这种格式来指定颜色。下面是一个简单的示例:
import matplotlib.pyplot as plt

plt.figure(figsize=(8, 6))
plt.plot([1, 2, 3, 4], [1, 4, 2, 3], color='#FF0000', linewidth=2, label='how2matplotlib.com')
plt.title('Using Hex Color in Matplotlib')
plt.xlabel('X-axis')
plt.ylabel('Y-axis')
plt.legend()
plt.show()
Output:
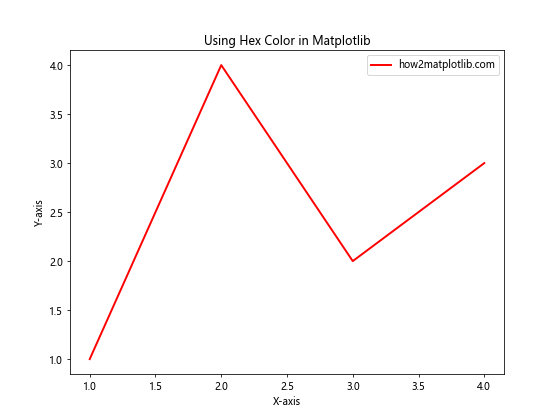
在这个例子中,我们使用#FF0000(纯红色)作为线条的颜色。
2. 在Matplotlib中使用十六进制颜色的优势
使用十六进制颜色在Matplotlib中有以下几个优点:
- 精确控制:可以精确地指定任何颜色。
- 广泛兼容:十六进制颜色代码在各种编程语言和设计工具中都被广泛支持。
- 易于复制和共享:可以轻松地在不同的图表或项目之间复制和共享颜色。
- 与Web设计一致:如果你同时进行Web开发,可以保持颜色的一致性。
3. 基本用法
在Matplotlib中,你可以在大多数接受颜色参数的函数中使用十六进制颜色。以下是一些常见的用法:
3.1 设置线条颜色
import matplotlib.pyplot as plt

plt.figure(figsize=(10, 6))
plt.plot([1, 2, 3, 4], [1, 4, 2, 3], color='#1E90FF', linewidth=2, label='how2matplotlib.com')
plt.plot([1, 2, 3, 4], [2, 3, 4, 1], color='#FF69B4', linewidth=2, label='how2matplotlib.com')
plt.title('Multiple Lines with Hex Colors')
plt.xlabel('X-axis')
plt.ylabel('Y-axis')
plt.legend()
plt.show()
Output:
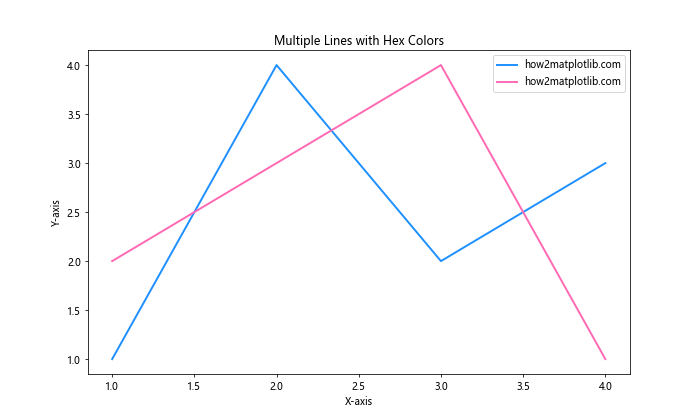
在这个例子中,我们使用#1E90FF(道奇蓝)和#FF69B4(热粉红)来设置两条线的颜色。
3.2 设置散点图的颜色
import matplotlib.pyplot as plt
import numpy as np

np.random.seed(42)
x = np.random.rand(50)
y = np.random.rand(50)

plt.figure(figsize=(8, 6))
plt.scatter(x, y, c='#32CD32', s=100, alpha=0.7, label='how2matplotlib.com')
plt.title('Scatter Plot with Hex Color')
plt.xlabel('X-axis')
plt.ylabel('Y-axis')
plt.legend()
plt.show()
Output:
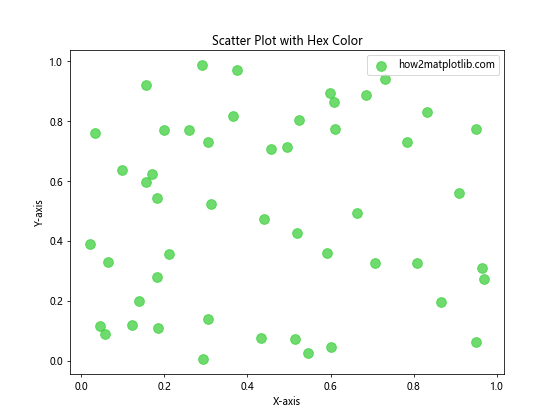
这里我们使用#32CD32(酸橙绿)作为散点的颜色。
3.3 设置柱状图的颜色
import matplotlib.pyplot as plt

categories = ['A', 'B', 'C', 'D']
values = [4, 7, 2, 6]

plt.figure(figsize=(8, 6))
plt.bar(categories, values, color='#8A2BE2', label='how2matplotlib.com')
plt.title('Bar Chart with Hex Color')
plt.xlabel('Categories')
plt.ylabel('Values')
plt.legend()
plt.show()
Output:
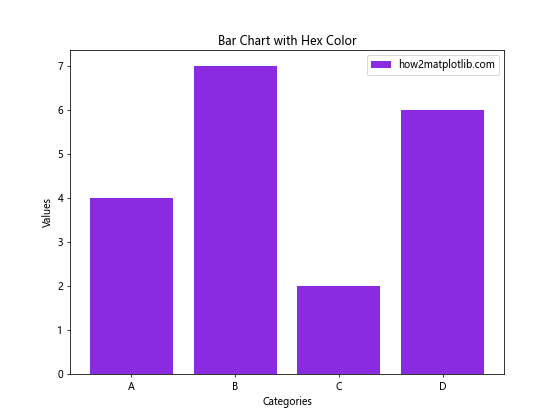
在这个柱状图中,我们使用#8A2BE2(紫罗兰蓝色)作为柱子的颜色。
4. 高级技巧
4.1 使用透明度
十六进制颜色也可以包含透明度信息。在6位颜色代码后添加两位表示透明度,范围从00(完全透明)到FF(完全不透明)。
import matplotlib.pyplot as plt
import numpy as np

x = np.linspace(0, 10, 100)
y1 = np.sin(x)
y2 = np.cos(x)

plt.figure(figsize=(10, 6))
plt.fill_between(x, y1, color='#FF000080', label='how2matplotlib.com Sin')
plt.fill_between(x, y2, color='#0000FF80', label='how2matplotlib.com Cos')
plt.title('Using Hex Colors with Transparency')
plt.xlabel('X-axis')
plt.ylabel('Y-axis')
plt.legend()
plt.show()
Output:
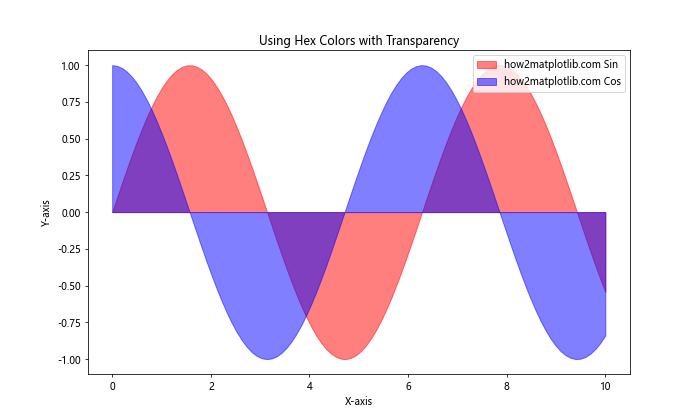
在这个例子中,#FF000080表示半透明的红色,#0000FF80表示半透明的蓝色。
4.2 创建颜色渐变
你可以使用十六进制颜色创建颜色渐变效果:
import matplotlib.pyplot as plt
import numpy as np

def hex_to_rgb(hex_color):
    return tuple(int(hex_color[i:i+2], 16) for i in (1, 3, 5))

def interpolate_color(color1, color2, factor):
    rgb1 = hex_to_rgb(color1)
    rgb2 = hex_to_rgb(color2)
    return tuple(int(rgb1[i] + factor * (rgb2[i] - rgb1[i])) for i in range(3))

start_color = '#FF0000'  # Red
end_color = '#0000FF'    # Blue

x = np.linspace(0, 10, 100)
y = np.sin(x)

plt.figure(figsize=(10, 6))
for i in range(100):
    factor = i / 99
    color = interpolate_color(start_color, end_color, factor)
    hex_color = '#{:02x}{:02x}{:02x}'.format(*color)
    plt.plot(x[i:i+2], y[i:i+2], color=hex_color, linewidth=2)

plt.title('Color Gradient using Hex Colors')
plt.xlabel('X-axis')
plt.ylabel('Y-axis')
plt.text(5, 0, 'how2matplotlib.com', ha='center', va='center')
plt.show()
Output:
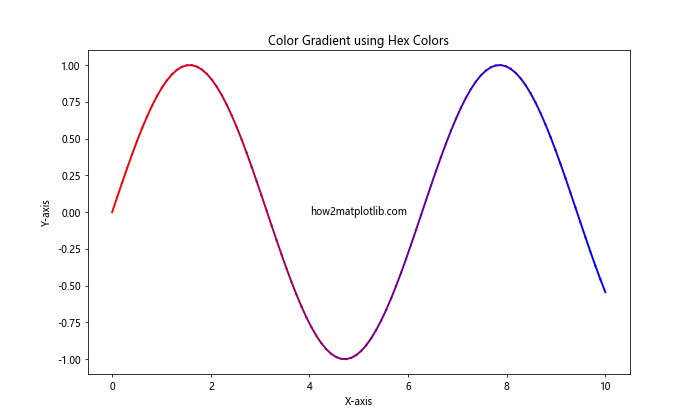
这个例子展示了如何创建从红色到蓝色的渐变效果。
4.3 使用自定义颜色映射
你可以使用十六进制颜色创建自定义的颜色映射:
import matplotlib.pyplot as plt
import matplotlib.colors as mcolors
import numpy as np

custom_colors = ['#FF0000', '#00FF00', '#0000FF', '#FFFF00', '#FF00FF']
n_bins = 100
custom_cmap = mcolors.LinearSegmentedColormap.from_list('custom', custom_colors, N=n_bins)

data = np.random.randn(100, 100)

plt.figure(figsize=(10, 8))
plt.imshow(data, cmap=custom_cmap)
plt.colorbar(label='how2matplotlib.com')
plt.title('Custom Colormap with Hex Colors')
plt.show()
Output:
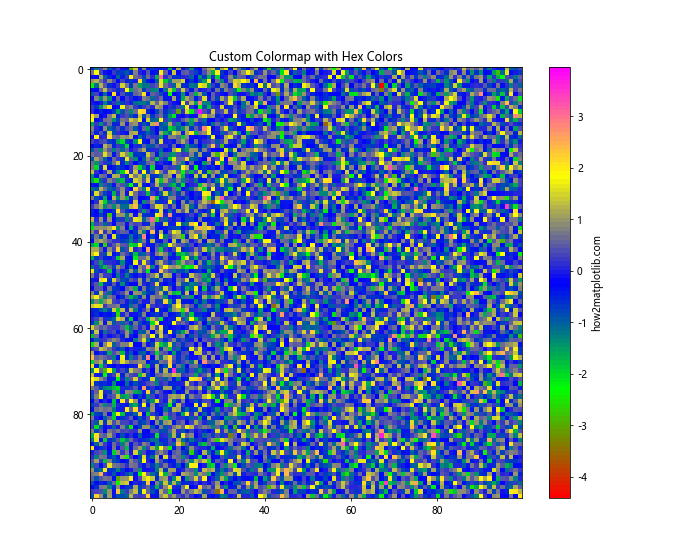
这个例子创建了一个使用五种不同十六进制颜色的自定义颜色映射。
5. 颜色选择技巧
5.1 使用在线颜色选择器
有许多在线工具可以帮助你选择合适的十六进制颜色:
- Adobe Color: https://color.adobe.com/
- Coolors: https://coolors.co/
- ColorHexa: https://www.colorhexa.com/
这些工具可以帮助你创建和探索颜色方案。
5.2 考虑色彩理论
在选择颜色时,考虑以下几点:
- 对比度:确保文本和背景之间有足够的对比度。
- 色彩和谐:使用互补色或类似色可以创造和谐的视觉效果。
- 色彩心理学:不同的颜色可能会引起不同的情感反应。
5.3 考虑可访问性
选择颜色时,要考虑色盲用户:
import matplotlib.pyplot as plt
import numpy as np

# 色盲友好的颜色方案
colors = ['#E69F00', '#56B4E9', '#009E73', '#F0E442', '#0072B2', '#D55E00', '#CC79A7']

data = np.random.rand(7, 5)

plt.figure(figsize=(12, 6))
for i in range(7):
    plt.plot(range(5), data[i], color=colors[i], linewidth=2, label=f'Line {i+1}')

plt.title('Color-Blind Friendly Plot')
plt.xlabel('X-axis')
plt.ylabel('Y-axis')
plt.legend()
plt.text(2, 0.5, 'how2matplotlib.com', ha='center', va='center')
plt.show()
Output:
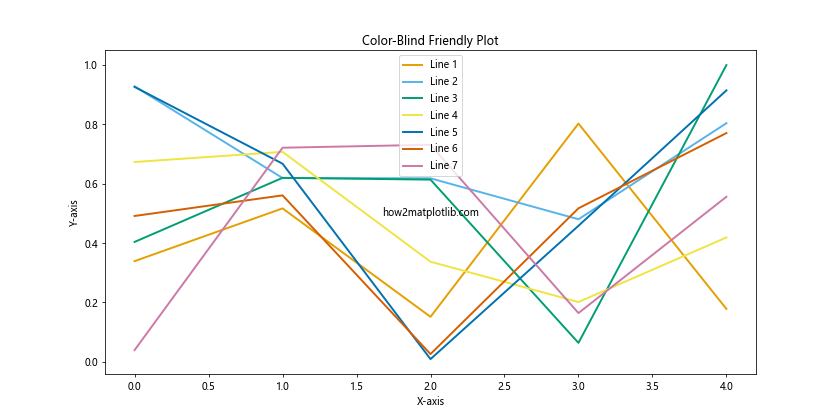
这个例子使用了一组色盲友好的颜色方案。
6. 常见问题和解决方案
6.1 颜色不显示
如果你的十六进制颜色没有正确显示,请检查以下几点:
- 确保颜色代码前有
#符号。 - 确保使用的是有效的十六进制字符(0-9和A-F)。
- 确保颜色代码的长度正确(6位或8位,包括透明度)。
6.2 颜色看起来不正确
如果颜色看起来不正确,可能是因为:
- 显示器校准问题。
- 颜色空间不一致(例如,RGB vs. CMYK)。
尝试在不同的设备上查看图表,或使用颜色管理工具进行校准。
6.3 处理大量颜色
当需要处理大量颜色时,可以使用循环或列表推导式:
import matplotlib.pyplot as plt
import numpy as np

# 生成20个随机的十六进制颜色
colors = ['#' + ''.join([np.random.choice('0123456789ABCDEF') for j in range(6)]) for i in range(20)]

plt.figure(figsize=(12, 8))
for i, color in enumerate(colors):
    plt.plot([0, 1], [i, i], color=color, linewidth=10)

plt.title('Multiple Random Hex Colors')
plt.xlabel('X-axis')
plt.ylabel('Color Index')
plt.text(0.5, 10, 'how2matplotlib.com', ha='center', va='center')
plt.show()
这个例子展示了如何生成和使用多个随机的十六进制颜色。
7. 高级应用
7.1 创建自定义调色板
你可以创建自己的调色板,并在整个项目中使用:
import matplotlib.pyplot as plt
import numpy as np

# 自定义调色板
custom_palette = {
    'primary': '#3498db',
    'secondary': '#e74c3c',
    'accent': '#2ecc71',
    'neutral': '#95a5a6'
}

x = np.linspace(0, 10, 100)
y1 = np.sin(x)
y2 = np.cos(x)

plt.figure(figsize=(10, 6))
plt.plot(x, y1, color=custom_palette['primary'], label='Sin')
plt.plot(x, y2, color=custom_palette['secondary'], label='Cos')
plt.fill_between(x, y1, y2, color=custom_palette['accent'], alpha=0.3)
plt.title('Custom Color Palette', color=custom_palette['neutral'])
plt.xlabel('X-axis')
plt.ylabel('Y-axis')
plt.legend()
plt.text(5, 0, 'how2matplotlib.com', ha='center', va='center', color=custom_palette['neutral'])
plt.show()
Output:
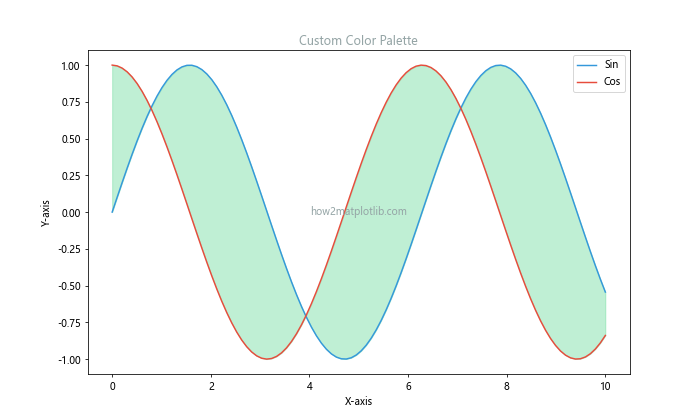
这个例子展示了如何创建和使用自定义调色板。
7.2 动态生成颜色
对于需要动态生成大量颜色的情况,可以使用算法来生成:
import matplotlib.pyplot as plt
import numpy as np

def generate_colors(n):
    phi = (1 + np.sqrt(5)) / 2  # 黄金比例
    return ['#{:06x}'.format(int(i * phi * 16777215) % 16777215) for i in range(n)]

data = np.random.rand(10, 5)
colors = generate_colors(10)

plt.figure(figsize=(12, 8))
for i in range(10):
    plt.plot(range(5), data[i], color=colors[i], linewidth=2, label=f'Line {i+1}')

plt.title('Dynamically Generated Colors')
plt.xlabel('X-axis')
plt.ylabel('Y-axis')
plt.legend(bbox_to_anchor=(1.05, 1), loc='upper left')
plt.text(2, 0.5, 'how2matplotlib.com', ha='center', va='center')
plt.tight_layout()
plt.show()
Output:
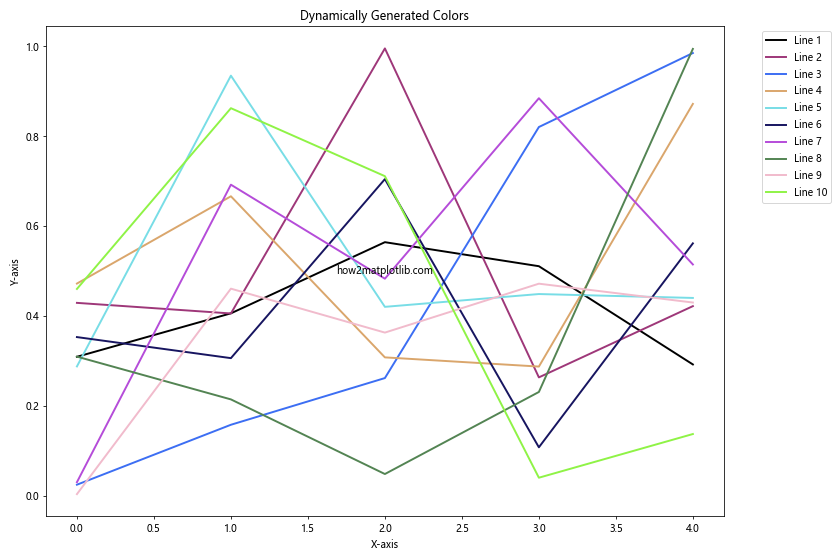
这个例子使用黄金比例来生成一系列分布良好的颜色。### 7.3 颜色插值
在某些情况下,你可能需要在两个十六进制颜色之间进行插值。这在创建渐变效果或颜色映射时特别有用:
import matplotlib.pyplot as plt
import numpy as np

def hex_to_rgb(hex_color):
    return tuple(int(hex_color[i:i+2], 16) for i in (1, 3, 5))

def rgb_to_hex(rgb):
    return '#{:02x}{:02x}{:02x}'.format(*rgb)

def interpolate_color(color1, color2, factor):
    rgb1 = hex_to_rgb(color1)
    rgb2 = hex_to_rgb(color2)
    return tuple(int(rgb1[i] + factor * (rgb2[i] - rgb1[i])) for i in range(3))

start_color = '#FF0000'  # Red
end_color = '#0000FF'    # Blue

plt.figure(figsize=(10, 2))
for i in range(100):
    factor = i / 99
    color = rgb_to_hex(interpolate_color(start_color, end_color, factor))
    plt.axvline(i, color=color, linewidth=4)

plt.title('Color Interpolation')
plt.axis('off')
plt.text(50, 0.5, 'how2matplotlib.com', ha='center', va='center')
plt.show()
Output:

这个例子展示了如何在红色和蓝色之间创建平滑的颜色过渡。
8. 颜色理论与应用
了解一些基本的颜色理论可以帮助你更好地使用十六进制颜色:
8.1 互补色
互补色是色轮上相对的两种颜色。它们可以创造强烈的对比效果:
import matplotlib.pyplot as plt
import numpy as np

def complementary_color(hex_color):
    rgb = hex_to_rgb(hex_color)
    comp_rgb = tuple(255 - c for c in rgb)
    return rgb_to_hex(comp_rgb)

base_color = '#3498db'
comp_color = complementary_color(base_color)

x = np.linspace(0, 10, 100)
y1 = np.sin(x)
y2 = np.cos(x)

plt.figure(figsize=(10, 6))
plt.plot(x, y1, color=base_color, label='Base Color')
plt.plot(x, y2, color=comp_color, label='Complementary Color')
plt.title('Complementary Colors')
plt.xlabel('X-axis')
plt.ylabel('Y-axis')
plt.legend()
plt.text(5, 0, 'how2matplotlib.com', ha='center', va='center')
plt.show()
这个例子展示了如何使用一种颜色及其互补色。
8.2 类似色
类似色是色轮上相邻的颜色。它们可以创造和谐的视觉效果:
import matplotlib.pyplot as plt
import colorsys

def analogous_colors(hex_color, n=3):
    rgb = hex_to_rgb(hex_color)
    hsv = colorsys.rgb_to_hsv(*[x/255.0 for x in rgb])
    colors = [hsv]
    for i in range(1, n):
        new_hsv = ((hsv[0] + 0.05*i) % 1.0, hsv[1], hsv[2])
        colors.append(new_hsv)
    return [rgb_to_hex([int(x*255) for x in colorsys.hsv_to_rgb(*c)]) for c in colors]

base_color = '#3498db'
analog_colors = analogous_colors(base_color, 5)

plt.figure(figsize=(10, 6))
for i, color in enumerate(analog_colors):
    plt.bar(i, 1, color=color, width=0.8)

plt.title('Analogous Colors')
plt.xlabel('Color Index')
plt.ylabel('Value')
plt.text(2, 0.5, 'how2matplotlib.com', ha='center', va='center')
plt.show()
这个例子展示了如何生成和使用类似色。
9. 颜色可访问性
在使用颜色时,考虑可访问性是非常重要的。这包括为色盲用户选择合适的颜色,以及确保足够的对比度。
9.1 色盲友好的颜色选择
import matplotlib.pyplot as plt
import numpy as np

# 色盲友好的颜色方案
cb_friendly_colors = [
    '#1f77b4',  # 蓝色
    '#ff7f0e',  # 橙色
    '#2ca02c',  # 绿色
    '#d62728',  # 红色
    '#9467bd',  # 紫色
    '#8c564b',  # 棕色
    '#e377c2',  # 粉色
    '#7f7f7f',  # 灰色
    '#bcbd22',  # 黄绿色
    '#17becf'   # 青色
]

data = np.random.rand(10, 5)

plt.figure(figsize=(12, 8))
for i in range(10):
    plt.plot(range(5), data[i], color=cb_friendly_colors[i], linewidth=2, label=f'Line {i+1}')

plt.title('Color-Blind Friendly Plot')
plt.xlabel('X-axis')
plt.ylabel('Y-axis')
plt.legend(bbox_to_anchor=(1.05, 1), loc='upper left')
plt.text(2, 0.5, 'how2matplotlib.com', ha='center', va='center')
plt.tight_layout()
plt.show()
Output:
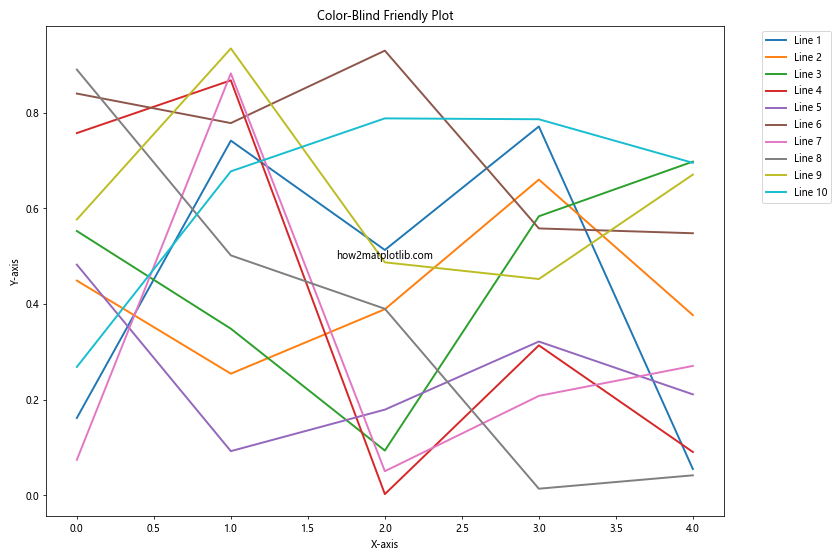
这个例子使用了一组色盲友好的颜色,适合各种类型的色盲观众。
9.2 检查颜色对比度
确保文本和背景之间有足够的对比度是很重要的。你可以使用在线工具来检查对比度,或者在Matplotlib中模拟:
import matplotlib.pyplot as plt
import numpy as np

def contrast_ratio(color1, color2):
    # 简化的对比度计算
    lum1 = sum([int(color1[i:i+2], 16) for i in (1, 3, 5)]) / 765
    lum2 = sum([int(color2[i:i+2], 16) for i in (1, 3, 5)]) / 765
    return max(lum1, lum2) / min(lum1, lum2)

background_color = '#FFFFFF'
text_colors = ['#000000', '#777777', '#AAAAAA', '#DDDDDD']

plt.figure(figsize=(12, 4))
for i, color in enumerate(text_colors):
    ratio = contrast_ratio(background_color, color)
    plt.text(0.25 + i*0.25, 0.5, f'Sample Text\nContrast: {ratio:.2f}',
             color=color, fontsize=12, ha='center', va='center')

plt.title('Text Contrast Examples')
plt.xlim(0, 1)
plt.ylim(0, 1)
plt.axis('off')
plt.text(0.5, 0.1, 'how2matplotlib.com', ha='center', va='center', color='#000000')
plt.show()
这个例子展示了不同文本颜色与白色背景的对比度。
10. 高级颜色操作
10.1 颜色混合
有时你可能需要混合两种或多种颜色:
import matplotlib.pyplot as plt
import numpy as np

def mix_colors(*hex_colors):
    rgb_colors = [hex_to_rgb(color) for color in hex_colors]
    mixed = tuple(int(sum(color[i] for color in rgb_colors) / len(rgb_colors)) for i in range(3))
    return rgb_to_hex(mixed)

colors = ['#FF0000', '#00FF00', '#0000FF']
mixed_color = mix_colors(*colors)

plt.figure(figsize=(10, 4))
for i, color in enumerate(colors + [mixed_color]):
    plt.bar(i, 1, color=color, width=0.8)

plt.title('Color Mixing')
plt.xlabel('Colors')
plt.xticks(range(4), ['Red', 'Green', 'Blue', 'Mixed'])
plt.text(1.5, 0.5, 'how2matplotlib.com', ha='center', va='center')
plt.show()
这个例子展示了如何混合多种颜色。
10.2 颜色亮度调整
调整颜色的亮度可以创造出不同的效果:
import matplotlib.pyplot as plt
import colorsys

def adjust_brightness(hex_color, factor):
    rgb = hex_to_rgb(hex_color)
    hsv = colorsys.rgb_to_hsv(*[x/255.0 for x in rgb])
    new_hsv = (hsv[0], hsv[1], max(0, min(1, hsv[2] * factor)))
    new_rgb = [int(x*255) for x in colorsys.hsv_to_rgb(*new_hsv)]
    return rgb_to_hex(new_rgb)

base_color = '#3498db'
brightness_factors = [0.5, 0.75, 1, 1.25, 1.5]

plt.figure(figsize=(12, 4))
for i, factor in enumerate(brightness_factors):
    color = adjust_brightness(base_color, factor)
    plt.bar(i, 1, color=color, width=0.8)

plt.title('Brightness Adjustment')
plt.xlabel('Brightness Factor')
plt.xticks(range(5), brightness_factors)
plt.text(2, 0.5, 'how2matplotlib.com', ha='center', va='center')
plt.show()
这个例子展示了如何调整颜色的亮度。
11. 实际应用案例
11.1 创建主题化图表
使用一致的颜色主题可以使你的图表更加专业和统一:
import matplotlib.pyplot as plt
import numpy as np

# 定义主题颜色
theme_colors = {
    'primary': '#3498db',
    'secondary': '#e74c3c',
    'accent': '#2ecc71',
    'background': '#ecf0f1',
    'text': '#2c3e50'
}

x = np.linspace(0, 10, 100)
y1 = np.sin(x)
y2 = np.cos(x)

plt.figure(figsize=(12, 8), facecolor=theme_colors['background'])
plt.plot(x, y1, color=theme_colors['primary'], linewidth=2, label='Sin')
plt.plot(x, y2, color=theme_colors['secondary'], linewidth=2, label='Cos')
plt.fill_between(x, y1, y2, color=theme_colors['accent'], alpha=0.3)

plt.title('Themed Chart Example', color=theme_colors['text'], fontsize=16)
plt.xlabel('X-axis', color=theme_colors['text'])
plt.ylabel('Y-axis', color=theme_colors['text'])
plt.tick_params(colors=theme_colors['text'])
plt.legend()

plt.text(5, 0, 'how2matplotlib.com', ha='center', va='center', color=theme_colors['text'])
plt.grid(color=theme_colors['text'], alpha=0.1)
plt.show()
Output:
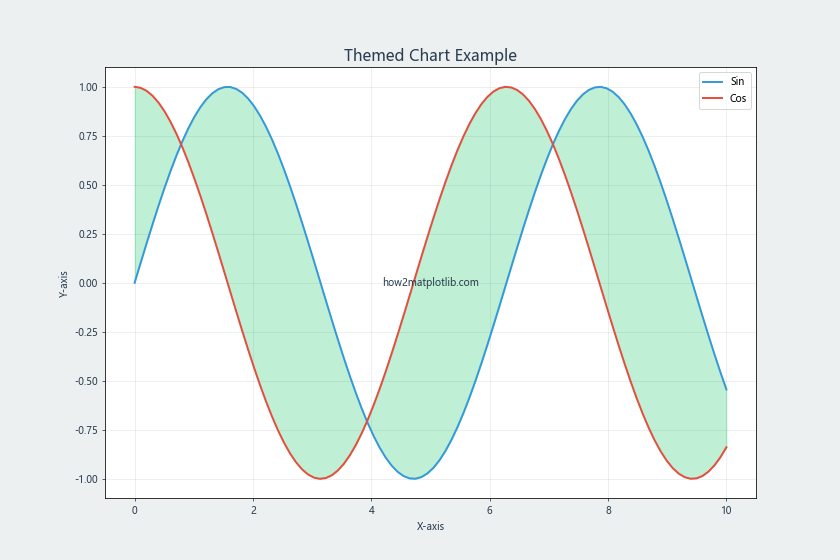
这个例子展示了如何使用一组主题颜色来创建视觉上协调的图表。
11.2 数据可视化中的颜色映射
在数据可视化中,颜色映射是一个强大的工具,可以帮助传达数据的额外维度:
import matplotlib.pyplot as plt
import numpy as np

def custom_cmap(hex_colors):
    return mcolors.LinearSegmentedColormap.from_list("custom", hex_colors, N=256)

data = np.random.rand(10, 10)
hex_colors = ['#FFA07A', '#98FB98', '#87CEFA']  # 浅珊瑚色到浅绿色到浅蓝色

plt.figure(figsize=(10, 8))
plt.imshow(data, cmap=custom_cmap(hex_colors))
plt.colorbar(label='Value')
plt.title('Custom Color Map in Data Visualization')
plt.text(5, 11, 'how2matplotlib.com', ha='center', va='center')
plt.show()
这个例子展示了如何创建和使用自定义颜色映射来可视化数据。
12. 总结与最佳实践
在Matplotlib中使用十六进制颜色可以大大提升你的数据可视化效果。以下是一些最佳实践:
- 保持一致性:在整个项目中使用一致的颜色方案。
- 考虑可访问性:选择对色盲用户友好的颜色,并确保足够的对比度。
- 了解色彩理论:利用互补色、类似色等概念来创造和谐的视觉效果。
- 使用在线工具:利用颜色选择器和调色板生成器来帮助选择颜色。
- 测试不同设备:在不同的显示器和打印设备上测试你的图表,确保颜色显示正确。
- 适度使用:不要使用过多颜色,这可能会分散注意力。
- 文档化:记录你使用的颜色代码,以便将来参考和保持一致性。
通过掌握这些技巧和最佳实践,你将能够创建更加专业、吸引人和有效的数据可视化。记住,颜色不仅仅是装饰,它是传达信息的重要工具。合理使用十六进制颜色可以帮助你更好地讲述数据背后的故事,使你的图表更具说服力和影响力。
最后,不断实践和实验是提高数据可视化技能的关键。尝试不同的颜色组合,观察它们如何影响图表的整体效果,并根据反馈不断调整和改进。随着经验的积累,你将能够更直观地选择合适的颜色方案,创造出既美观又有效的数据可视化作品。
13. 进阶技巧与挑战
13.1 创建动态颜色变化
在某些情况下,你可能希望颜色随数据动态变化。以下是一个示例,展示如何根据数据值动态改变颜色:
import matplotlib.pyplot as plt
import numpy as np

def value_to_color(value, min_val, max_val):
    # 将值映射到0-1范围
    normalized = (value - min_val) / (max_val - min_val)
    # 从蓝色到红色的渐变
    return plt.cm.coolwarm(normalized)

x = np.linspace(0, 10, 100)
y = np.sin(x) * np.exp(-x/10)

plt.figure(figsize=(12, 6))
for i in range(len(x)-1):
    plt.plot(x[i:i+2], y[i:i+2], color=value_to_color(y[i], y.min(), y.max()), linewidth=2)

plt.title('Dynamic Color Change Based on Y-value')
plt.xlabel('X-axis')
plt.ylabel('Y-axis')
plt.colorbar(plt.cm.ScalarMappable(cmap='coolwarm'), label='Y-value')
plt.text(5, 0, 'how2matplotlib.com', ha='center', va='center')
plt.show()
这个例子展示了如何根据y值动态改变线条的颜色。
13.2 创建自定义颜色循环
当你需要为多个数据系列指定颜色时,创建自定义颜色循环可能会很有用:
import matplotlib.pyplot as plt
import numpy as np
import itertools

custom_colors = ['#1f77b4', '#ff7f0e', '#2ca02c', '#d62728', '#9467bd']
color_cycle = itertools.cycle(custom_colors)

plt.figure(figsize=(12, 6))

for i in range(5):
    x = np.linspace(0, 10, 100)
    y = np.sin(x + i*np.pi/5)
    plt.plot(x, y, color=next(color_cycle), label=f'Series {i+1}')

plt.title('Custom Color Cycle')
plt.xlabel('X-axis')
plt.ylabel('Y-axis')
plt.legend()
plt.text(5, 0, 'how2matplotlib.com', ha='center', va='center')
plt.show()
Output:
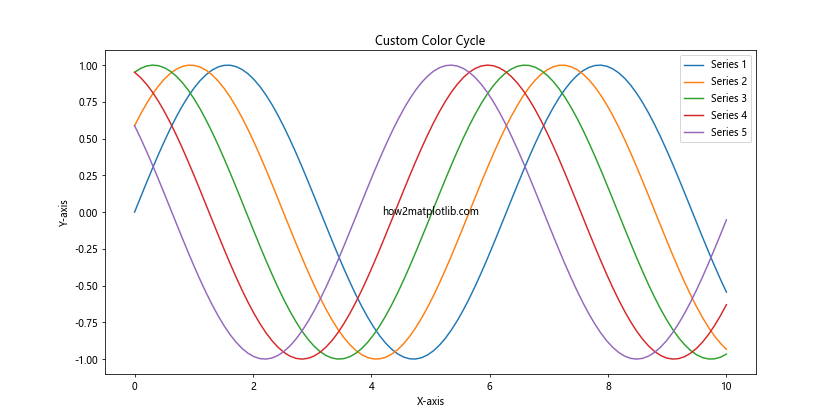
这个例子展示了如何创建和使用自定义颜色循环。
14. 颜色与数据类型的关系
不同类型的数据可能需要不同的颜色策略。以下是一些常见数据类型及其颜色使用建议:
14.1 分类数据
对于分类数据,使用明显不同的颜色是一个好主意:
import matplotlib.pyplot as plt

categories = ['A', 'B', 'C', 'D', 'E']
values = [23, 45, 56, 78, 32]
colors = ['#e74c3c', '#3498db', '#2ecc71', '#f39c12', '#9b59b6']

plt.figure(figsize=(10, 6))
plt.bar(categories, values, color=colors)
plt.title('Sales by Category')
plt.xlabel('Category')
plt.ylabel('Sales')
plt.text(2, 40, 'how2matplotlib.com', ha='center', va='center')
plt.show()
Output:
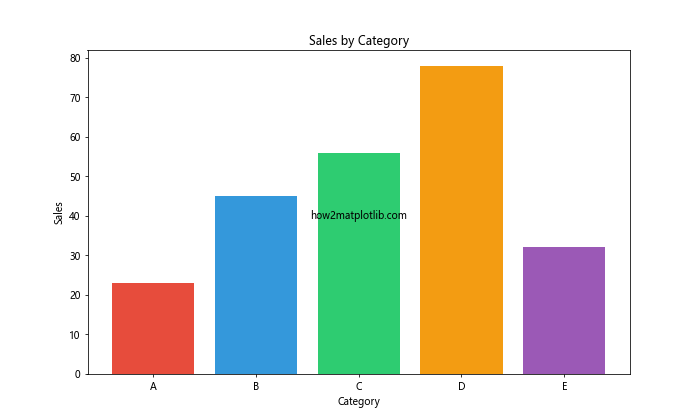
这个例子为每个类别使用了不同的颜色,使它们易于区分。
14.2 连续数据
对于连续数据,使用颜色渐变通常更合适:
import matplotlib.pyplot as plt
import numpy as np

x = np.linspace(0, 10, 100)
y = np.sin(x)

plt.figure(figsize=(12, 6))
plt.scatter(x, y, c=y, cmap='viridis')
plt.colorbar(label='Y-value')
plt.title('Continuous Data Visualization')
plt.xlabel('X-axis')
plt.ylabel('Y-axis')
plt.text(5, 0, 'how2matplotlib.com', ha='center', va='center')
plt.show()
Output:
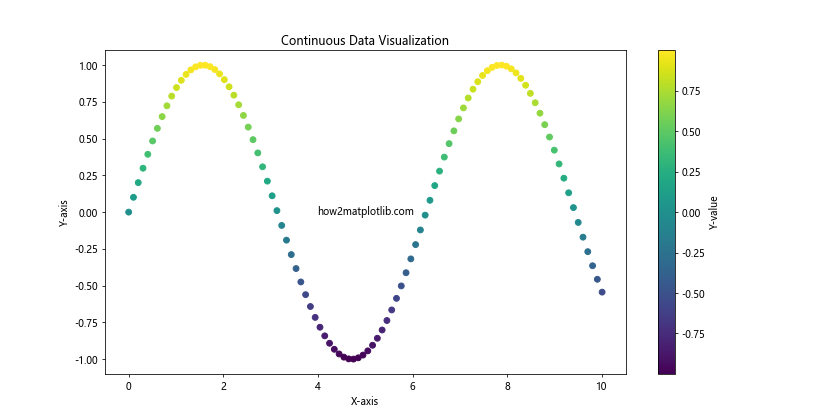
这个例子使用颜色渐变来表示y值的变化。
15. 颜色与心理学
颜色不仅仅是视觉元素,它们还能影响人们的情绪和认知。在数据可视化中,了解颜色心理学可以帮助你更有效地传达信息:
- 红色:通常与警告、危险或重要性相关联。
- 蓝色:给人冷静、专业和信任的感觉。
- 绿色:常与成长、正面变化或环境相关。
- 黄色:可以表示警告,但也可以传达乐观和活力。
- 紫色:通常与奢华或创造力相关。
以下是一个利用颜色心理学的例子:
import matplotlib.pyplot as plt
import numpy as np

categories = ['Safety', 'Warning', 'Danger']
values = [85, 60, 25]
colors = ['#2ecc71', '#f39c12', '#e74c3c']

plt.figure(figsize=(10, 6))
plt.bar(categories, values, color=colors)
plt.title('Safety Levels')
plt.xlabel('Category')
plt.ylabel('Safety Score')
plt.ylim(0, 100)
plt.text(1, 50, 'how2matplotlib.com', ha='center', va='center')
plt.show()
Output:
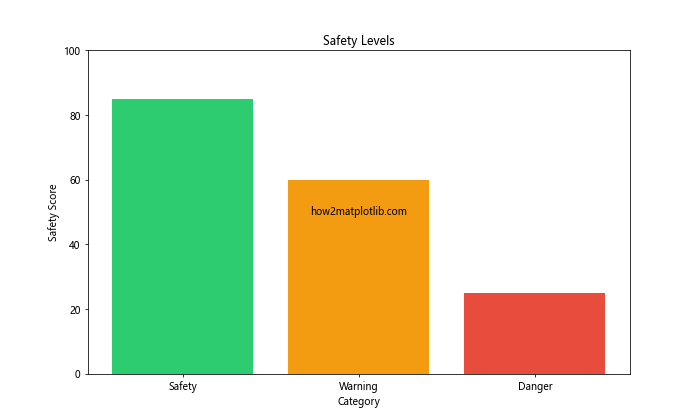
这个例子使用绿色、黄色和红色来直观地表示安全、警告和危险级别。
16. 结论
在Matplotlib中使用十六进制颜色是一个强大的工具,可以大大提升你的数据可视化效果。通过本文,我们探讨了从基础概念到高级技巧的多个方面,包括:
- 十六进制颜色的基本概念和语法
- 在Matplotlib中应用十六进制颜色的各种方法
- 颜色理论和心理学在数据可视化中的应用
- 创建自定义颜色方案和颜色映射
- 考虑可访问性和色盲友好的设计
- 动态颜色变化和高级颜色操作技巧
记住,颜色的选择应该始终服务于你的数据和故事。过度使用颜色可能会分散注意力,而恰当的颜色使用则可以增强你的信息传达效果。
通过不断实践和实验,你将能够更好地掌握颜色在数据可视化中的应用,创造出既美观又有效的图表。无论是进行科学研究、商业分析还是日常报告,熟练运用十六进制颜色都将使你的数据可视化技能更上一层楼。
最后,永远记住可访问性的重要性。创造出既美观又易于所有人理解的可视化作品,这才是真正的数据可视化艺术。
 极客笔记
极客笔记