Matplotlib图例颜色设置:全面掌握图例美化技巧
Matplotlib是Python中最流行的数据可视化库之一,它提供了强大的绘图功能,其中图例(legend)是数据可视化中不可或缺的组成部分。合理设置图例的颜色不仅可以增强图表的美观度,还能提高数据的可读性和解释性。本文将深入探讨Matplotlib中图例颜色的设置方法,涵盖从基础到高级的各种技巧,帮助您全面掌握图例美化的艺术。
1. 图例颜色基础
在Matplotlib中,图例的颜色通常与对应的数据线或标记的颜色保持一致。这是默认行为,无需额外设置。但有时我们可能需要自定义图例的颜色,以达到特定的视觉效果或满足特殊需求。
让我们从一个简单的例子开始:
import matplotlib.pyplot as plt

plt.figure(figsize=(8, 6))
plt.plot([1, 2, 3, 4], [1, 4, 2, 3], label='Line 1')
plt.plot([1, 2, 3, 4], [2, 3, 4, 1], label='Line 2')
plt.title('Basic Legend Example - how2matplotlib.com')
plt.legend()
plt.show()
Output:

在这个例子中,我们绘制了两条线,并为每条线添加了标签。调用plt.legend()会自动创建一个图例,其中的颜色与对应的线条颜色相匹配。
2. 自定义图例颜色
有时,我们可能希望图例的颜色与实际绘制的线条或标记不同。这可以通过设置legend函数的color参数来实现。
import matplotlib.pyplot as plt

plt.figure(figsize=(8, 6))
plt.plot([1, 2, 3, 4], [1, 4, 2, 3], 'b-', label='Blue Line')
plt.plot([1, 2, 3, 4], [2, 3, 4, 1], 'r-', label='Red Line')
plt.title('Custom Legend Colors - how2matplotlib.com')
plt.legend(labelcolor=['green', 'orange'])
plt.show()
Output:
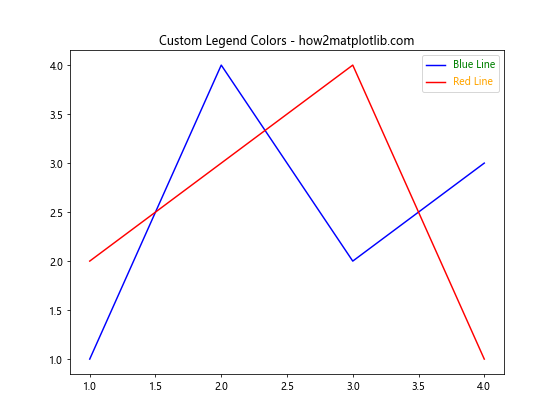
在这个例子中,我们使用labelcolor参数为图例中的标签设置了自定义颜色。尽管实际的线条是蓝色和红色,但图例中的文本颜色被设置为绿色和橙色。
3. 图例框和背景颜色
除了图例文本的颜色,我们还可以自定义图例框和背景的颜色。这可以通过设置legend函数的facecolor和edgecolor参数来实现。
import matplotlib.pyplot as plt

plt.figure(figsize=(8, 6))
plt.plot([1, 2, 3, 4], [1, 4, 2, 3], label='Data 1')
plt.plot([1, 2, 3, 4], [2, 3, 4, 1], label='Data 2')
plt.title('Legend with Custom Background - how2matplotlib.com')
plt.legend(facecolor='lightgray', edgecolor='blue')
plt.show()
Output:
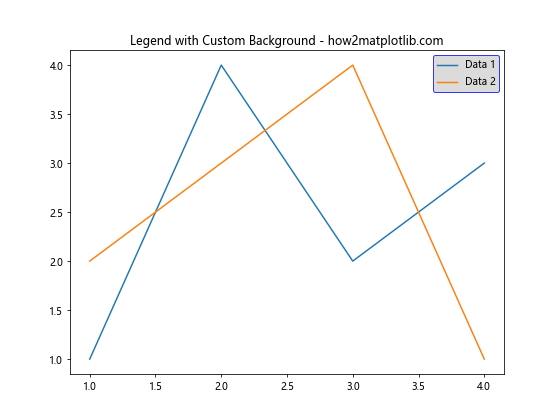
在这个例子中,我们将图例的背景色设置为浅灰色,边框颜色设置为蓝色。这种设置可以使图例在视觉上更加突出。
4. 透明度设置
有时,我们可能希望图例的背景略微透明,以便不完全遮挡底层的图表内容。这可以通过设置alpha参数来实现。
import matplotlib.pyplot as plt
import numpy as np

x = np.linspace(0, 10, 100)
plt.figure(figsize=(8, 6))
plt.plot(x, np.sin(x), label='Sine')
plt.plot(x, np.cos(x), label='Cosine')
plt.title('Legend with Transparency - how2matplotlib.com')
plt.legend(facecolor='white', edgecolor='black', alpha=0.7)
plt.show()
在这个例子中,我们设置了图例背景的透明度为0.7,这样可以部分看到图例下方的图表内容。
5. 多列图例
当图例项目较多时,可能需要将图例排列成多列。我们可以使用ncol参数来指定列数,并同时自定义颜色。
import matplotlib.pyplot as plt
import numpy as np

x = np.linspace(0, 10, 100)
plt.figure(figsize=(10, 6))
for i in range(5):
    plt.plot(x, np.sin(x + i), label=f'Sine {i+1}')
plt.title('Multi-column Legend - how2matplotlib.com')
plt.legend(ncol=3, facecolor='lightyellow', edgecolor='green')
plt.show()
Output:
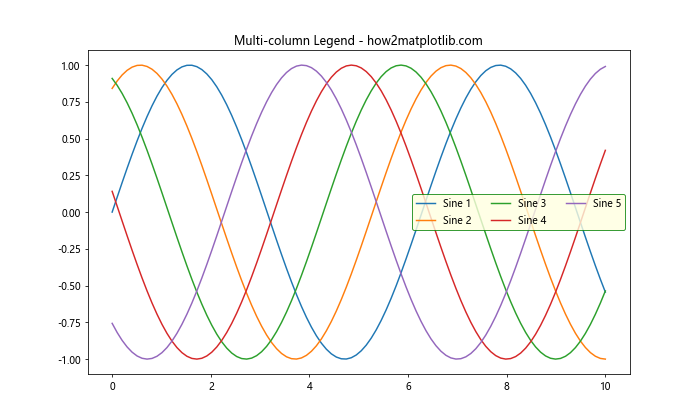
这个例子展示了如何创建一个3列的图例,同时设置了背景色和边框颜色。
6. 图例位置和颜色
图例的位置也可能影响我们对颜色的选择。Matplotlib提供了多个预定义的位置,我们可以根据需要选择最合适的位置,并相应地调整颜色。
import matplotlib.pyplot as plt
import numpy as np

x = np.linspace(0, 10, 100)
plt.figure(figsize=(8, 6))
plt.plot(x, np.sin(x), label='Sine')
plt.plot(x, np.cos(x), label='Cosine')
plt.title('Legend Position and Color - how2matplotlib.com')
plt.legend(loc='upper left', facecolor='lightblue', edgecolor='navy')
plt.show()
Output:

在这个例子中,我们将图例放置在左上角,并设置了浅蓝色背景和深蓝色边框。
7. 自定义图例标记颜色
有时,我们可能希望单独设置图例中标记的颜色,而不影响文本颜色。这可以通过创建自定义的Line2D对象来实现。
import matplotlib.pyplot as plt
from matplotlib.lines import Line2D

plt.figure(figsize=(8, 6))
plt.plot([1, 2, 3, 4], [1, 4, 2, 3], 'b-')
plt.plot([1, 2, 3, 4], [2, 3, 4, 1], 'r-')
plt.title('Custom Legend Marker Colors - how2matplotlib.com')

custom_lines = [Line2D([0], [0], color='purple', lw=2),
                Line2D([0], [0], color='green', lw=2)]
plt.legend(custom_lines, ['Line 1', 'Line 2'])
plt.show()
Output:
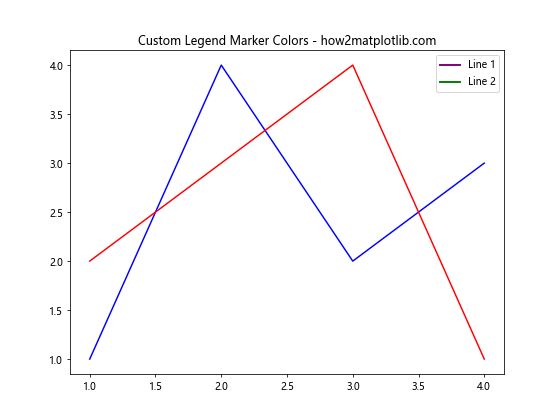
在这个例子中,我们创建了两个自定义的Line2D对象,分别设置为紫色和绿色,然后将它们用作图例的标记。
8. 图例中的渐变色
对于更高级的应用,我们可能希望在图例中使用渐变色。这可以通过创建自定义的颜色映射来实现。
import matplotlib.pyplot as plt
import numpy as np
from matplotlib.colors import LinearSegmentedColormap

# 创建自定义颜色映射
colors = ['red', 'yellow', 'green']
n_bins = 100
cmap = LinearSegmentedColormap.from_list('custom_cmap', colors, N=n_bins)

plt.figure(figsize=(8, 6))
for i in range(5):
    plt.plot(np.random.rand(10), color=cmap(i/4))

plt.title('Gradient Colors in Legend - how2matplotlib.com')
plt.legend(['Data ' + str(i+1) for i in range(5)],
           loc='upper left',
           facecolor='lightgray',
           edgecolor='black')
plt.show()
Output:
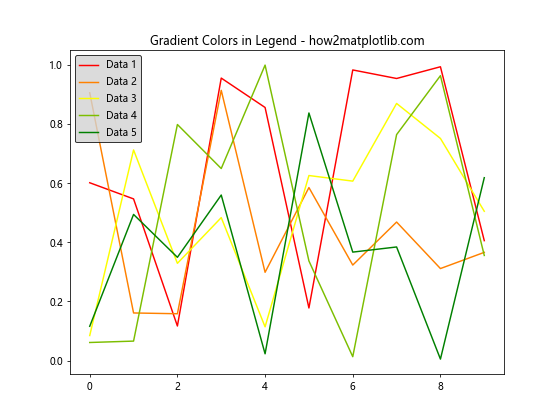
这个例子展示了如何创建一个自定义的颜色映射,并将其应用到图例中。每条线的颜色都是从这个渐变色映射中选取的。
9. 图例中的离散颜色
对于分类数据,我们可能需要在图例中使用离散的颜色。这可以通过使用颜色循环来实现。
import matplotlib.pyplot as plt
import numpy as np

categories = ['A', 'B', 'C', 'D', 'E']
values = np.random.rand(5, 10)
colors = plt.cm.Set3(np.linspace(0, 1, len(categories)))

plt.figure(figsize=(10, 6))
for i, category in enumerate(categories):
    plt.plot(values[i], label=category, color=colors[i])

plt.title('Discrete Colors in Legend - how2matplotlib.com')
plt.legend(loc='upper right', facecolor='white', edgecolor='black')
plt.show()
Output:

在这个例子中,我们使用Set3颜色映射创建了一组离散的颜色,并将它们应用到不同的数据类别中。
10. 图例颜色与数据关联
有时,我们可能希望图例的颜色能够反映数据的某些特征。例如,我们可以根据数据的大小来设置颜色。
import matplotlib.pyplot as plt
import numpy as np

data = np.random.rand(5, 10)
plt.figure(figsize=(10, 6))

cmap = plt.cm.viridis
for i in range(5):
    color = cmap(np.mean(data[i]))
    plt.plot(data[i], label=f'Data {i+1}', color=color)

plt.title('Legend Colors Reflecting Data - how2matplotlib.com')
plt.legend(loc='upper left', facecolor='lightgray', edgecolor='black')
plt.show()
Output:
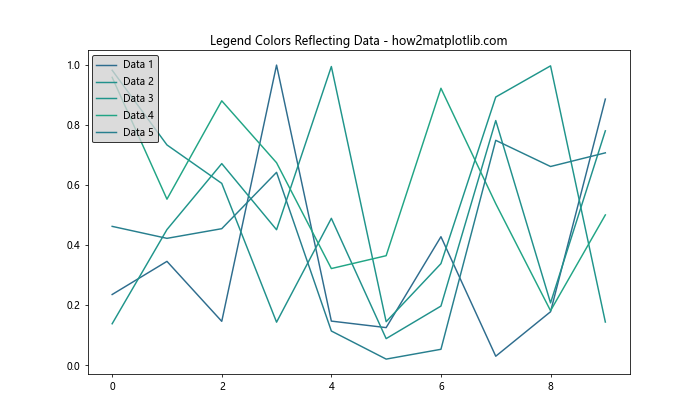
在这个例子中,每条线的颜色都是根据其数据的平均值来确定的。这种方法可以在图例中直观地反映数据的特征。
11. 自定义图例标记和颜色
有时,我们可能需要为图例创建完全自定义的标记和颜色组合。这可以通过创建自定义的Patch对象来实现。
import matplotlib.pyplot as plt
from matplotlib.patches import Rectangle

plt.figure(figsize=(8, 6))
plt.plot([1, 2, 3, 4], [1, 4, 2, 3])
plt.title('Custom Legend Markers and Colors - how2matplotlib.com')

legend_elements = [Rectangle((0, 0), 1, 1, facecolor='r', edgecolor='none', label='Red'),
                   Rectangle((0, 0), 1, 1, facecolor='g', edgecolor='none', label='Green'),
                   Rectangle((0, 0), 1, 1, facecolor='b', edgecolor='none', label='Blue')]

plt.legend(handles=legend_elements, loc='upper right')
plt.show()
Output:
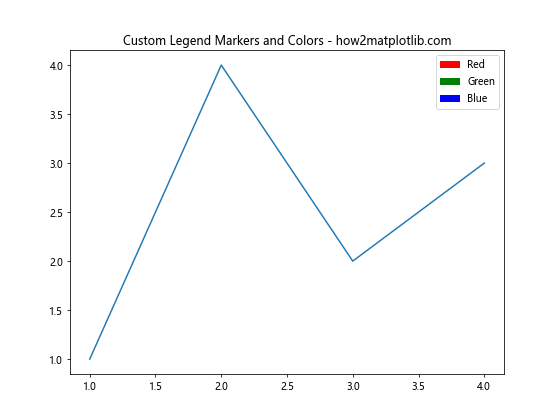
在这个例子中,我们创建了三个矩形Patch对象,每个都有不同的颜色和标签。这些自定义的图例元素可以用来表示任何我们想要的内容。
12. 图例中的颜色条
对于连续的数据范围,我们可能希望在图例中显示一个颜色条。这可以通过创建一个颜色映射的颜色条来实现。
import matplotlib.pyplot as plt
import numpy as np
from matplotlib.cm import ScalarMappable
from matplotlib.colors import Normalize

plt.figure(figsize=(10, 6))

# 创建一些随机数据
x = np.linspace(0, 10, 100)
y = np.sin(x) + np.random.normal(0, 0.1, 100)

# 使用颜色映射绘制散点图
scatter = plt.scatter(x, y, c=y, cmap='viridis')

plt.title('Legend with Colorbar - how2matplotlib.com')

# 添加颜色条作为图例
cbar = plt.colorbar(scatter)
cbar.set_label('Value')

plt.show()
Output:

这个例子展示了如何在图例中添加一个颜色条,用于表示连续的数据范围。颜色条可以帮助读者理解数据点的颜色与其值之间的关系。
13. 图例中的渐变文本颜色
为了创造更引人注目的视觉效果,我们可以尝试在图例中使用渐变的文本颜色。这需要一些额外的技巧,但效果可能会非常吸引人。
import matplotlib.pyplot as plt
import numpy as np
from matplotlib.colors import LinearSegmentedColormap

plt.figure(figsize=(10, 6))

# 创建一些数据
x = np.linspace(0, 10, 100)
for i in range(5):
    plt.plot(x, np.sin(x + i*0.5))

# 创建一个自定义的颜色映射
colors = ['red', 'orange', 'yellow', 'green', 'blue']
cmap = LinearSegmentedColormap.from_list('custom', colors, N=5)

# 创建图例,并设置渐变文本颜色
legend = plt.legend(['Line '+str(i+1) for i in range(5)], loc='upper right')
for i, text in enumerate(legend.get_texts()):
    text.set_color(cmap(i/4))

plt.title('Gradient Text Colors in Legend - how2matplotlib.com')
plt.show()
Output:
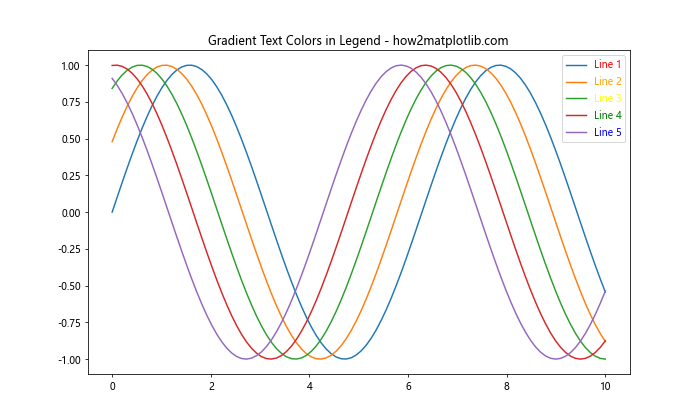
在这个例子中,我们为图例中的每个文本项设置了不同的颜色,这些颜色来自于一个自定义的渐变色映射。这种技术可以用来强调某些图例项,或者simply创造一个更有趣的视觉效果。
14. 图例中的图标和颜色
有时,我们可能想在图例中使用自定义的图标或符号,同时保持对颜色的控制。这可以通过使用FontAwesome或其他图标字体来实现。
import matplotlib.pyplot as plt
from matplotlib.font_manager import FontProperties
import numpy as np

# 确保你已经安装了FontAwesome字体
font = FontProperties(fname='/path/to/fontawesome-webfont.ttf')

plt.figure(figsize=(10, 6))

x = np.linspace(0, 10, 100)
plt.plot(x, np.sin(x), label='Sine')
plt.plot(x, np.cos(x), label='Cosine')

# 使用FontAwesome图标作为图例标记
legend = plt.legend(['\uf0e7', '\uf0c2'], ['Lightning', 'Cloud'],
                    handler_map={str: lambda x, y: plt.Line2D([], [], marker=x, markersize=15, linestyle='None')},
                    prop=font, labelcolor=['red', 'blue'])

plt.title('Icons in Legend - how2matplotlib.com')
plt.show()
这个例子展示了如何在图例中使用FontAwesome图标作为标记,并为每个图标设置不同的颜色。请注意,你需要确保FontAwesome字体已经安装在你的系统中,并提供正确的字体文件路径。
15. 动态更新图例颜色
在某些情况下,我们可能需要根据数据的变化动态更新图例的颜色。这在创建交互式或动画图表时特别有用。
import matplotlib.pyplot as plt
import numpy as np
from matplotlib.animation import FuncAnimation

fig, ax = plt.subplots(figsize=(8, 6))
x = np.linspace(0, 2*np.pi, 100)
line, = ax.plot(x, np.sin(x), label='Sine Wave')
legend = ax.legend(loc='upper right')

def update(frame):
    line.set_ydata(np.sin(x + frame/10))
    color = plt.cm.viridis(frame / 100)
    line.set_color(color)
    legend.get_texts()[0].set_color(color)
    return line, legend.get_texts()[0]

ani = FuncAnimation(fig, update, frames=100, blit=True)
plt.title('Dynamic Legend Color - how2matplotlib.com')
plt.show()
Output:
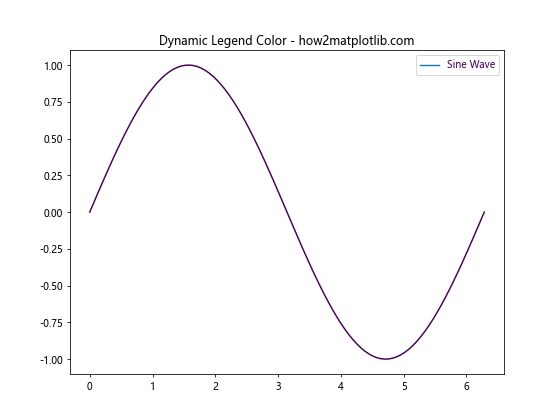
这个例子创建了一个动画,其中正弦波的颜色随时间变化,图例的颜色也相应地更新。这种技术可以用来强调数据的动态变化。
16. 分组图例和颜色
当我们有多组数据时,可能希望在图例中对它们进行分组,并为每组使用不同的颜色方案。
import matplotlib.pyplot as plt
import numpy as np

plt.figure(figsize=(12, 6))

x = np.linspace(0, 10, 100)
group1_colors = plt.cm.Blues(np.linspace(0.3, 0.8, 3))
group2_colors = plt.cm.Reds(np.linspace(0.3, 0.8, 3))

for i in range(3):
    plt.plot(x, np.sin(x + i*0.5), color=group1_colors[i], label=f'Group 1 - {i+1}')
    plt.plot(x, np.cos(x + i*0.5), color=group2_colors[i], label=f'Group 2 - {i+1}')

# 创建两个图例
legend1 = plt.legend(loc='upper left', title='Group 1')
ax = plt.gca().add_artist(legend1)
plt.legend(loc='lower left', title='Group 2')

plt.title('Grouped Legend with Colors - how2matplotlib.com')
plt.show()
Output:
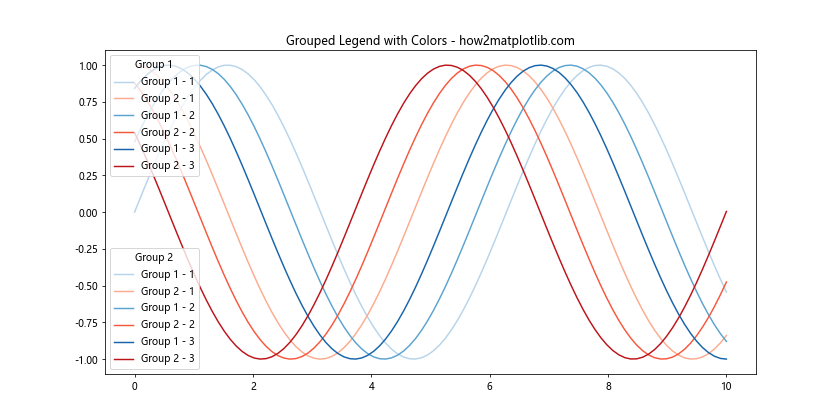
这个例子展示了如何创建两个分组的图例,每组使用不同的颜色方案。这种方法可以帮助读者更容易地区分和理解复杂的数据集。
17. 图例中的颜色渐变背景
为了创造更吸引人的视觉效果,我们可以为图例添加一个颜色渐变的背景。
import matplotlib.pyplot as plt
import numpy as np
from matplotlib.patches import Rectangle

plt.figure(figsize=(10, 6))

x = np.linspace(0, 10, 100)
plt.plot(x, np.sin(x), label='Sine')
plt.plot(x, np.cos(x), label='Cosine')

legend = plt.legend(loc='upper right')
frame = legend.get_frame()

gradient = np.linspace(0, 1, 256).reshape(1, -1)
gradient = np.vstack((gradient, gradient))

# 创建渐变色背景
colors = plt.cm.coolwarm(gradient)
frame.set_facecolor('none')
frame.set_edgecolor('none')

# 添加渐变色矩形
ax = plt.gca()
bbox = legend.get_bbox_to_anchor().transformed(ax.transAxes.inverted())
rect = Rectangle((bbox.x0, bbox.y0), bbox.width, bbox.height,
                 transform=ax.transAxes, zorder=0, facecolor=colors)
ax.add_patch(rect)

plt.title('Legend with Gradient Background - how2matplotlib.com')
plt.show()
这个例子展示了如何为图例创建一个颜色渐变的背景。这种技术可以用来突出图例,或者创造一个更有趣的视觉效果。
18. 图例中的颜色编码信息
有时,我们可能希望使用图例中的颜色来编码额外的信息,例如数据的不确定性或重要性。
import matplotlib.pyplot as plt
import numpy as np

plt.figure(figsize=(10, 6))

x = np.linspace(0, 10, 100)
y1 = np.sin(x)
y2 = np.cos(x)
y3 = np.tan(x)

uncertainty = [0.1, 0.3, 0.6]  # 假设的不确定性值

plt.plot(x, y1, label='Sine')
plt.plot(x, y2, label='Cosine')
plt.plot(x, y3, label='Tangent')

legend = plt.legend(loc='upper right')

# 根据不确定性设置图例文本颜色
for text, alpha in zip(legend.get_texts(), uncertainty):
    text.set_color(plt.cm.viridis(alpha))

plt.title('Color-coded Uncertainty in Legend - how2matplotlib.com')
plt.show()
Output:
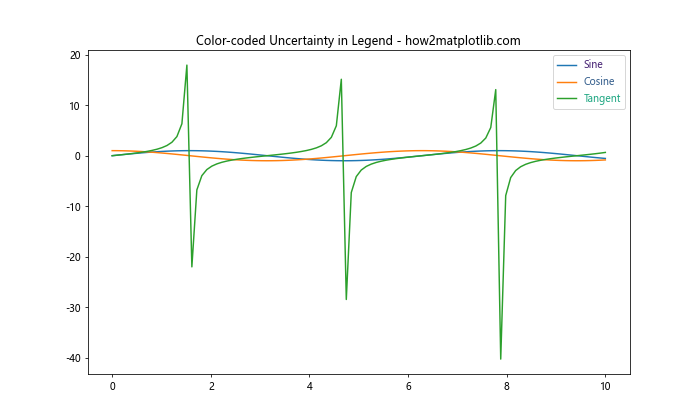
在这个例子中,我们使用图例文本的颜色来表示每个数据系列的不确定性。颜色越深表示不确定性越高。这种方法可以在图例中传达额外的信息,而不需要增加图表的复杂性。
19. 图例中的颜色分类
当处理分类数据时,我们可能希望在图例中使用不同的颜色来表示不同的类别。
import matplotlib.pyplot as plt
import numpy as np

categories = ['A', 'B', 'C', 'D', 'E']
values = np.random.rand(5, 10)

plt.figure(figsize=(12, 6))

cmap = plt.cm.get_cmap('Set1')
for i, category in enumerate(categories):
    plt.plot(values[i], color=cmap(i), label=category)

legend = plt.legend(title='Categories', loc='center left', bbox_to_anchor=(1, 0.5))
plt.title('Categorical Colors in Legend - how2matplotlib.com')
plt.tight_layout()
plt.show()
Output:
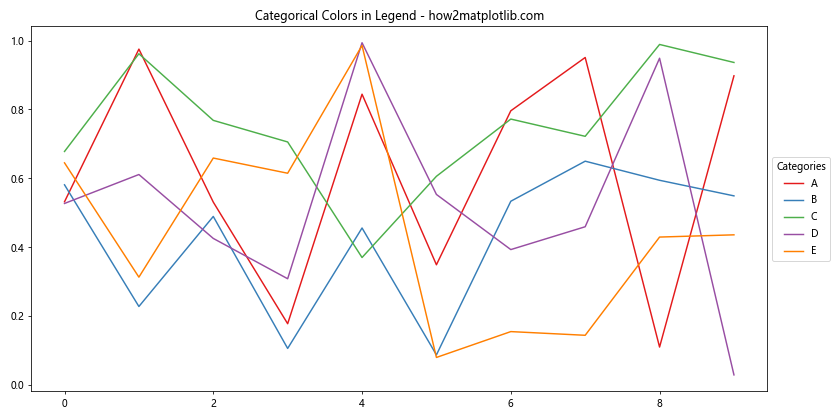
这个例子展示了如何为不同的类别使用不同的颜色,并在图例中反映这些颜色。这种方法可以帮助读者快速识别不同的数据类别。
20. 图例中的颜色强调
有时,我们可能想要强调图例中的某些项目。这可以通过调整这些项目的颜色饱和度或亮度来实现。
import matplotlib.pyplot as plt
import numpy as np
from matplotlib.colors import rgb_to_hsv, hsv_to_rgb

plt.figure(figsize=(10, 6))

x = np.linspace(0, 10, 100)
for i in range(5):
    plt.plot(x, np.sin(x + i*0.5), label=f'Line {i+1}')

legend = plt.legend(loc='upper right')

# 强调第三个图例项
for i, text in enumerate(legend.get_texts()):
    color = text.get_color()
    if i == 2:  # 第三个项目
        hsv = rgb_to_hsv(color[:3])
        hsv[1] *= 2  # 增加饱和度
        rgb = hsv_to_rgb(hsv)
        text.set_color(rgb)

plt.title('Emphasized Legend Item - how2matplotlib.com')
plt.show()
在这个例子中,我们通过增加第三个图例项的颜色饱和度来强调它。这种技术可以用来引导读者注意特定的数据系列或类别。
总结起来,Matplotlib提供了丰富的工具和技术来自定义图例的颜色。从简单的颜色设置到复杂的颜色编码,我们可以使用这些方法来增强图表的可读性和吸引力。通过合理使用颜色,我们可以使图例不仅仅是数据的标识符,还能成为传达额外信息的有力工具。在实际应用中,选择适当的颜色方案和技术取决于数据的性质和你想要强调的信息。无论是科学可视化、数据分析还是商业报告,掌握这些图例颜色技巧都将大大提升你的数据展示能力。
 极客笔记
极客笔记