Matplotlib中使用set_constrained_layout()优化图表布局
参考:Matplotlib.figure.Figure.set_constrained_layout() in Python
Matplotlib是Python中最常用的数据可视化库之一,它提供了丰富的绘图功能和灵活的自定义选项。在创建复杂的图表时,合理的布局对于提高可读性和美观度至关重要。Matplotlib的Figure.set_constrained_layout()方法就是为了解决这一问题而设计的。本文将深入探讨set_constrained_layout()方法的使用,以及如何通过它来优化图表布局,提升可视化效果。
1. 什么是constrained_layout?
constrained_layout是Matplotlib中的一个自动布局调整机制,它旨在解决图表元素之间的重叠问题,并优化整体布局。使用constrained_layout可以自动调整子图(subplots)、轴标签、图例等元素的位置,以确保它们不会相互遮挡,同时保持图表的整洁美观。
1.1 constrained_layout的优势
- 自动调整子图之间的间距
- 避免轴标签和刻度标签的重叠
- 优化图例的位置
- 减少手动微调布局的需求
- 提高图表的整体可读性
1.2 基本用法
要启用constrained_layout,我们可以在创建Figure对象时设置constrained_layout=True,或者使用Figure.set_constrained_layout()方法。下面是一个简单的示例:
import matplotlib.pyplot as plt
import numpy as np

# 创建数据
x = np.linspace(0, 10, 100)
y1 = np.sin(x)
y2 = np.cos(x)

# 创建Figure对象并启用constrained_layout
fig = plt.figure(constrained_layout=True)

# 添加子图
ax1 = fig.add_subplot(211)
ax1.plot(x, y1, label='sin(x)')
ax1.set_title('Sine Wave - how2matplotlib.com')
ax1.legend()

ax2 = fig.add_subplot(212)
ax2.plot(x, y2, label='cos(x)')
ax2.set_title('Cosine Wave - how2matplotlib.com')
ax2.legend()

plt.show()
Output:
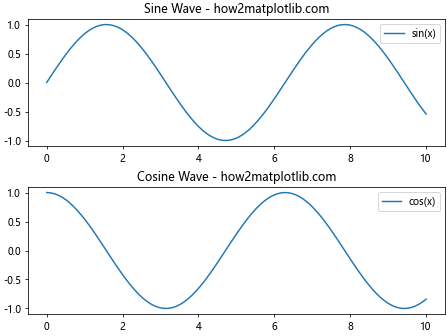
在这个例子中,我们创建了一个包含两个子图的Figure,并在创建时启用了constrained_layout。这将自动调整子图之间的间距和位置,以避免重叠并优化整体布局。
2. set_constrained_layout()方法详解
Figure.set_constrained_layout()方法允许我们在创建Figure对象后动态启用或禁用constrained_layout。这个方法的语法如下:
Figure.set_constrained_layout(constrained)
其中,constrained参数可以是以下值之一:
True:启用constrained_layoutFalse:禁用constrained_layoutNone:重置为默认值(通常为False)
2.1 动态启用constrained_layout
以下示例展示了如何在创建Figure后动态启用constrained_layout:
import matplotlib.pyplot as plt
import numpy as np

# 创建数据
x = np.linspace(0, 10, 100)
y = np.sin(x) * np.exp(-0.1 * x)

# 创建Figure对象(默认不启用constrained_layout)
fig, (ax1, ax2) = plt.subplots(2, 1, figsize=(8, 6))

# 绘制图表
ax1.plot(x, y, label='Damped sine wave')
ax1.set_title('Without constrained_layout - how2matplotlib.com')
ax1.legend()

ax2.plot(x, -y, label='Inverted damped sine wave')
ax2.set_title('Without constrained_layout - how2matplotlib.com')
ax2.legend()

# 显示未启用constrained_layout的图表
plt.tight_layout()
plt.show()

# 启用constrained_layout
fig.set_constrained_layout(True)

# 更新标题
ax1.set_title('With constrained_layout - how2matplotlib.com')
ax2.set_title('With constrained_layout - how2matplotlib.com')

# 显示启用constrained_layout后的图表
plt.show()
在这个例子中,我们首先创建了一个没有启用constrained_layout的Figure,然后使用set_constrained_layout(True)启用它,并比较了两种情况下的布局效果。
2.2 禁用constrained_layout
同样,我们也可以使用set_constrained_layout(False)来禁用已经启用的constrained_layout:
import matplotlib.pyplot as plt
import numpy as np

# 创建数据
x = np.linspace(0, 2*np.pi, 100)
y1 = np.sin(x)
y2 = np.cos(x)

# 创建启用constrained_layout的Figure
fig, (ax1, ax2) = plt.subplots(1, 2, constrained_layout=True, figsize=(10, 4))

# 绘制图表
ax1.plot(x, y1, label='sin(x)')
ax1.set_title('Sine - Constrained Layout Enabled - how2matplotlib.com')
ax1.legend()

ax2.plot(x, y2, label='cos(x)')
ax2.set_title('Cosine - Constrained Layout Enabled - how2matplotlib.com')
ax2.legend()

# 显示启用constrained_layout的图表
plt.show()

# 禁用constrained_layout
fig.set_constrained_layout(False)

# 更新标题
ax1.set_title('Sine - Constrained Layout Disabled - how2matplotlib.com')
ax2.set_title('Cosine - Constrained Layout Disabled - how2matplotlib.com')

# 显示禁用constrained_layout后的图表
plt.tight_layout()
plt.show()
这个例子展示了如何在最初启用constrained_layout的情况下,通过set_constrained_layout(False)来禁用它,并比较两种情况下的布局效果。
3. constrained_layout的工作原理
constrained_layout使用一种称为”约束布局求解器”的算法来优化图表元素的位置。这个算法考虑了以下因素:
- 子图的大小和位置
- 轴标签和刻度标签的大小
- 图例的大小和位置
- 整体Figure的大小
基于这些信息,constrained_layout会尝试找到一个最优的布局方案,以确保所有元素都能正确显示,并且彼此之间不会重叠。
3.1 constrained_layout vs. tight_layout
Matplotlib还提供了另一个自动布局调整方法:tight_layout()。虽然两者都旨在优化布局,但constrained_layout通常能够提供更好的结果,特别是在处理复杂布局时。以下是一个比较两种方法的示例:
import matplotlib.pyplot as plt
import numpy as np

def create_complex_plot(use_constrained_layout=False):
    x = np.linspace(0, 10, 100)
    y1 = np.sin(x)
    y2 = np.cos(x)
    y3 = np.tan(x)

    fig = plt.figure(figsize=(12, 8))
    if use_constrained_layout:
        fig.set_constrained_layout(True)

    # 创建不同大小的子图
    gs = fig.add_gridspec(3, 3)
    ax1 = fig.add_subplot(gs[0, :2])
    ax2 = fig.add_subplot(gs[1, 1:])
    ax3 = fig.add_subplot(gs[2, :])
    ax4 = fig.add_subplot(gs[:2, 2])

    # 绘制图表
    ax1.plot(x, y1, label='sin(x)')
    ax1.set_title('Sine Wave - how2matplotlib.com')
    ax1.legend()

    ax2.plot(x, y2, label='cos(x)')
    ax2.set_title('Cosine Wave - how2matplotlib.com')
    ax2.legend()

    ax3.plot(x, y3, label='tan(x)')
    ax3.set_title('Tangent Wave - how2matplotlib.com')
    ax3.legend()

    ax4.plot(y1, y2, label='sin(x) vs cos(x)')
    ax4.set_title('Lissajous Figure - how2matplotlib.com')
    ax4.legend()

    if not use_constrained_layout:
        plt.tight_layout()

    plt.show()

# 使用tight_layout
create_complex_plot(use_constrained_layout=False)

# 使用constrained_layout
create_complex_plot(use_constrained_layout=True)
这个例子创建了一个复杂的布局,包含不同大小和位置的子图。通过比较使用tight_layout和constrained_layout的结果,我们可以看到constrained_layout通常能够提供更好的空间利用和更均衡的布局。
4. 自定义constrained_layout
虽然constrained_layout通常能够自动生成良好的布局,但有时我们可能需要对其进行微调。Matplotlib提供了一些参数来控制constrained_layout的行为。
4.1 调整子图之间的间距
我们可以使用w_pad和h_pad参数来调整子图之间的水平和垂直间距:
import matplotlib.pyplot as plt
import numpy as np

# 创建数据
x = np.linspace(0, 10, 100)
y1 = np.sin(x)
y2 = np.cos(x)

# 创建Figure对象并启用constrained_layout
fig, (ax1, ax2) = plt.subplots(2, 1, constrained_layout=True, figsize=(8, 6))

# 绘制图表
ax1.plot(x, y1, label='sin(x)')
ax1.set_title('Sine Wave - how2matplotlib.com')
ax1.legend()

ax2.plot(x, y2, label='cos(x)')
ax2.set_title('Cosine Wave - how2matplotlib.com')
ax2.legend()

# 调整子图之间的间距
fig.set_constrained_layout_pads(w_pad=0.1, h_pad=0.5)

plt.show()
Output:
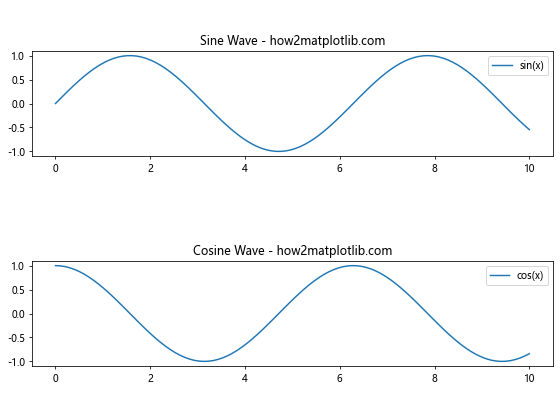
在这个例子中,我们使用fig.set_constrained_layout_pads()方法来调整子图之间的间距。w_pad控制水平间距,h_pad控制垂直间距。
4.2 调整Figure边缘的间距
我们还可以使用wspace和hspace参数来调整Figure边缘的间距:
import matplotlib.pyplot as plt
import numpy as np

# 创建数据
x = np.linspace(0, 10, 100)
y1 = np.sin(x)
y2 = np.cos(x)

# 创建Figure对象并启用constrained_layout
fig, ((ax1, ax2), (ax3, ax4)) = plt.subplots(2, 2, constrained_layout=True, figsize=(10, 8))

# 绘制图表
ax1.plot(x, y1, label='sin(x)')
ax1.set_title('Sine Wave 1 - how2matplotlib.com')
ax1.legend()

ax2.plot(x, y2, label='cos(x)')
ax2.set_title('Cosine Wave 1 - how2matplotlib.com')
ax2.legend()

ax3.plot(x, -y1, label='-sin(x)')
ax3.set_title('Sine Wave 2 - how2matplotlib.com')
ax3.legend()

ax4.plot(x, -y2, label='-cos(x)')
ax4.set_title('Cosine Wave 2 - how2matplotlib.com')
ax4.legend()

# 调整Figure边缘的间距
fig.set_constrained_layout_pads(wspace=0.1, hspace=0.2)

plt.show()
Output:
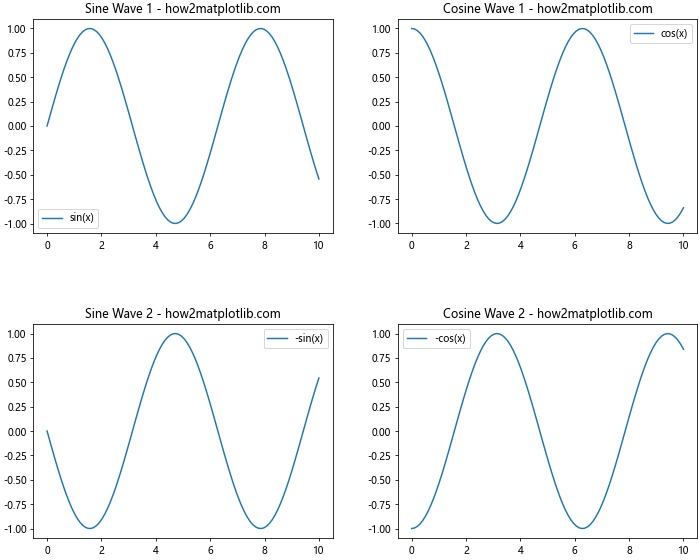
在这个例子中,我们使用wspace和hspace参数来调整Figure边缘的水平和垂直间距。
5. 在复杂布局中使用constrained_layout
constrained_layout在处理复杂布局时特别有用,例如包含多个子图、嵌套子图或不规则网格的图表。以下是一些在复杂布局中使用constrained_layout的示例。
5.1 不规则网格布局
import matplotlib.pyplot as plt
import numpy as np

# 创建数据
x = np.linspace(0, 10, 100)
y1 = np.sin(x)
y2 = np.cos(x)
y3 = np.tan(x)

# 创建Figure对象并启用constrained_layout
fig = plt.figure(constrained_layout=True, figsize=(12, 8))

# 创建不规则网格
gs = fig.add_gridspec(3, 3)

# 添加子图
ax1 = fig.add_subplot(gs[0, :2])
ax2 = fig.add_subplot(gs[1, 1:])
ax3 = fig.add_subplot(gs[2, :])
ax4 = fig.add_subplot(gs[:2, 2])

# 绘制图表
ax1.plot(x, y1, label='sin(x)')
ax1.set_title('Sine Wave - how2matplotlib.com')
ax1.legend()

ax2.plot(x, y2, label='cos(x)')
ax2.set_title('Cosine Wave - how2matplotlib.com')
ax2.legend()

ax3.plot(x, y3, label='tan(x)')
ax3.set_title('Tangent Wave - how2matplotlib.com')
ax3.legend()

ax4.plot(y1, y2, label='sin(x) vs cos(x)')
ax4.set_title('Lissajous Figure - how2matplotlib.com')
ax4.legend()

plt.show()
Output:
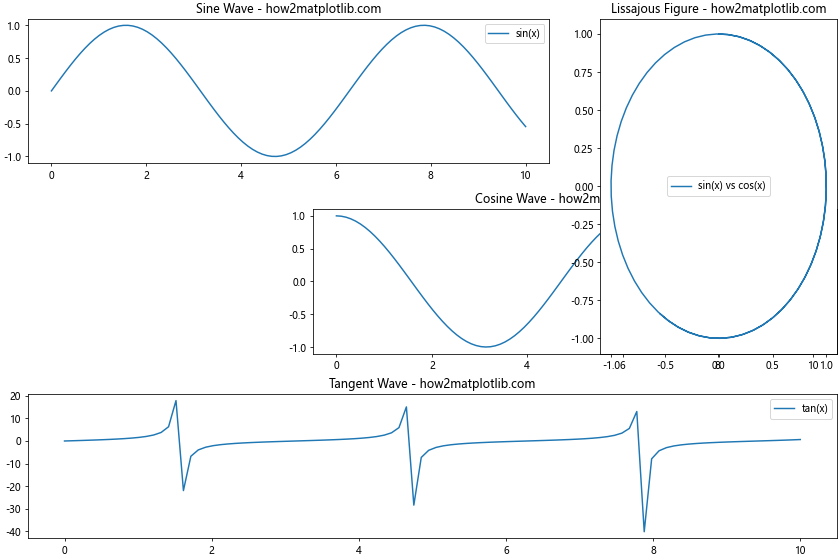
这个例子展示了如何使用GridSpec创建不规则的网格布局,并结合constrained_layout来优化整体布局。
5.2 嵌套子图
constrained_layout也可以处理嵌套子图的情况。以下是一个包含嵌套子图的示例:
import matplotlib.pyplot as plt
import numpy as np

# 创建数据
x = np.linspace(0, 10, 100)
y1 = np.sin(x)
y2 = np.cos(x)
y3 = np.exp(-0.1 * x) * np.sin(x)

# 创建Figure对象并启用constrained_layout
fig = plt.figure(constrained_layout=True, figsize=(12, 8))

# 创建外层网格
outer_grid = fig.add_gridspec(2, 2)

# 添加主子图
ax1 = fig.add_subplot(outer_grid[0, 0])
ax2 = fig.add_subplot(outer_grid[0, 1])
ax3 = fig.add_subplot(outer_grid[1, :])

# 创建嵌套子图
inner_grid = outer_grid[1, 1].subgridspec(2, 2)
ax4 = fig.add_subplot(inner_grid[0, 0])
ax5 = fig.add_subplot(inner_grid[0, 1])
ax6 = fig.add_subplot(inner_grid[1, :])

# 绘制图表
ax1.plot(x, y1, label='sin(x)')
ax1.set_title('Sine Wave - how2matplotlib.com')
ax1.legend()

ax2.plot(x, y2, label='cos(x)')
ax2.set_title('Cosine Wave - how2matplotlib.com')
ax2.legend()

ax3.plot(x, y3, label='Damped sine wave')
ax3.set_title('Damped Sine Wave - how2matplotlib.com')
ax3.legend()

ax4.plot(x[:50], y1[:50], label='sin(x)')
ax4.set_title('Partial Sine - how2matplotlib.com')
ax4.legend()

ax5.plot(x[:50], y2[:50], label='cos(x)')
ax5.set_title('Partial Cosine - how2matplotlib.com')
ax5.legend()

ax6.plot(x[:50], y3[:50], label='Damped sine')
ax6.set_title('Partial Damped Sine - how2matplotlib.com')
ax6.legend()

plt.show()
Output:
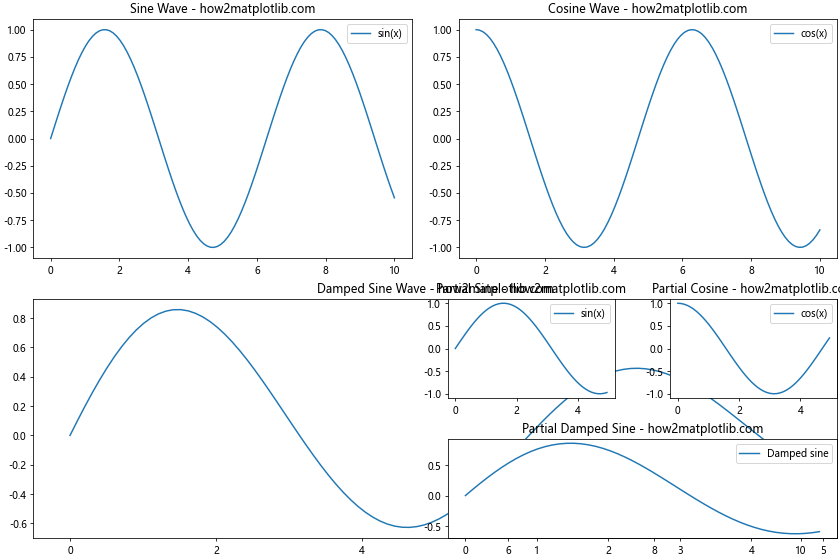
这个例子展示了如何创建包含嵌套子图的复杂布局,并使用constrained_layout来自动调整所有子图的位置和大小。
6. constrained_layout的限制和注意事项
尽管constrained_layout在大多数情况下都能很好地工作,但它也有一些限制和需要注意的事项:
- 性能影响:对于非常复杂的布局或大量子图,constrained_layout可能会增加图表渲染的时间。
-
兼容性:某些Matplotlib功能可能与constrained_layout不完全兼容,例如一些特殊的轴位置或自定义的图表元素。
-
动态更新:在交互式环境中动态更新图表时,constrained_layout可能需要重新计算,这可能会导致布局的突然变化。
-
固定大小的元素:constrained_layout可能无法正确处理具有固定大小的图表元素。
6.1 处理constrained_layout的限制
以下是一些处理constrained_layout限制的建议:
- 对于非常复杂的布局,考虑手动调整或使用其他布局方法。
-
在使用不常见的Matplotlib功能时,测试constrained_layout的效果,必要时禁用它。
-
在交互式环境中,可以考虑在最终更新时才启用constrained_layout。
-
对于固定大小的元素,可以尝试使用
fig.set_constrained_layout_pads()方法进行微调。
import matplotlib.pyplot as plt
import numpy as np

# 创建数据
x = np.linspace(0, 10, 100)
y = np.sin(x)

# 创建Figure对象并启用constrained_layout
fig, ax = plt.subplots(constrained_layout=True, figsize=(8, 6))

# 绘制主图表
ax.plot(x, y, label='sin(x)')
ax.set_title('Sine Wave with Inset - how2matplotlib.com')
ax.legend()

# 添加固定大小的嵌入式子图
inset_ax = ax.inset_axes([0.6, 0.1, 0.3, 0.3])
inset_ax.plot(x, y**2, color='red')
inset_ax.set_title('sin²(x)')

# 微调constrained_layout的参数
fig.set_constrained_layout_pads(w_pad=0.1, h_pad=0.1, wspace=0.1, hspace=0.1)

plt.show()
Output:
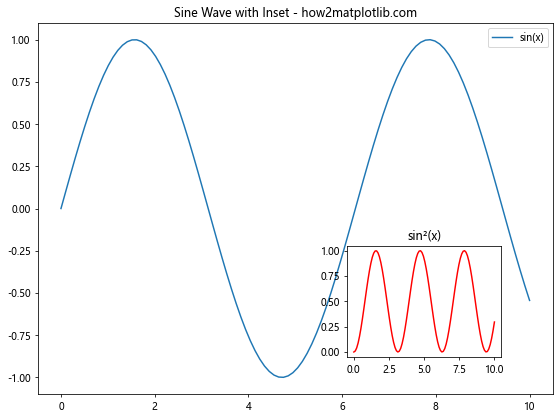
在这个例子中,我们添加了一个固定大小的嵌入式子图,并使用fig.set_constrained_layout_pads()方法微调布局参数,以适应这个特殊元素。
7. 结合其他Matplotlib功能使用constrained_layout
constrained_layout可以与许多其他Matplotlib功能结合使用,以创建更复杂和信息丰富的可视化。以下是一些示例:
7.1 结合colorbar使用
import matplotlib.pyplot as plt
import numpy as np

# 创建数据
x = np.linspace(-3, 3, 100)
y = np.linspace(-3, 3, 100)
X, Y = np.meshgrid(x, y)
Z = np.sin(X) * np.cos(Y)

# 创建Figure对象并启用constrained_layout
fig, (ax1, ax2) = plt.subplots(1, 2, constrained_layout=True, figsize=(12, 5))

# 绘制热图
im1 = ax1.imshow(Z, cmap='viridis', extent=[-3, 3, -3, 3])
ax1.set_title('Heatmap with Colorbar - how2matplotlib.com')
fig.colorbar(im1, ax=ax1, label='Value')

# 绘制等高线图
cs = ax2.contourf(X, Y, Z, cmap='coolwarm', levels=20)
ax2.set_title('Contour Plot with Colorbar - how2matplotlib.com')
fig.colorbar(cs, ax=ax2, label='Value')

plt.show()
Output:
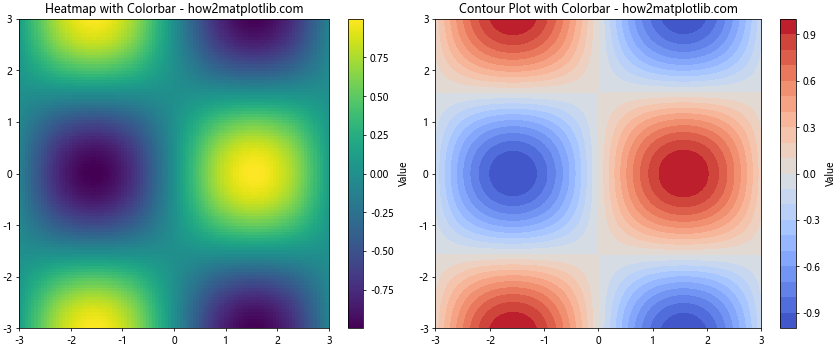
这个例子展示了如何在使用constrained_layout的同时添加colorbar,并确保布局正确。
7.2 结合多个y轴使用
import matplotlib.pyplot as plt
import numpy as np

# 创建数据
x = np.linspace(0, 10, 100)
y1 = np.sin(x)
y2 = np.exp(x/10)

# 创建Figure对象并启用constrained_layout
fig, ax1 = plt.subplots(constrained_layout=True, figsize=(10, 6))

# 绘制第一个y轴的数据
color = 'tab:blue'
ax1.set_xlabel('x')
ax1.set_ylabel('sin(x)', color=color)
ax1.plot(x, y1, color=color, label='sin(x)')
ax1.tick_params(axis='y', labelcolor=color)

# 创建第二个y轴
ax2 = ax1.twinx()
color = 'tab:orange'
ax2.set_ylabel('exp(x/10)', color=color)
ax2.plot(x, y2, color=color, label='exp(x/10)')
ax2.tick_params(axis='y', labelcolor=color)

# 添加标题和图例
plt.title('Two Scales Plot - how2matplotlib.com')
fig.legend(loc='upper left', bbox_to_anchor=(0.1, 1), bbox_transform=ax1.transAxes)

plt.show()
Output:
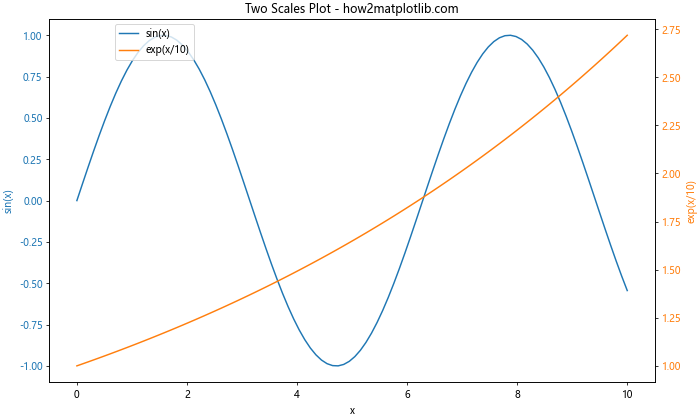
这个例子展示了如何在使用constrained_layout的同时创建具有多个y轴的图表。
8. 在不同的绘图类型中使用constrained_layout
constrained_layout可以应用于各种不同类型的图表。以下是一些常见图表类型的示例:
8.1 散点图
import matplotlib.pyplot as plt
import numpy as np

# 创建数据
np.random.seed(42)
x = np.random.rand(50)
y = np.random.rand(50)
colors = np.random.rand(50)
sizes = 1000 * np.random.rand(50)

# 创建Figure对象并启用constrained_layout
fig, ax = plt.subplots(constrained_layout=True, figsize=(8, 6))

# 绘制散点图
scatter = ax.scatter(x, y, c=colors, s=sizes, alpha=0.5, cmap='viridis')

# 添加colorbar
cbar = plt.colorbar(scatter)
cbar.set_label('Color Value')

# 设置标题和轴标签
ax.set_title('Scatter Plot - how2matplotlib.com')
ax.set_xlabel('X-axis')
ax.set_ylabel('Y-axis')

plt.show()
Output:
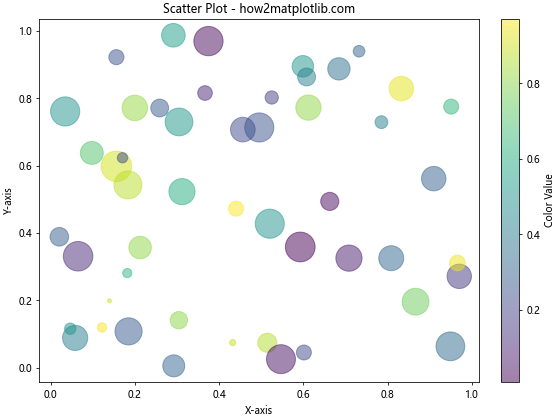
8.2 柱状图
import matplotlib.pyplot as plt
import numpy as np

# 创建数据
categories = ['A', 'B', 'C', 'D', 'E']
values1 = np.random.rand(5) * 10
values2 = np.random.rand(5) * 10

# 创建Figure对象并启用constrained_layout
fig, ax = plt.subplots(constrained_layout=True, figsize=(10, 6))

# 设置柱的位置
x = np.arange(len(categories))
width = 0.35

# 绘制柱状图
rects1 = ax.bar(x - width/2, values1, width, label='Group 1', color='skyblue')
rects2 = ax.bar(x + width/2, values2, width, label='Group 2', color='lightgreen')

# 添加一些文本,标签等
ax.set_ylabel('Values')
ax.set_title('Grouped Bar Chart - how2matplotlib.com')
ax.set_xticks(x)
ax.set_xticklabels(categories)
ax.legend()

# 在柱上添加标签
ax.bar_label(rects1, padding=3)
ax.bar_label(rects2, padding=3)

plt.show()
Output:
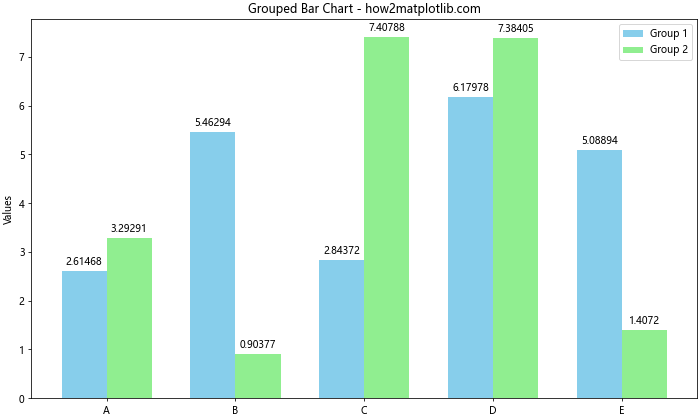
8.3 饼图
import matplotlib.pyplot as plt

# 创建数据
sizes = [30, 25, 20, 15, 10]
labels = ['A', 'B', 'C', 'D', 'E']
colors = ['#ff9999', '#66b3ff', '#99ff99', '#ffcc99', '#ff99cc']
explode = (0.1, 0, 0, 0, 0)  # 突出显示第一个扇形

# 创建Figure对象并启用constrained_layout
fig, ax = plt.subplots(constrained_layout=True, figsize=(8, 8))

# 绘制饼图
ax.pie(sizes, explode=explode, labels=labels, colors=colors, autopct='%1.1f%%',
       shadow=True, startangle=90)

# 确保饼图是圆的
ax.axis('equal')

# 添加标题
ax.set_title('Pie Chart - how2matplotlib.com')

plt.show()
Output:
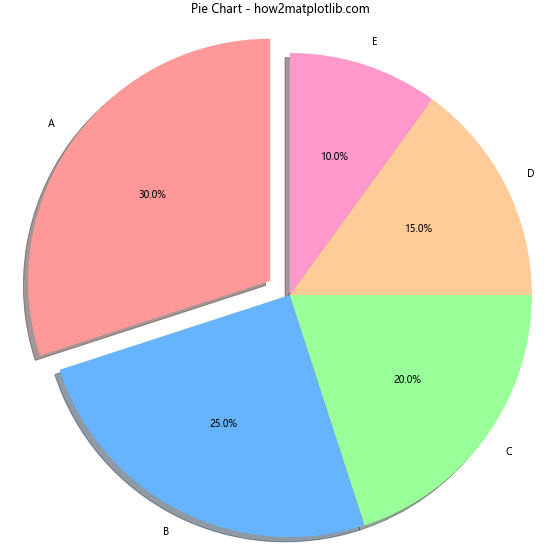
9. 在实际应用中使用constrained_layout
在实际应用中,constrained_layout可以帮助我们创建复杂的数据可视化,同时保持良好的布局。以下是一个更复杂的示例,展示了如何在一个图表中结合多种类型的可视化:
import matplotlib.pyplot as plt
import numpy as np

# 创建数据
np.random.seed(42)
x = np.linspace(0, 10, 100)
y1 = np.sin(x)
y2 = np.cos(x)
y3 = np.random.normal(0, 0.1, 100)

# 创建Figure对象并启用constrained_layout
fig = plt.figure(constrained_layout=True, figsize=(15, 10))

# 创建网格
gs = fig.add_gridspec(3, 3)

# 主图:线图
ax1 = fig.add_subplot(gs[0, :2])
ax1.plot(x, y1, label='sin(x)')
ax1.plot(x, y2, label='cos(x)')
ax1.set_title('Sine and Cosine Waves - how2matplotlib.com')
ax1.legend()

# 右上角:散点图
ax2 = fig.add_subplot(gs[0, 2])
ax2.scatter(y1, y2, c=x, cmap='viridis')
ax2.set_title('Sine vs Cosine - how2matplotlib.com')
ax2.set_xlabel('sin(x)')
ax2.set_ylabel('cos(x)')

# 中间左:柱状图
ax3 = fig.add_subplot(gs[1, 0])
ax3.bar(x[::10], y1[::10], width=0.5)
ax3.set_title('Sine Values - how2matplotlib.com')

# 中间中:热图
ax4 = fig.add_subplot(gs[1, 1])
im = ax4.imshow(np.outer(y1, y2), cmap='coolwarm', extent=[0, 10, 0, 10])
ax4.set_title('Outer Product - how2matplotlib.com')
fig.colorbar(im, ax=ax4)

# 中间右:饼图
ax5 = fig.add_subplot(gs[1, 2])
sizes = [np.sum(y1 > 0), np.sum(y1 <= 0)]
ax5.pie(sizes, labels=['Positive', 'Negative'], autopct='%1.1f%%')
ax5.set_title('Sine Sign Distribution - how2matplotlib.com')

# 底部:直方图
ax6 = fig.add_subplot(gs[2, :])
ax6.hist(y3, bins=30, alpha=0.7)
ax6.set_title('Histogram of Random Noise - how2matplotlib.com')

plt.show()
Output:
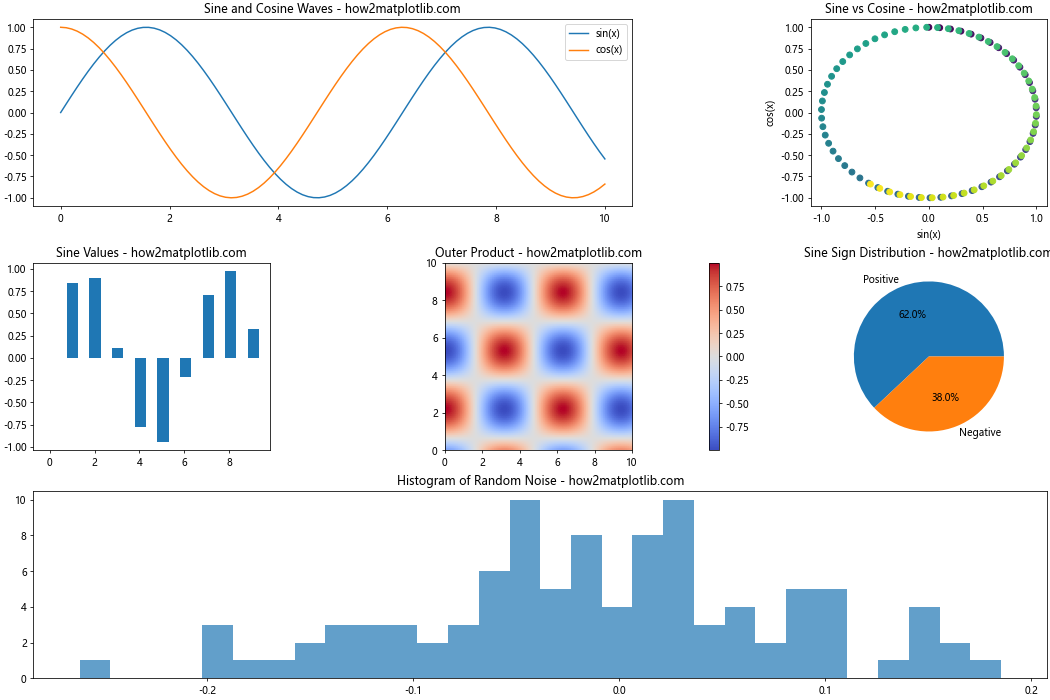
这个例子展示了如何在一个复杂的布局中结合多种类型的图表,包括线图、散点图、柱状图、热图、饼图和直方图。通过使用constrained_layout,我们可以确保所有这些元素都能够正确地排列,没有重叠,并且充分利用了可用空间。
10. 常见问题和解决方案
在使用constrained_layout时,可能会遇到一些常见问题。以下是一些问题及其解决方案:
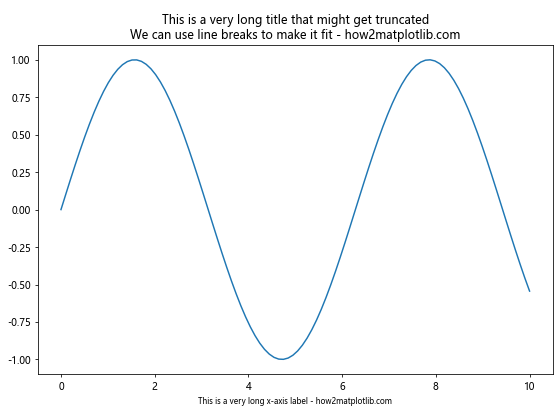
10.1 标题或标签被截断
有时,constrained_layout可能无法正确处理特别长的标题或标签。在这种情况下,可以尝试以下解决方案:
- 调整Figure的大小
- 使用换行符(\n)来分割长标题
- 减小字体大小
- 手动调整pad参数
import matplotlib.pyplot as plt
import numpy as np

# 创建数据
x = np.linspace(0, 10, 100)
y = np.sin(x)

# 创建Figure对象并启用constrained_layout
fig, ax = plt.subplots(constrained_layout=True, figsize=(8, 6))

# 绘制图表
ax.plot(x, y)

# 设置一个很长的标题
ax.set_title('This is a very long title that might get truncated\n'
             'We can use line breaks to make it fit - how2matplotlib.com')

# 设置一个很长的x轴标签
ax.set_xlabel('This is a very long x-axis label - how2matplotlib.com', fontsize=8)

# 调整pad参数
fig.set_constrained_layout_pads(w_pad=0.1, h_pad=0.2, wspace=0.1, hspace=0.1)

plt.show()
Output:
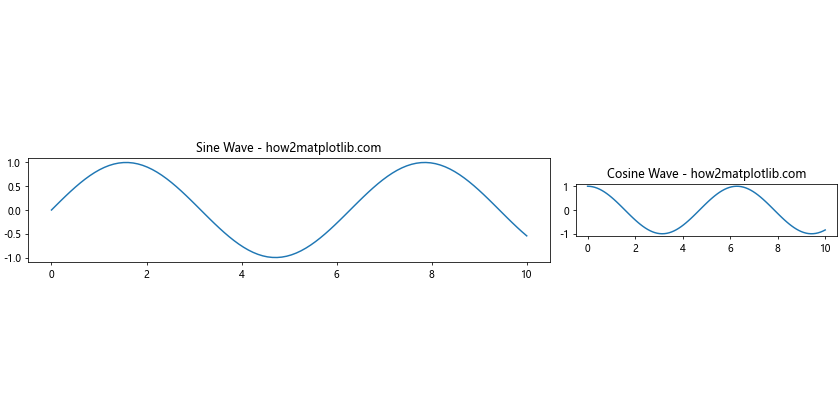
10.2 子图大小不均匀
有时,constrained_layout可能会导致子图大小不均匀。解决这个问题的方法包括:
- 使用GridSpec明确指定子图的大小比例
- 调整子图的aspect ratio
- 手动设置子图的位置和大小
import matplotlib.pyplot as plt
import numpy as np

# 创建数据
x = np.linspace(0, 10, 100)
y1 = np.sin(x)
y2 = np.cos(x)

# 创建Figure对象并启用constrained_layout
fig = plt.figure(constrained_layout=True, figsize=(12, 6))

# 使用GridSpec明确指定子图的大小比例
gs = fig.add_gridspec(1, 2, width_ratios=[2, 1])

# 创建子图
ax1 = fig.add_subplot(gs[0])
ax2 = fig.add_subplot(gs[1])

# 绘制图表
ax1.plot(x, y1)
ax1.set_title('Sine Wave - how2matplotlib.com')

ax2.plot(x, y2)
ax2.set_title('Cosine Wave - how2matplotlib.com')

# 设置相同的aspect ratio
ax1.set_aspect('equal', adjustable='box')
ax2.set_aspect('equal', adjustable='box')

plt.show()
Output:
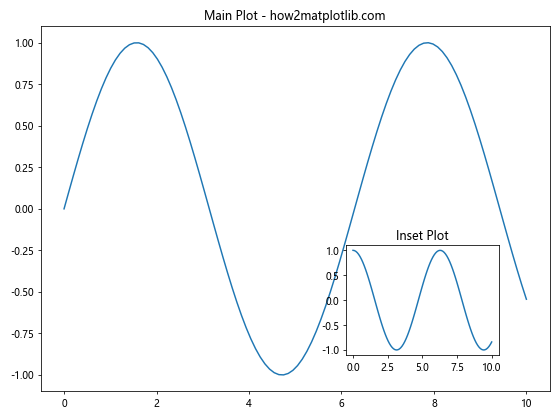
10.3 与某些Matplotlib功能不兼容
某些Matplotlib功能可能与constrained_layout不完全兼容。在这种情况下,可以考虑以下解决方案:
- 禁用constrained_layout,改用tight_layout或手动调整
- 尝试使用不同的Matplotlib版本
- 寻找替代的绘图方法
import matplotlib.pyplot as plt
import numpy as np

# 创建数据
x = np.linspace(0, 10, 100)
y = np.sin(x)

# 创建Figure对象,不启用constrained_layout
fig, ax = plt.subplots(figsize=(8, 6))

# 绘制主图表
ax.plot(x, y)
ax.set_title('Main Plot - how2matplotlib.com')

# 添加可能与constrained_layout不兼容的元素
ax_inset = ax.inset_axes([0.6, 0.1, 0.3, 0.3])
ax_inset.plot(x, np.cos(x))
ax_inset.set_title('Inset Plot')

# 使用tight_layout代替constrained_layout
plt.tight_layout()

plt.show()
Output:
11. 总结
Matplotlib的Figure.set_constrained_layout()方法是一个强大的工具,可以帮助我们自动优化图表布局,特别是在处理复杂的多子图布局时。通过本文的详细介绍和示例,我们了解了以下几点:
- constrained_layout的基本原理和使用方法
- 如何动态启用和禁用constrained_layout
- constrained_layout与tight_layout的比较
- 在复杂布局中使用constrained_layout的技巧
- constrained_layout的限制和注意事项
- 如何结合其他Matplotlib功能使用constrained_layout
- 在不同类型的图表中应用constrained_layout
- 实际应用中的复杂示例
- 常见问题及其解决方案
通过掌握set_constrained_layout()方法,我们可以更轻松地创建美观、专业的数据可视化,同时减少手动调整布局的时间和精力。在实际项目中,建议根据具体需求和图表复杂度来选择是否使用constrained_layout,并结合其他Matplotlib功能来实现最佳的可视化效果。
最后,随着Matplotlib的不断发展,constrained_layout功能可能会有进一步的改进和优化。建议定期关注Matplotlib的更新,以便及时了解新特性和改进。
 极客笔记
极客笔记