Matplotlib中的axis_date()函数:轻松处理时间序列数据
参考:Matplotlib.axis.Axis.axis_date() function in Python
Matplotlib是Python中最流行的数据可视化库之一,它提供了丰富的工具和函数来创建各种类型的图表。在处理时间序列数据时,axis_date()函数是一个非常有用的工具。本文将深入探讨axis_date()函数的用法、特性和应用场景,帮助你更好地掌握这个强大的功能。
1. axis_date()函数简介
axis_date()函数是Matplotlib库中Axis类的一个方法,它主要用于将坐标轴设置为日期时间格式。这个函数可以自动处理日期时间数据,使其在图表上以合适的格式显示,从而大大简化了时间序列数据的可视化过程。
让我们来看一个简单的示例,了解axis_date()的基本用法:
import matplotlib.pyplot as plt
import matplotlib.dates as mdates
import datetime

# 创建一些示例数据
dates = [datetime.datetime(2023, 1, 1) + datetime.timedelta(days=i) for i in range(10)]
values = [i**2 for i in range(10)]

# 创建图表
fig, ax = plt.subplots(figsize=(10, 6))

# 绘制数据
ax.plot(dates, values, label='how2matplotlib.com')

# 使用axis_date()设置x轴为日期格式
ax.xaxis.axis_date()

# 设置标题和标签
ax.set_title('使用axis_date()函数的简单示例')
ax.set_xlabel('日期')
ax.set_ylabel('值')

# 添加图例
ax.legend()

# 自动调整日期标签
fig.autofmt_xdate()

plt.show()
Output:
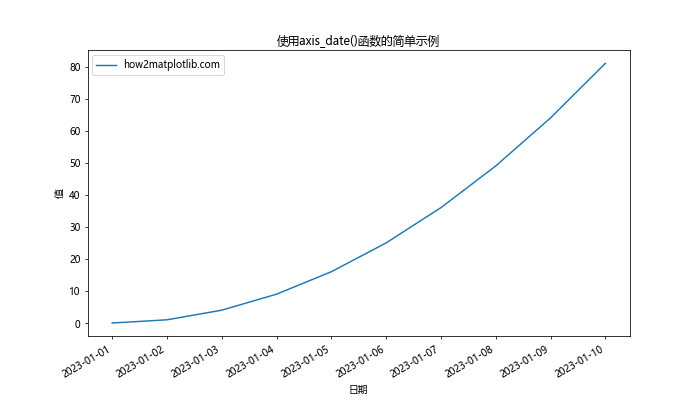
在这个示例中,我们创建了一个简单的时间序列数据,然后使用axis_date()函数将x轴设置为日期格式。这样,x轴上的刻度和标签就会自动以日期的形式显示,而不是默认的数值形式。
2. axis_date()函数的参数
axis_date()函数有几个可选参数,可以用来进一步自定义日期轴的显示方式:
tz:用于指定时区。默认为None,表示使用系统默认时区。unit:指定日期单位,可以是’D’(天)、’M’(月)或’Y’(年)。默认为None,会自动选择合适的单位。interval:指定刻度间隔。默认为None,会自动选择合适的间隔。
让我们通过一个示例来看看如何使用这些参数:
import matplotlib.pyplot as plt
import matplotlib.dates as mdates
import datetime
import pytz

# 创建一些示例数据
dates = [datetime.datetime(2023, 1, 1) + datetime.timedelta(days=i) for i in range(365)]
values = [i**2 for i in range(365)]

# 创建图表
fig, ax = plt.subplots(figsize=(12, 6))

# 绘制数据
ax.plot(dates, values, label='how2matplotlib.com')

# 使用axis_date()设置x轴为日期格式,并指定参数
ax.xaxis.axis_date(tz=pytz.timezone('US/Eastern'), unit='M', interval=2)

# 设置标题和标签
ax.set_title('使用axis_date()函数的高级示例')
ax.set_xlabel('日期')
ax.set_ylabel('值')

# 添加图例
ax.legend()

# 自动调整日期标签
fig.autofmt_xdate()

plt.show()
在这个示例中,我们使用了tz参数来指定东部时区,unit参数设置为’M’表示按月显示,interval参数设置为2表示每隔两个月显示一个刻度。这样可以得到一个更加定制化的日期轴。
3. 结合DateFormatter使用
axis_date()函数通常与DateFormatter一起使用,以更精细地控制日期的显示格式。DateFormatter允许你使用strftime格式字符串来自定义日期的显示方式。
下面是一个结合DateFormatter使用的示例:
import matplotlib.pyplot as plt
import matplotlib.dates as mdates
import datetime

# 创建一些示例数据
dates = [datetime.datetime(2023, 1, 1) + datetime.timedelta(days=i) for i in range(365)]
values = [i**2 for i in range(365)]

# 创建图表
fig, ax = plt.subplots(figsize=(12, 6))

# 绘制数据
ax.plot(dates, values, label='how2matplotlib.com')

# 使用axis_date()设置x轴为日期格式
ax.xaxis.axis_date()

# 使用DateFormatter自定义日期格式
date_formatter = mdates.DateFormatter("%Y-%m-%d")
ax.xaxis.set_major_formatter(date_formatter)

# 设置标题和标签
ax.set_title('结合DateFormatter使用axis_date()函数')
ax.set_xlabel('日期')
ax.set_ylabel('值')

# 添加图例
ax.legend()

# 自动调整日期标签
fig.autofmt_xdate()

plt.show()
Output:
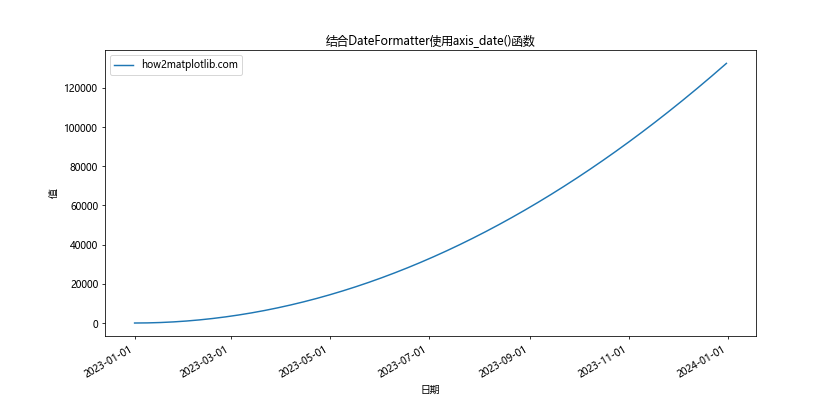
在这个示例中,我们使用DateFormatter将日期格式设置为”年-月-日”的形式。这样可以更精确地控制日期在x轴上的显示方式。
4. 处理不同时间尺度的数据
axis_date()函数可以很好地处理不同时间尺度的数据,从秒级到年级都能够自动调整。让我们看几个处理不同时间尺度数据的示例:
4.1 小时级数据
import matplotlib.pyplot as plt
import matplotlib.dates as mdates
import datetime

# 创建小时级数据
dates = [datetime.datetime(2023, 1, 1) + datetime.timedelta(hours=i) for i in range(24)]
values = [i**2 for i in range(24)]

fig, ax = plt.subplots(figsize=(12, 6))
ax.plot(dates, values, label='how2matplotlib.com')

ax.xaxis.axis_date()
ax.xaxis.set_major_formatter(mdates.DateFormatter('%H:%M'))

ax.set_title('小时级数据示例')
ax.set_xlabel('时间')
ax.set_ylabel('值')
ax.legend()

fig.autofmt_xdate()
plt.show()
Output:
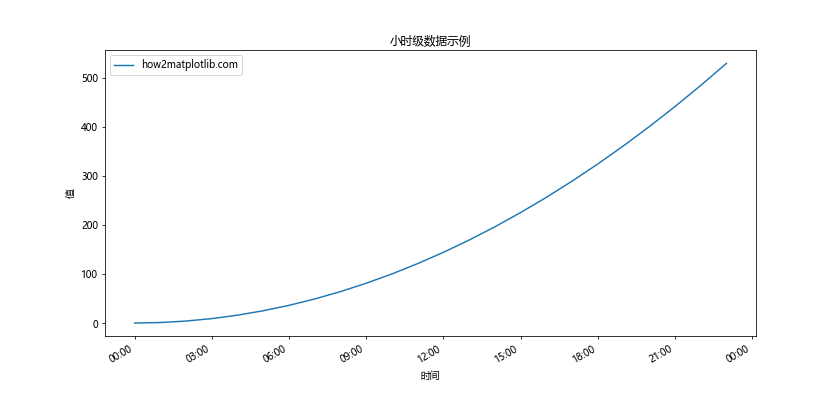
这个示例展示了如何处理和显示小时级的数据。
4.2 月级数据
import matplotlib.pyplot as plt
import matplotlib.dates as mdates
import datetime

# 创建月级数据
dates = [datetime.datetime(2023, 1, 1) + datetime.timedelta(days=30*i) for i in range(12)]
values = [i**2 for i in range(12)]

fig, ax = plt.subplots(figsize=(12, 6))
ax.plot(dates, values, label='how2matplotlib.com')

ax.xaxis.axis_date()
ax.xaxis.set_major_formatter(mdates.DateFormatter('%Y-%m'))

ax.set_title('月级数据示例')
ax.set_xlabel('日期')
ax.set_ylabel('值')
ax.legend()

fig.autofmt_xdate()
plt.show()
Output:
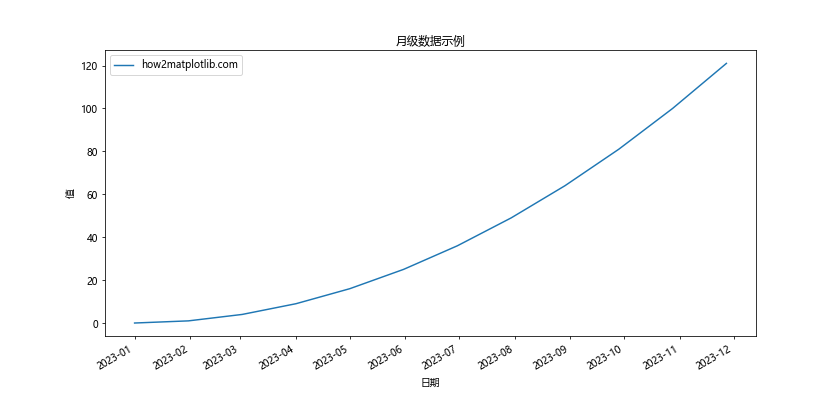
这个示例展示了如何处理和显示月级的数据。
4.3 年级数据
import matplotlib.pyplot as plt
import matplotlib.dates as mdates
import datetime

# 创建年级数据
dates = [datetime.datetime(2000 + i, 1, 1) for i in range(20)]
values = [i**2 for i in range(20)]

fig, ax = plt.subplots(figsize=(12, 6))
ax.plot(dates, values, label='how2matplotlib.com')

ax.xaxis.axis_date()
ax.xaxis.set_major_formatter(mdates.DateFormatter('%Y'))

ax.set_title('年级数据示例')
ax.set_xlabel('年份')
ax.set_ylabel('值')
ax.legend()

fig.autofmt_xdate()
plt.show()
Output:
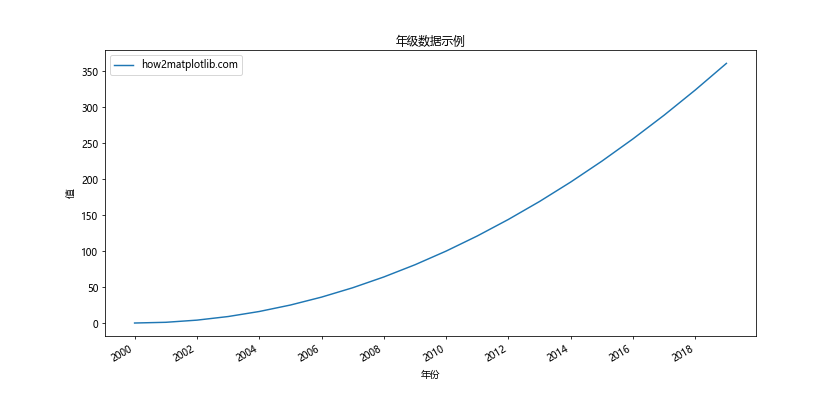
这个示例展示了如何处理和显示年级的数据。
5. 处理不规则时间间隔的数据
在实际应用中,我们经常会遇到不规则时间间隔的数据。axis_date()函数也能很好地处理这种情况。下面是一个处理不规则时间间隔数据的示例:
import matplotlib.pyplot as plt
import matplotlib.dates as mdates
import datetime
import random

# 创建不规则时间间隔的数据
dates = [datetime.datetime(2023, 1, 1)]
for i in range(50):
    dates.append(dates[-1] + datetime.timedelta(days=random.randint(1, 10)))
values = [random.randint(0, 100) for _ in range(len(dates))]

fig, ax = plt.subplots(figsize=(12, 6))
ax.plot(dates, values, label='how2matplotlib.com')

ax.xaxis.axis_date()
ax.xaxis.set_major_formatter(mdates.DateFormatter('%Y-%m-%d'))

ax.set_title('不规则时间间隔数据示例')
ax.set_xlabel('日期')
ax.set_ylabel('值')
ax.legend()

fig.autofmt_xdate()
plt.show()
Output:
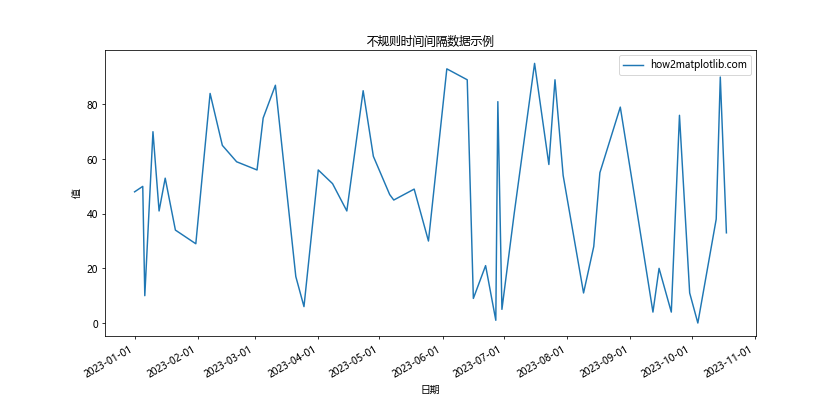
在这个示例中,我们创建了一个日期间隔随机的时间序列,axis_date()函数能够自动调整x轴的刻度和标签,使其适应这种不规则的时间间隔。
6. 自定义刻度位置和标签
有时候,我们可能需要更精细地控制日期轴的刻度位置和标签。这时可以结合使用axis_date()和set_major_locator()函数来实现。下面是一个示例:
import matplotlib.pyplot as plt
import matplotlib.dates as mdates
import datetime

# 创建示例数据
start_date = datetime.datetime(2023, 1, 1)
dates = [start_date + datetime.timedelta(days=i) for i in range(365)]
values = [i**2 for i in range(365)]

fig, ax = plt.subplots(figsize=(12, 6))
ax.plot(dates, values, label='how2matplotlib.com')

ax.xaxis.axis_date()

# 设置主刻度为每月第一天
ax.xaxis.set_major_locator(mdates.MonthLocator())
ax.xaxis.set_major_formatter(mdates.DateFormatter('%Y-%m-%d'))

# 设置次刻度为每周
ax.xaxis.set_minor_locator(mdates.WeekdayLocator())

ax.set_title('自定义刻度位置和标签示例')
ax.set_xlabel('日期')
ax.set_ylabel('值')
ax.legend()

fig.autofmt_xdate()
plt.show()
Output:
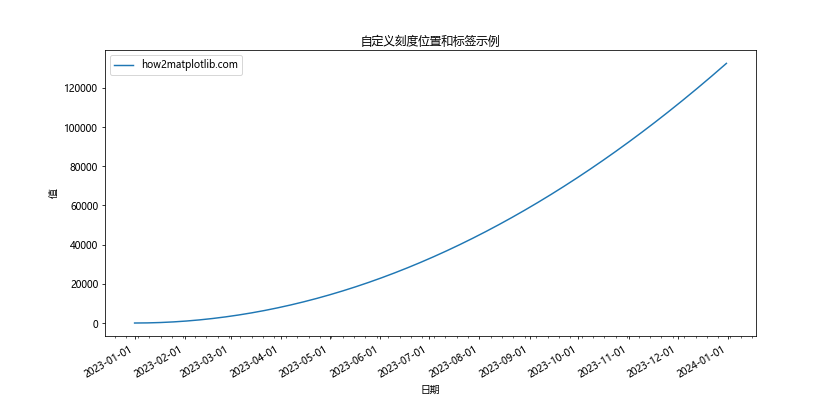
在这个示例中,我们使用MonthLocator()将主刻度设置为每月的第一天,使用WeekdayLocator()将次刻度设置为每周。这样可以得到一个更加精细的日期轴。
7. 处理跨时区数据
在处理跨时区的数据时,axis_date()函数也能派上用场。下面是一个处理跨时区数据的示例:
import matplotlib.pyplot as plt
import matplotlib.dates as mdates
import datetime
import pytz

# 创建跨时区的数据
utc_dates = [datetime.datetime(2023, 1, 1, tzinfo=pytz.UTC) + datetime.timedelta(hours=i) for i in range(24)]
values = [i**2 for i in range(24)]

# 转换为本地时间
local_tz = pytz.timezone('Asia/Shanghai')
local_dates = [date.astimezone(local_tz) for date in utc_dates]

fig, ax = plt.subplots(figsize=(12, 6))
ax.plot(local_dates, values, label='how2matplotlib.com')

ax.xaxis.axis_date(tz=local_tz)
ax.xaxis.set_major_formatter(mdates.DateFormatter('%Y-%m-%d %H:%M %Z'))

ax.set_title('跨时区数据示例')
ax.set_xlabel('本地时间')
ax.set_ylabel('值')
ax.legend()

fig.autofmt_xdate()
plt.show()
Output:
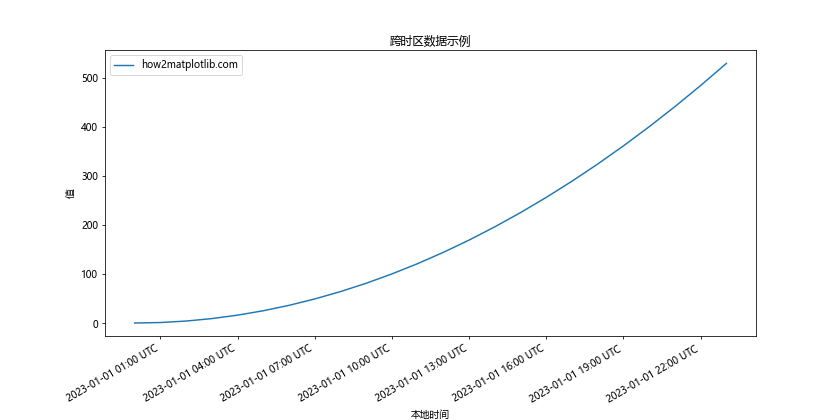
在这个示例中,我们首先创建了UTC时间的数据,然后将其转换为本地时间(这里以上海时区为例)。使用axis_date()函数时,我们指定了本地时区,这样日期轴就会正确显示本地时间。
8. 结合其他Matplotlib功能
axis_date()函数可以很好地与Matplotlib的其他功能结合使用,比如子图、双轴图等。下面是一些示例:
8.1 使用子图
import matplotlib.pyplot as plt
import matplotlib.dates as mdates
import datetime

# 创建示例数据
dates = [datetime.datetime(2023, 1, 1) + datetime.timedelta(days=i) for i in range(365)]
values1 = [i**2 for i in range(365)]
values2 = [i**3 for i in range(365)]

fig, (ax1, ax2) = plt.subplots(2, 1, figsize=(12, 10), sharex=True)

ax1.plot(dates, values1, label='how2matplotlib.com - 1')
ax2.plot(dates, values2, label='how2matplotlib.com - 2')

for ax in (ax1, ax2):
    ax.xaxis.axis_date()
    ax.legend()

ax2.xaxis.set_major_formatter(mdates.DateFormatter('%Y-%m-%d'))ax1.set_title('子图示例')
ax2.set_xlabel('日期')
ax1.set_ylabel('值 1')
ax2.set_ylabel('值 2')

fig.autofmt_xdate()
plt.tight_layout()
plt.show()
这个示例展示了如何在子图中使用axis_date()函数。
8.2 创建双轴图
import matplotlib.pyplot as plt
import matplotlib.dates as mdates
import datetime

# 创建示例数据
dates = [datetime.datetime(2023, 1, 1) + datetime.timedelta(days=i) for i in range(365)]
values1 = [i**2 for i in range(365)]
values2 = [100 * (1 + i/365) for i in range(365)]

fig, ax1 = plt.subplots(figsize=(12, 6))

ax1.plot(dates, values1, 'b-', label='how2matplotlib.com - 左轴')
ax1.set_xlabel('日期')
ax1.set_ylabel('值 1', color='b')
ax1.tick_params(axis='y', labelcolor='b')

ax2 = ax1.twinx()
ax2.plot(dates, values2, 'r-', label='how2matplotlib.com - 右轴')
ax2.set_ylabel('值 2', color='r')
ax2.tick_params(axis='y', labelcolor='r')

ax1.xaxis.axis_date()
ax1.xaxis.set_major_formatter(mdates.DateFormatter('%Y-%m-%d'))

ax1.set_title('双轴图示例')

fig.legend(loc='upper right', bbox_to_anchor=(1, 1), bbox_transform=ax1.transAxes)

fig.autofmt_xdate()
plt.tight_layout()
plt.show()
Output:
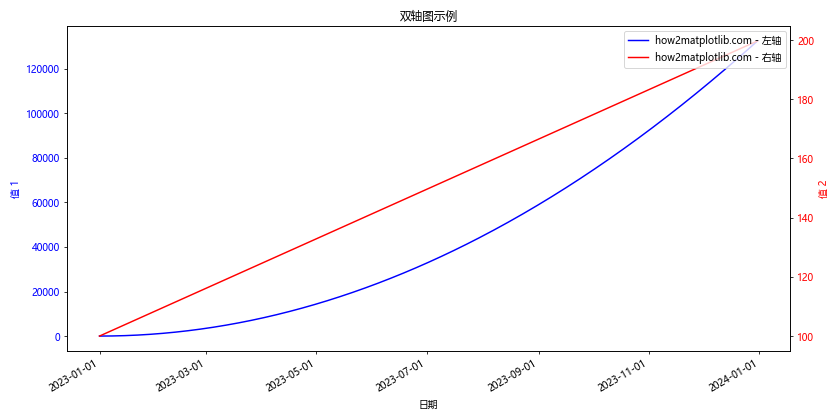
这个示例展示了如何在双轴图中使用axis_date()函数。
9. 处理大量数据点
当处理大量数据点时,axis_date()函数仍然能够很好地工作,但我们可能需要采取一些额外的措施来优化图表的显示效果。以下是一个处理大量数据点的示例:
import matplotlib.pyplot as plt
import matplotlib.dates as mdates
import datetime
import numpy as np

# 创建大量数据点
num_points = 100000
start_date = datetime.datetime(2023, 1, 1)
dates = [start_date + datetime.timedelta(minutes=i) for i in range(num_points)]
values = np.cumsum(np.random.randn(num_points))

fig, ax = plt.subplots(figsize=(12, 6))

# 使用plot_date而不是plot来提高性能
ax.plot_date(dates, values, '-', label='how2matplotlib.com')

ax.xaxis.axis_date()

# 设置合适的刻度间隔
ax.xaxis.set_major_locator(mdates.DayLocator())
ax.xaxis.set_major_formatter(mdates.DateFormatter('%Y-%m-%d'))

ax.set_title(f'处理{num_points}个数据点的示例')
ax.set_xlabel('日期')
ax.set_ylabel('值')
ax.legend()

fig.autofmt_xdate()
plt.tight_layout()
plt.show()
Output:
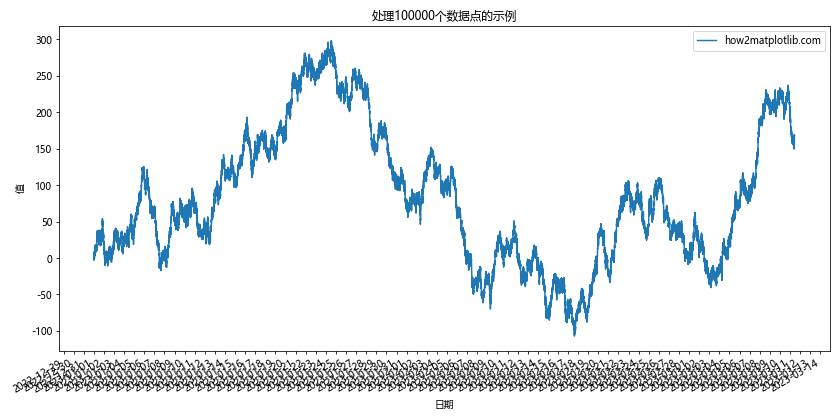
在这个示例中,我们使用了plot_date()函数来提高绘图性能,并使用DayLocator()来设置合适的刻度间隔,避免x轴标签过于拥挤。
10. 结合时间序列分析
axis_date()函数在时间序列分析中也非常有用。下面是一个结合简单移动平均线的示例:
import matplotlib.pyplot as plt
import matplotlib.dates as mdates
import datetime
import numpy as np
import pandas as pd

# 创建示例数据
dates = [datetime.datetime(2023, 1, 1) + datetime.timedelta(days=i) for i in range(365)]
values = np.cumsum(np.random.randn(365))

# 计算30天移动平均线
df = pd.DataFrame({'date': dates, 'value': values})
df['MA30'] = df['value'].rolling(window=30).mean()

fig, ax = plt.subplots(figsize=(12, 6))

ax.plot(df['date'], df['value'], label='how2matplotlib.com - 原始数据')
ax.plot(df['date'], df['MA30'], label='how2matplotlib.com - 30天移动平均线')

ax.xaxis.axis_date()
ax.xaxis.set_major_formatter(mdates.DateFormatter('%Y-%m-%d'))

ax.set_title('时间序列分析示例')
ax.set_xlabel('日期')
ax.set_ylabel('值')
ax.legend()

fig.autofmt_xdate()
plt.tight_layout()
plt.show()
Output:
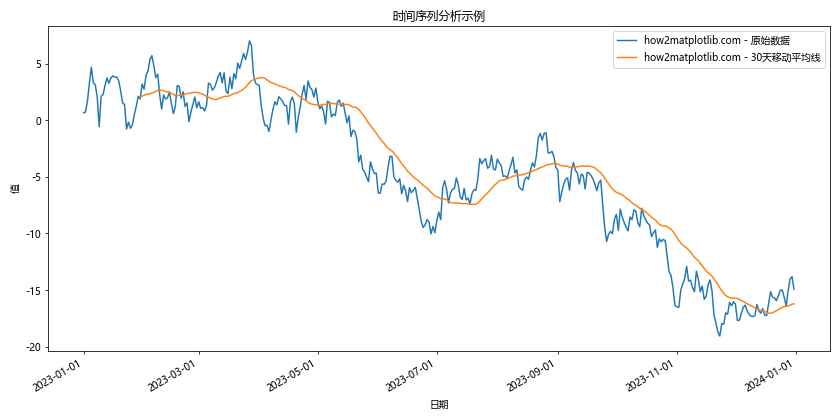
这个示例展示了如何结合axis_date()函数和简单的时间序列分析技术(这里是30天移动平均线)来创建更有洞察力的图表。
11. 自定义日期范围
有时候,我们可能只想显示数据的一部分,或者想要更精确地控制x轴的范围。axis_date()函数可以很好地配合set_xlim()函数使用来实现这一目的。下面是一个示例:
import matplotlib.pyplot as plt
import matplotlib.dates as mdates
import datetime

# 创建示例数据
dates = [datetime.datetime(2023, 1, 1) + datetime.timedelta(days=i) for i in range(365)]
values = [i**2 for i in range(365)]

fig, ax = plt.subplots(figsize=(12, 6))

ax.plot(dates, values, label='how2matplotlib.com')

ax.xaxis.axis_date()
ax.xaxis.set_major_formatter(mdates.DateFormatter('%Y-%m-%d'))

# 设置x轴范围
start_date = datetime.datetime(2023, 3, 1)
end_date = datetime.datetime(2023, 6, 30)
ax.set_xlim(start_date, end_date)

ax.set_title('自定义日期范围示例')
ax.set_xlabel('日期')
ax.set_ylabel('值')
ax.legend()

fig.autofmt_xdate()
plt.tight_layout()
plt.show()
Output:
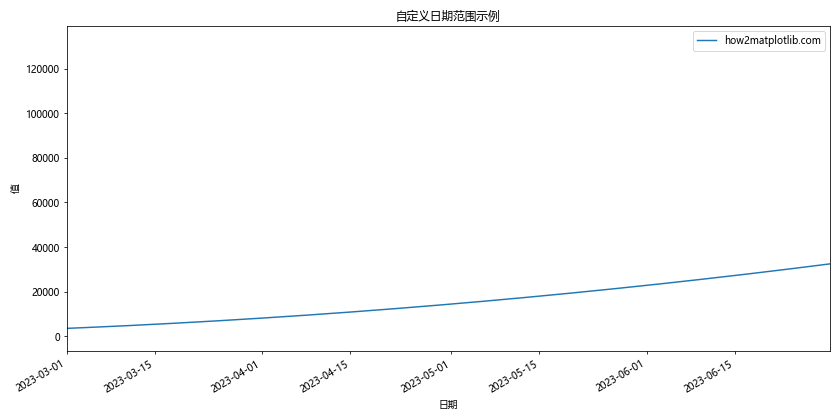
在这个示例中,我们使用set_xlim()函数将x轴的范围限制在2023年3月1日到2023年6月30日之间,即使原始数据包含整年的数据。
12. 处理缺失数据
在实际应用中,我们经常会遇到包含缺失值的时间序列数据。axis_date()函数可以很好地处理这种情况。下面是一个处理缺失数据的示例:
import matplotlib.pyplot as plt
import matplotlib.dates as mdates
import datetime
import numpy as np
import pandas as pd

# 创建包含缺失值的示例数据
dates = [datetime.datetime(2023, 1, 1) + datetime.timedelta(days=i) for i in range(365)]
values = np.random.randn(365)
values[50:100] = np.nan  # 创建一段缺失数据

# 创建DataFrame并删除包含NaN的行
df = pd.DataFrame({'date': dates, 'value': values})
df_clean = df.dropna()

fig, ax = plt.subplots(figsize=(12, 6))

ax.plot(df_clean['date'], df_clean['value'], label='how2matplotlib.com')

ax.xaxis.axis_date()
ax.xaxis.set_major_formatter(mdates.DateFormatter('%Y-%m-%d'))

ax.set_title('处理缺失数据示例')
ax.set_xlabel('日期')
ax.set_ylabel('值')
ax.legend()

fig.autofmt_xdate()
plt.tight_layout()
plt.show()
Output:
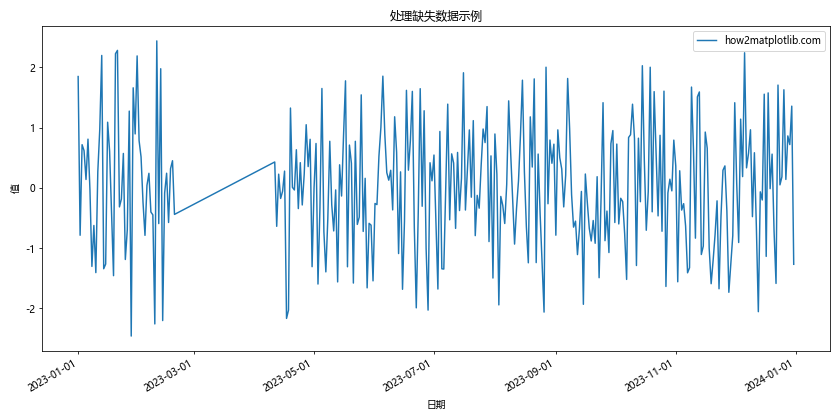
在这个示例中,我们创建了一个包含缺失值的时间序列数据,然后使用pandas的dropna()函数删除包含NaN的行。axis_date()函数能够正确处理这种不连续的时间序列数据。
总结
axis_date()函数是Matplotlib库中处理时间序列数据的强大工具。它能够自动将坐标轴设置为日期时间格式,大大简化了时间序列数据的可视化过程。通过本文的详细介绍和丰富的示例,我们了解了axis_date()函数的基本用法、参数设置、与其他Matplotlib功能的结合使用,以及在各种实际场景中的应用。
无论是处理规则或不规则的时间间隔、跨时区数据、大量数据点,还是进行时间序列分析,axis_date()函数都能提供良好的支持。结合DateFormatter、Locator等其他工具,我们可以更精细地控制日期轴的显示效果,创建出既美观又信息丰富的时间序列图表。
在实际应用中,根据具体的数据特征和可视化需求,灵活运用axis_date()函数及其相关功能,将帮助我们更好地展示和分析时间序列数据,从而得出有价值的洞察。
 极客笔记
极客笔记