Matplotlib中使用axis.Axis.add_callback()方法实现动态图表更新
参考:Matplotlib.axis.Axis.add_callback() in Python
Matplotlib是Python中最流行的数据可视化库之一,它提供了丰富的绘图功能和灵活的自定义选项。在Matplotlib中,axis.Axis.add_callback()方法是一个强大的工具,可以帮助我们实现图表的动态更新和交互式功能。本文将深入探讨这个方法的使用,并通过多个示例来展示其在实际应用中的潜力。
1. axis.Axis.add_callback()方法简介
axis.Axis.add_callback()方法属于Matplotlib库中的Axis类,它允许我们为坐标轴添加回调函数。这些回调函数会在坐标轴的属性发生变化时被自动调用,使得我们可以动态地更新图表或执行其他操作。
1.1 方法语法
Axis.add_callback(func)
其中,func是一个回调函数,它接受一个参数(通常命名为ax),代表发生变化的坐标轴对象。
1.2 基本用法示例
让我们从一个简单的例子开始,了解add_callback()方法的基本用法:
import matplotlib.pyplot as plt

def on_xlim_change(ax):
    print("X轴范围已更改 - how2matplotlib.com")

fig, ax = plt.subplots()
ax.plot([1, 2, 3, 4], [1, 4, 2, 3])
ax.xaxis.add_callback(on_xlim_change)

plt.show()
Output:
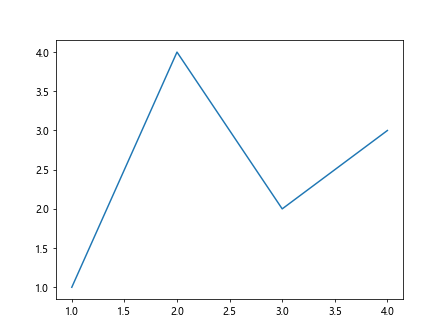
在这个例子中,我们定义了一个回调函数on_xlim_change,并将其添加到X轴上。每当X轴的范围发生变化时(例如,用户进行缩放操作),这个函数就会被调用,并打印一条消息。
2. 回调函数的应用场景
add_callback()方法的强大之处在于它可以用于各种动态更新和交互式场景。以下是一些常见的应用场景:
2.1 动态更新标签
我们可以使用回调函数来动态更新坐标轴的标签,以反映当前的数据范围:
import matplotlib.pyplot as plt

def update_xlabel(ax):
    xmin, xmax = ax.get_xlim()
    ax.set_xlabel(f"X范围: {xmin:.2f} - {xmax:.2f} - how2matplotlib.com")
    ax.figure.canvas.draw_idle()

fig, ax = plt.subplots()
ax.plot([1, 2, 3, 4], [1, 4, 2, 3])
ax.xaxis.add_callback(update_xlabel)

plt.show()
Output:
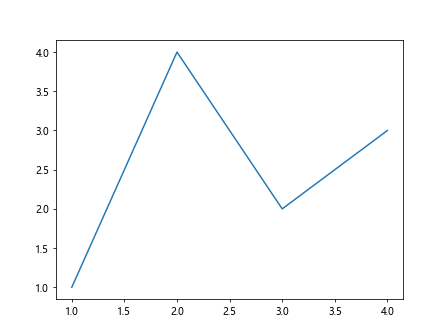
在这个例子中,update_xlabel函数会在X轴范围变化时更新X轴的标签,显示当前的数值范围。
2.2 同步多个子图
add_callback()方法也可以用于同步多个子图的坐标轴范围:
import matplotlib.pyplot as plt

def sync_axes(ax):
    for other_ax in ax.figure.axes:
        if other_ax != ax:
            other_ax.set_xlim(ax.get_xlim())
            other_ax.set_ylim(ax.get_ylim())
    ax.figure.canvas.draw_idle()

fig, (ax1, ax2) = plt.subplots(1, 2)
ax1.plot([1, 2, 3, 4], [1, 4, 2, 3], label="how2matplotlib.com")
ax2.plot([1, 2, 3, 4], [3, 1, 4, 2], label="how2matplotlib.com")

ax1.xaxis.add_callback(sync_axes)
ax1.yaxis.add_callback(sync_axes)
ax2.xaxis.add_callback(sync_axes)
ax2.yaxis.add_callback(sync_axes)

plt.show()
Output:
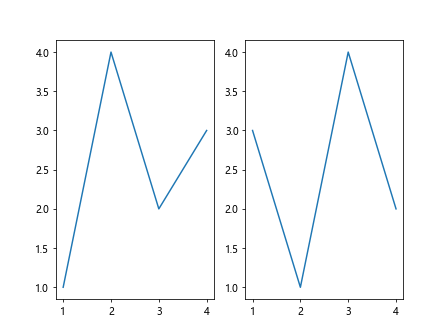
这个例子中,我们为两个子图的X轴和Y轴都添加了回调函数,确保它们的范围始终保持同步。
3. 高级应用:实时数据可视化
add_callback()方法在实时数据可视化中特别有用。我们可以使用它来创建动态更新的图表,以显示不断变化的数据。
3.1 实时更新折线图
以下是一个实时更新折线图的示例:
import matplotlib.pyplot as plt
import numpy as np
from matplotlib.animation import FuncAnimation

class RealtimePlot:
    def __init__(self):
        self.fig, self.ax = plt.subplots()
        self.line, = self.ax.plot([], [], label="how2matplotlib.com")
        self.ax.set_xlim(0, 100)
        self.ax.set_ylim(-1, 1)
        self.xdata, self.ydata = [], []

    def update_plot(self, frame):
        self.xdata.append(frame)
        self.ydata.append(np.sin(frame * 0.1))
        self.line.set_data(self.xdata, self.ydata)
        return self.line,

    def on_xlim_change(self, ax):
        xmin, xmax = ax.get_xlim()
        if xmax > len(self.xdata):
            self.ax.set_xlim(xmax - 100, xmax)
        self.fig.canvas.draw_idle()

    def run(self):
        self.ax.xaxis.add_callback(self.on_xlim_change)
        ani = FuncAnimation(self.fig, self.update_plot, frames=range(1000),
                            interval=50, blit=True)
        plt.show()

RealtimePlot().run()
Output:

在这个例子中,我们创建了一个RealtimePlot类来管理实时更新的折线图。update_plot方法负责添加新的数据点,而on_xlim_change回调函数则确保图表始终显示最新的100个数据点。
4. 自定义回调函数
我们可以根据具体需求自定义回调函数,以实现各种复杂的交互式功能。
4.1 根据缩放级别调整标记大小
以下示例展示了如何根据缩放级别动态调整散点图中标记的大小:
import matplotlib.pyplot as plt
import numpy as np

def adjust_marker_size(ax):
    xmin, xmax = ax.get_xlim()
    ymin, ymax = ax.get_ylim()
    area = (xmax - xmin) * (ymax - ymin)
    new_size = max(10, 1000 / area)
    for artist in ax.collections:
        artist.set_sizes([new_size])
    ax.figure.canvas.draw_idle()

fig, ax = plt.subplots()
x = np.random.rand(50)
y = np.random.rand(50)
scatter = ax.scatter(x, y, s=100, label="how2matplotlib.com")

ax.xaxis.add_callback(adjust_marker_size)
ax.yaxis.add_callback(adjust_marker_size)

plt.show()
Output:
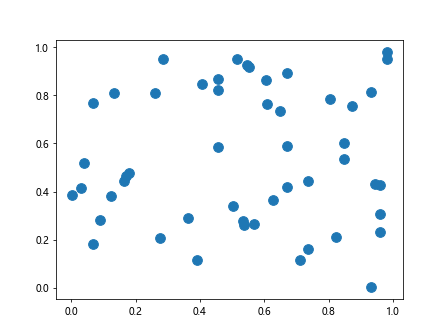
在这个例子中,adjust_marker_size函数会根据当前可见区域的面积来调整散点的大小,确保它们在不同缩放级别下都能保持合适的视觉效果。
4.2 动态调整刻度密度
我们还可以使用回调函数来动态调整坐标轴的刻度密度:
import matplotlib.pyplot as plt
import numpy as np

def adjust_tick_density(ax):
    xmin, xmax = ax.get_xlim()
    range_size = xmax - xmin
    if range_size <= 10:
        ax.xaxis.set_major_locator(plt.MultipleLocator(1))
    elif range_size <= 50:
        ax.xaxis.set_major_locator(plt.MultipleLocator(5))
    else:
        ax.xaxis.set_major_locator(plt.MultipleLocator(10))
    ax.figure.canvas.draw_idle()

fig, ax = plt.subplots()
x = np.linspace(0, 100, 1000)
y = np.sin(x * 0.1)
ax.plot(x, y, label="how2matplotlib.com")

ax.xaxis.add_callback(adjust_tick_density)

plt.show()
Output:
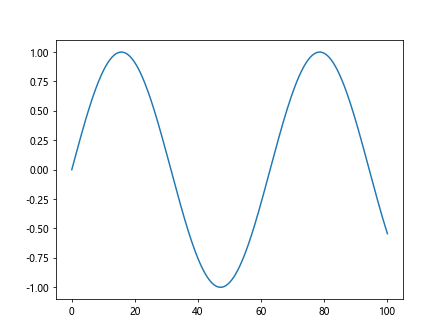
这个例子中的adjust_tick_density函数会根据X轴的当前范围来调整刻度的间隔,确保在不同缩放级别下都能显示适当数量的刻度。
5. 处理多个回调函数
在某些情况下,我们可能需要为同一个坐标轴添加多个回调函数。Matplotlib允许我们这样做,并且会按照添加的顺序依次调用这些函数。
5.1 添加多个回调函数
以下是一个添加多个回调函数的示例:
import matplotlib.pyplot as plt

def update_xlabel(ax):
    xmin, xmax = ax.get_xlim()
    ax.set_xlabel(f"X范围: {xmin:.2f} - {xmax:.2f} - how2matplotlib.com")

def update_title(ax):
    ymin, ymax = ax.get_ylim()
    ax.set_title(f"Y范围: {ymin:.2f} - {ymax:.2f}")

def redraw(ax):
    ax.figure.canvas.draw_idle()

fig, ax = plt.subplots()
ax.plot([1, 2, 3, 4], [1, 4, 2, 3])

ax.xaxis.add_callback(update_xlabel)
ax.yaxis.add_callback(update_title)
ax.xaxis.add_callback(redraw)
ax.yaxis.add_callback(redraw)

plt.show()
Output:
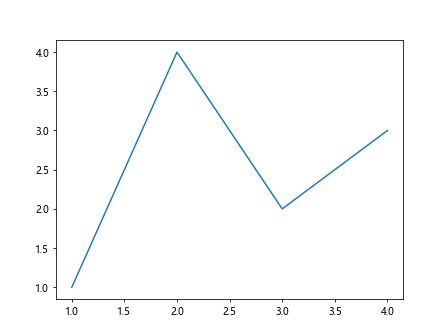
在这个例子中,我们为X轴和Y轴分别添加了多个回调函数。update_xlabel和update_title函数负责更新标签和标题,而redraw函数确保这些更改能够立即显示出来。
5.2 移除回调函数
如果我们不再需要某个回调函数,可以使用remove_callback()方法将其移除:
import matplotlib.pyplot as plt

def callback1(ax):
    print("回调函数1被调用 - how2matplotlib.com")

def callback2(ax):
    print("回调函数2被调用 - how2matplotlib.com")

fig, ax = plt.subplots()
ax.plot([1, 2, 3, 4], [1, 4, 2, 3])

cid1 = ax.xaxis.add_callback(callback1)
cid2 = ax.xaxis.add_callback(callback2)

# 移除第一个回调函数
ax.xaxis.remove_callback(cid1)

plt.show()
Output:
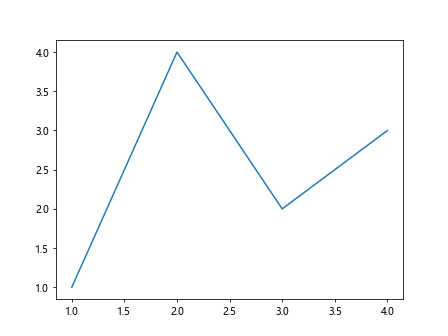
在这个例子中,我们首先添加了两个回调函数,然后使用remove_callback()方法移除了第一个回调函数。
6. 性能考虑
虽然add_callback()方法非常强大,但在使用时也需要注意性能问题,特别是在处理大量数据或频繁更新的情况下。
6.1 优化回调函数
为了提高性能,我们应该尽量简化回调函数的逻辑,避免在其中进行耗时的操作。例如:
import matplotlib.pyplot as plt
import time

def slow_callback(ax):
    time.sleep(1)  # 模拟耗时操作
    print("慢速回调完成 - how2matplotlib.com")

def fast_callback(ax):
    print("快速回调完成 - how2matplotlib.com")

fig, ax = plt.subplots()
ax.plot([1, 2, 3, 4], [1, 4, 2, 3])

# 不推荐使用慢速回调
# ax.xaxis.add_callback(slow_callback)

# 推荐使用快速回调
ax.xaxis.add_callback(fast_callback)

plt.show()
Output:
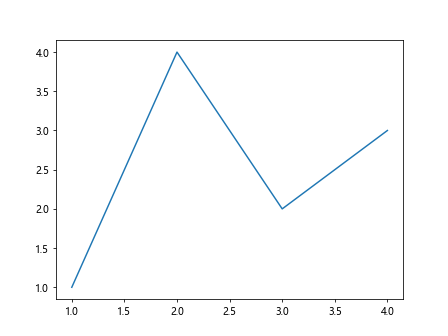
在这个例子中,我们展示了一个耗时的回调函数(slow_callback)和一个快速的回调函数(fast_callback)。在实际应用中,应该尽量避免使用类似slow_callback这样的耗时函数。
6.2 使用防抖动技术
当处理频繁触发的事件时,可以使用防抖动(debounce)技术来减少回调函数的调用次数:
import matplotlib.pyplot as plt
from functools import wraps
import time

def debounce(wait):
    def decorator(fn):
        last_called = [0]
        @wraps(fn)
        def debounced(*args, **kwargs):
            now = time.time()
            if now - last_called[0] >= wait:
                last_called[0] = now
                return fn(*args, **kwargs)
        return debounced
    return decorator

@debounce(0.5)
def update_label(ax):
    xmin, xmax = ax.get_xlim()
    ax.set_xlabel(f"X范围: {xmin:.2f} - {xmax:.2f} - how2matplotlib.com")
    ax.figure.canvas.draw_idle()

fig, ax = plt.subplots()
ax.plot([1, 2, 3, 4], [1, 4, 2, 3])
ax.xaxis.add_callback(update_label)

plt.show()
Output:
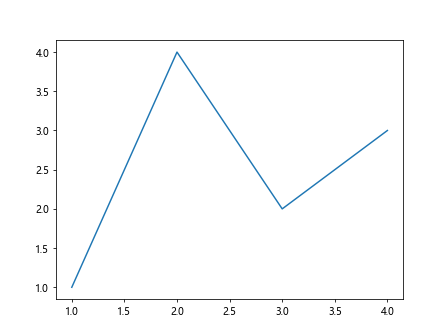
在这个例子中,我们使用了一个debounce装饰器来限制update_label函数的调用频率。这样可以避免在快速缩放或平移图表时过于频繁地更新标签。
7. 与其他Matplotlib功能的结合
add_callback()方法可以与Matplotlib的其他功能结合使用,以创建更复杂和交互式的可视化效果。
7.1 结合鼠标事件
我们可以将add_callback()方法与鼠标事件结合使用,以实现更丰富的交互功能:
import matplotlib.pyplot as plt
import numpy as np

def on_mouse_move(event):
    if event.inaxes:
        x, y = event.xdata, event.ydata
        event.inaxes.set_title(f"鼠标位置: ({x:.2f}, {y:.2f}) - how2matplotlib.com")
        event.inaxes.figure.canvas.draw_idle()

def on_xlim_change(ax):
    xmin, xmax = ax.get_xlim()
    ax.set_xlabel(f"X范围: {xmin:.2f} - {xmax:.2f}")
    ax.figure.canvas.draw_idle()

fig, ax = plt.subplots()
x = np.linspace(0, 10, 100)
y = np.sin(x)
ax.plot(x, y)

ax.xaxis.add_callback(on_xlim_change)
fig.canvas.mpl_connect('motion_notify_event', on_mouse_move)

plt.show()
Output:
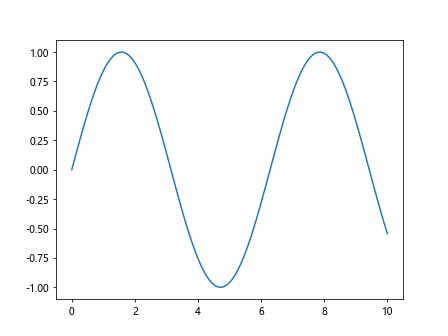
在这个例子中,我们结合使用了add_callback()方法和鼠标移动事件。当X轴范围变化时,on_xlim_change函数会更新X轴标签;当鼠标在图表上移动时,on_mouse_move函数会更新标题以显示当前鼠标位置。
7.2 与动画功能结合
add_callback()方法也可以与Matplotlib的动画功能结合使用,创建动态更新的图表:
import matplotlib.pyplot as plt
import numpy as np
from matplotlib.animation import FuncAnimation

class AnimatedPlot:
    def __init__(self):
        self.fig, self.ax = plt.subplots()
        self.x = np.linspace(0, 10, 100)
        self.line, = self.ax.plot(self.x, np.sin(self.x))
        self.ax.set_xlim(0, 10)
        self.ax.set_ylim(-1.5, 1.5)

    def update(self, frame):
        y = np.sin(self.x + frame / 10)
        self.line.set_ydata(y)
        return self.line,

    def on_ylim_change(self, ax):
        ymin, ymax = ax.get_ylim()
        ax.set_title(f"Y范围: {ymin:.2f} - {ymax:.2f} - how2matplotlib.com")
        ax.figure.canvas.draw_idle()

    def run(self):
        self.ax.yaxis.add_callback(self.on_ylim_change)
        ani = FuncAnimation(self.fig, self.update, frames=range(100),
                            interval=50, blit=True)
        plt.show()

AnimatedPlot().run()
Output:

在这个例子中,我们创建了一个动画正弦波,并使用add_callback()方法来动态更新标题,显示当前的Y轴范围。
8. 处理复杂的数据可视化场景
在处理复杂的数据可视化场景时,add_callback()方法可以帮助我们实现更高级的功能。
8.1 动态调整颜色映射
以下是一个根据数据范围动态调整颜色映射的示例:
import matplotlib.pyplot as plt
import numpy as np

def update_colormap(ax):
    images = [obj for obj in ax.get_children() if isinstance(obj, plt.AxesImage)]
    if images:
        img = images[0]
        vmin, vmax = img.get_clim()
        img.set_clim(vmin, vmax)
        ax.set_title(f"数据范围: {vmin:.2f} - {vmax:.2f} - how2matplotlib.com")
        plt.colorbar(img, ax=ax)
    ax.figure.canvas.draw_idle()

fig, ax = plt.subplots()
data = np.random.rand(20, 20)
im = ax.imshow(data, cmap='viridis')

ax.xaxis.add_callback(update_colormap)
ax.yaxis.add_callback(update_colormap)

plt.show()
Output:
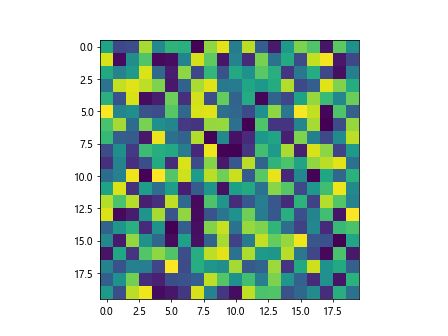
在这个例子中,update_colormap函数会在图表缩放时重新调整颜色映射的范围,并更新标题和颜色条。
8.2 自适应网格线
我们可以使用回调函数来实现自适应的网格线,根据当前视图自动调整网格密度:
import matplotlib.pyplot as plt
import numpy as np

def adjust_grid(ax):
    xmin, xmax = ax.get_xlim()
    ymin, ymax = ax.get_ylim()

    x_range = xmax - xmin
    y_range = ymax - ymin

    if x_range <= 5:
        ax.xaxis.set_major_locator(plt.MultipleLocator(0.5))
    elif x_range <= 20:
        ax.xaxis.set_major_locator(plt.MultipleLocator(2))
    else:
        ax.xaxis.set_major_locator(plt.MultipleLocator(5))

    if y_range <= 5:
        ax.yaxis.set_major_locator(plt.MultipleLocator(0.5))
    elif y_range <= 20:
        ax.yaxis.set_major_locator(plt.MultipleLocator(2))
    else:
        ax.yaxis.set_major_locator(plt.MultipleLocator(5))

    ax.grid(True)
    ax.set_title(f"网格已调整 - how2matplotlib.com")
    ax.figure.canvas.draw_idle()

fig, ax = plt.subplots()
x = np.linspace(0, 30, 300)
y = np.sin(x) * x
ax.plot(x, y)

ax.xaxis.add_callback(adjust_grid)
ax.yaxis.add_callback(adjust_grid)

plt.show()
Output:
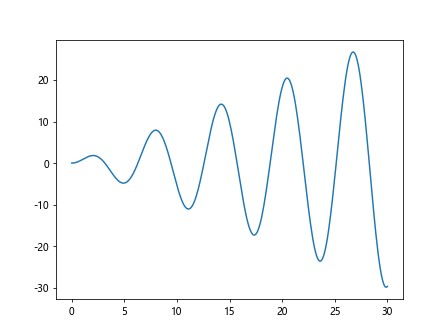
这个例子中的adjust_grid函数会根据当前X轴和Y轴的范围来调整网格线的密度,使得网格在不同缩放级别下都能保持合适的视觉效果。
9. 错误处理和调试
在使用add_callback()方法时,适当的错误处理和调试技巧可以帮助我们更好地管理回调函数。
9.1 异常处理
为了防止回调函数中的错误影响整个程序的运行,我们可以在回调函数中添加异常处理:
import matplotlib.pyplot as plt
import numpy as np

def safe_callback(ax):
    try:
        xmin, xmax = ax.get_xlim()
        ax.set_title(f"X范围: {xmin:.2f} - {xmax:.2f} - how2matplotlib.com")
        # 模拟可能出现的错误
        if xmax - xmin < 1:
            raise ValueError("X轴范围太小")
    except Exception as e:
        print(f"回调函数出错: {e}")
    finally:
        ax.figure.canvas.draw_idle()

fig, ax = plt.subplots()
x = np.linspace(0, 10, 100)
y = np.sin(x)
ax.plot(x, y)

ax.xaxis.add_callback(safe_callback)

plt.show()
Output:
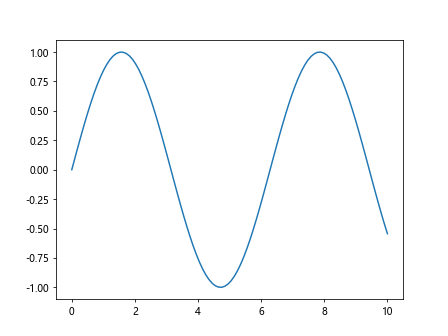
在这个例子中,我们在回调函数中添加了异常处理,以捕获并打印可能出现的错误,而不会导致程序崩溃。
9.2 调试技巧
为了更好地调试回调函数,我们可以添加日志记录:
import matplotlib.pyplot as plt
import numpy as np
import logging

logging.basicConfig(level=logging.DEBUG)
logger = logging.getLogger(__name__)

def debug_callback(ax):
    logger.debug("回调函数被调用")
    xmin, xmax = ax.get_xlim()
    logger.info(f"X轴范围: {xmin:.2f} - {xmax:.2f}")
    ax.set_title(f"X范围: {xmin:.2f} - {xmax:.2f} - how2matplotlib.com")
    ax.figure.canvas.draw_idle()

fig, ax = plt.subplots()
x = np.linspace(0, 10, 100)
y = np.sin(x)
ax.plot(x, y)

ax.xaxis.add_callback(debug_callback)

plt.show()
这个例子中,我们使用Python的logging模块来记录回调函数的调用情况和相关信息,这有助于我们在复杂的应用中跟踪回调函数的行为。
10. 最佳实践和注意事项
在使用axis.Axis.add_callback()方法时,以下是一些最佳实践和需要注意的事项:
- 保持回调函数简洁:回调函数应该尽可能简单和高效,避免在其中进行复杂的计算或耗时的操作。
-
适当使用防抖动:对于可能频繁触发的事件,考虑使用防抖动技术来限制回调函数的调用频率。
-
及时移除不需要的回调:当不再需要某个回调函数时,使用
remove_callback()方法将其移除,以避免不必要的性能开销。 -
注意线程安全:如果在多线程环境中使用回调函数,确保适当处理线程安全问题。
-
合理使用全局状态:尽量避免在回调函数中过度依赖全局状态,这可能导致难以预料的行为。
-
测试不同的交互场景:在开发过程中,测试各种可能的用户交互场景,确保回调函数在所有情况下都能正常工作。
-
考虑性能影响:对于大型或复杂的图表,频繁调用回调函数可能会影响性能。在这种情况下,考虑使用批处理或延迟更新技术。
-
文档和注释:为回调函数添加清晰的文档和注释,说明其目的和行为,这对于维护和协作非常重要。
通过遵循这些最佳实践,我们可以更有效地利用axis.Axis.add_callback()方法,创建出既交互性强又性能良好的数据可视化应用。
结论
Matplotlib的axis.Axis.add_callback()方法是一个强大的工具,能够帮助我们创建动态、交互式的数据可视化。通过本文的详细介绍和多个示例,我们了解了如何使用这个方法来实现各种功能,从简单的标签更新到复杂的实时数据可视化。
我们探讨了该方法的基本用法、高级应用、性能考虑、错误处理等多个方面。通过将add_callback()方法与Matplotlib的其他功能结合,我们可以创建出更加丰富和灵活的可视化效果。
在实际应用中,合理使用回调函数可以大大提升用户体验,使得数据可视化更加生动和有意义。然而,我们也需要注意性能和代码质量,确保回调函数的使用不会对整体应用造成负面影响。
随着数据可视化需求的不断增长和复杂化,掌握axis.Axis.add_callback()方法将使我们能够应对各种挑战,创造出更加出色的可视化作品。无论是科学研究、数据分析还是商业报告,这个方法都能为我们的工作增添新的维度和可能性。
 极客笔记
极客笔记