Matplotlib中使用Artist.set_transform()方法设置坐标变换
参考:Matplotlib.artist.Artist.set_transform() in Python
Matplotlib是Python中最流行的数据可视化库之一,它提供了丰富的绘图功能和灵活的自定义选项。在Matplotlib中,Artist是所有可视化元素的基类,包括线条、文本、图像等。Artist类中的set_transform()方法是一个强大的工具,用于设置和修改图形元素的坐标变换。本文将深入探讨Artist.set_transform()方法的使用,并通过多个示例来展示其在数据可视化中的应用。
1. Artist.set_transform()方法简介
Artist.set_transform()方法用于为Artist对象设置坐标变换。这个方法接受一个Transform对象作为参数,该对象定义了如何将数据坐标映射到显示坐标。通过使用不同的Transform对象,我们可以实现各种坐标变换效果,如平移、旋转、缩放等。
以下是set_transform()方法的基本语法:
import matplotlib.pyplot as plt
import matplotlib.transforms as transforms

fig, ax = plt.subplots()
artist = ax.plot([0, 1], [0, 1], label='how2matplotlib.com')[0]
transform = transforms.Affine2D().translate(1, 1) + ax.transData
artist.set_transform(transform)
plt.show()
Output:
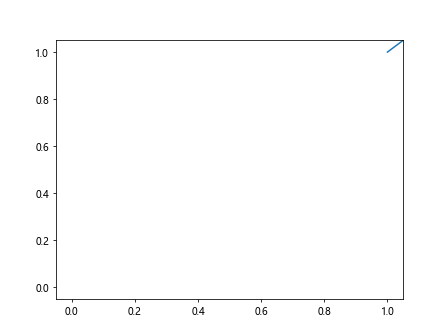
在这个例子中,我们创建了一个简单的线条,然后使用Affine2D变换将其平移1个单位。set_transform()方法将这个变换应用到线条上。
2. 常用的Transform对象
Matplotlib提供了多种Transform对象,用于实现不同类型的坐标变换。以下是一些常用的Transform对象:
2.1 Affine2D
Affine2D是最常用的Transform对象之一,它可以实现平移、旋转、缩放和错切等仿射变换。
import matplotlib.pyplot as plt
import matplotlib.transforms as transforms

fig, ax = plt.subplots()
circle = plt.Circle((0, 0), 0.5, label='how2matplotlib.com')
ax.add_artist(circle)

transform = transforms.Affine2D().rotate_deg(45).scale(2, 1).translate(1, 1)
circle.set_transform(transform + ax.transData)

ax.set_xlim(-2, 4)
ax.set_ylim(-2, 4)
plt.show()
Output:
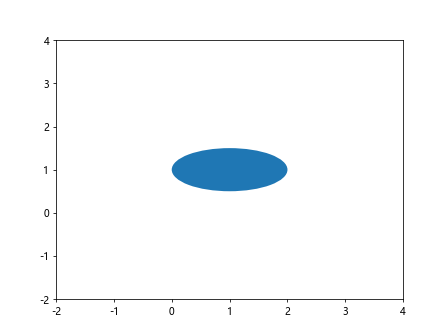
这个例子展示了如何使用Affine2D对一个圆进行旋转、缩放和平移。我们首先创建了一个圆,然后定义了一个复合变换:旋转45度,在x方向缩放2倍,最后平移(1, 1)。
2.2 ScaledTranslation
ScaledTranslation用于实现基于点大小或像素的平移。这在调整文本或注释位置时特别有用。
import matplotlib.pyplot as plt
import matplotlib.transforms as transforms

fig, ax = plt.subplots()
ax.plot([0, 1], [0, 1], 'ro-', label='how2matplotlib.com')

offset = transforms.ScaledTranslation(0.1, 0.1, fig.dpi_scale_trans)
text_transform = ax.transData + offset
ax.text(0.5, 0.5, 'Offset Text', transform=text_transform)

plt.show()
Output:
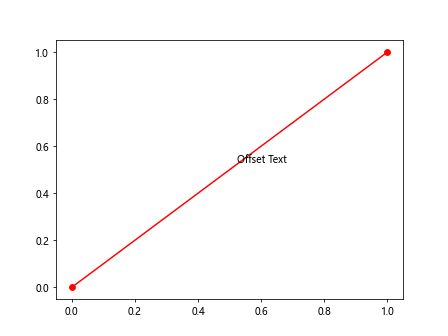
在这个例子中,我们使用ScaledTranslation创建了一个偏移变换,将文本向右上方移动0.1英寸。
2.3 BlendedGenericTransform
BlendedGenericTransform允许我们在x和y方向使用不同的变换。这在创建具有混合坐标系的图表时非常有用。
import matplotlib.pyplot as plt
import matplotlib.transforms as transforms

fig, ax = plt.subplots()
line, = ax.plot([0, 1], [0, 1], label='how2matplotlib.com')

blend = transforms.blended_transform_factory(ax.transData, ax.transAxes)
ax.axhline(y=0.5, transform=blend, color='r', linestyle='--')

plt.show()
这个例子展示了如何使用BlendedGenericTransform创建一条水平线,其x坐标使用数据坐标系,y坐标使用轴坐标系。
3. 坐标系统和变换
在Matplotlib中,有几种不同的坐标系统,理解这些坐标系统对于正确使用set_transform()方法至关重要。
3.1 数据坐标系(Data coordinates)
数据坐标系是最常用的坐标系,它直接对应于我们绘制的数据值。
import matplotlib.pyplot as plt

fig, ax = plt.subplots()
ax.plot([0, 1, 2], [0, 1, 0.5], label='how2matplotlib.com')
ax.set_title('Data Coordinates Example')
plt.show()
Output:
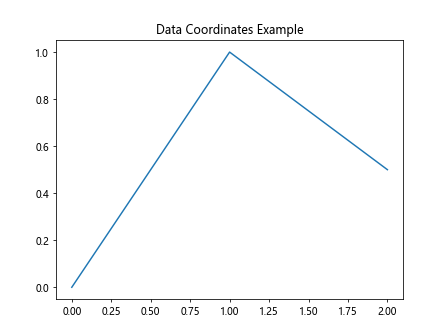
在这个例子中,我们直接使用数据坐标系绘制了一条线。
3.2 轴坐标系(Axes coordinates)
轴坐标系使用0到1的范围表示轴的位置,其中(0, 0)表示左下角,(1, 1)表示右上角。
import matplotlib.pyplot as plt

fig, ax = plt.subplots()
ax.plot([0, 1], [0, 1], transform=ax.transAxes, label='how2matplotlib.com')
ax.set_title('Axes Coordinates Example')
plt.show()
Output:
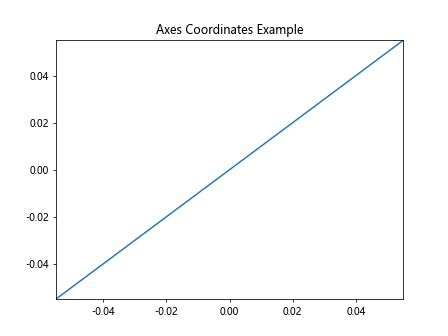
这个例子展示了如何使用轴坐标系绘制一条对角线。
3.3 图形坐标系(Figure coordinates)
图形坐标系类似于轴坐标系,但是相对于整个图形而言。
import matplotlib.pyplot as plt

fig, ax = plt.subplots()
fig.text(0.1, 0.9, 'how2matplotlib.com', transform=fig.transFigure)
ax.set_title('Figure Coordinates Example')
plt.show()
Output:
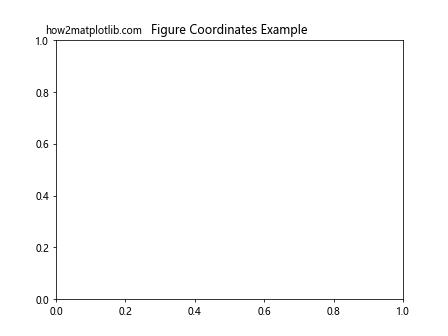
这个例子展示了如何使用图形坐标系在图形的左上角添加文本。
4. 复合变换
复合变换是将多个变换组合在一起的强大工具。我们可以使用+运算符来组合变换。
import matplotlib.pyplot as plt
import matplotlib.transforms as transforms

fig, ax = plt.subplots()
circle = plt.Circle((0, 0), 0.5, label='how2matplotlib.com')
ax.add_artist(circle)

rotate = transforms.Affine2D().rotate_deg(45)
translate = transforms.Affine2D().translate(1, 1)
scale = transforms.Affine2D().scale(2)

transform = rotate + translate + scale + ax.transData
circle.set_transform(transform)

ax.set_xlim(-2, 4)
ax.set_ylim(-2, 4)
plt.show()
Output:
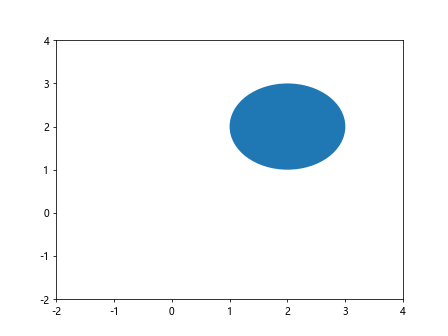
这个例子展示了如何创建一个复合变换,包括旋转、平移和缩放,然后将其应用到一个圆上。
5. 动态变换
set_transform()方法不仅可以用于静态变换,还可以用于创建动态效果。
import matplotlib.pyplot as plt
import matplotlib.transforms as transforms
import numpy as np

fig, ax = plt.subplots()
line, = ax.plot([0, 1], [0, 1], 'ro-', label='how2matplotlib.com')

def animate(i):
    angle = i * 10
    transform = transforms.Affine2D().rotate_deg(angle) + ax.transData
    line.set_transform(transform)
    return line,

ax.set_xlim(-1.5, 1.5)
ax.set_ylim(-1.5, 1.5)

from matplotlib.animation import FuncAnimation
anim = FuncAnimation(fig, animate, frames=36, interval=50, blit=True)
plt.show()
Output:
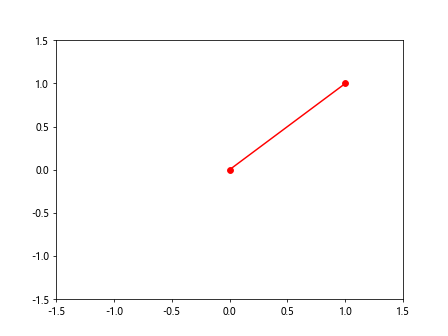
这个例子创建了一个动画,其中一条线围绕原点旋转。每一帧都使用set_transform()方法更新线的变换。
6. 自定义变换
除了使用Matplotlib提供的标准变换,我们还可以创建自定义变换。
import matplotlib.pyplot as plt
import matplotlib.transforms as transforms
import numpy as np

class SineTransform(transforms.Transform):
    input_dims = output_dims = 2

    def __init__(self, amplitude):
        super().__init__()
        self.amplitude = amplitude

    def transform_non_affine(self, values):
        x, y = values
        return x, y + self.amplitude * np.sin(x)

fig, ax = plt.subplots()
x = np.linspace(0, 2*np.pi, 100)
y = np.zeros_like(x)

line, = ax.plot(x, y, label='how2matplotlib.com')
sine_transform = SineTransform(amplitude=0.5)
line.set_transform(sine_transform + ax.transData)

ax.set_xlim(0, 2*np.pi)
ax.set_ylim(-1, 1)
plt.show()
这个例子定义了一个自定义的SineTransform类,它将y坐标变换为正弦波。我们将这个变换应用到一条直线上,使其变成正弦曲线。
7. 在3D图形中使用set_transform()
虽然set_transform()主要用于2D图形,但它在3D图形中也有应用。
import matplotlib.pyplot as plt
import mpl_toolkits.mplot3d as a3d
import matplotlib.transforms as transforms
import numpy as np

fig = plt.figure()
ax = fig.add_subplot(111, projection='3d')

x = np.linspace(-1, 1, 100)
y = np.linspace(-1, 1, 100)
X, Y = np.meshgrid(x, y)
Z = np.sin(np.sqrt(X**2 + Y**2))

surf = ax.plot_surface(X, Y, Z, cmap='viridis', label='how2matplotlib.com')

rotate = transforms.Affine2D().rotate_deg(45)
surf.set_transform(rotate + ax.transData)

plt.show()
Output:
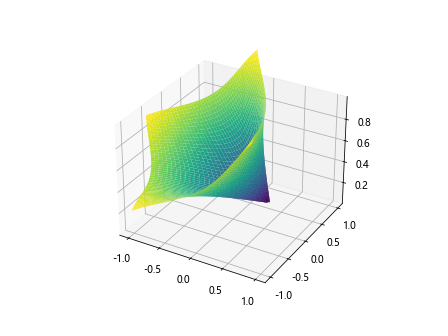
这个例子展示了如何在3D图形中使用set_transform()方法。我们创建了一个3D表面图,然后对其应用了45度的旋转变换。
8. 处理文本和注释
set_transform()方法对于调整文本和注释的位置特别有用。
import matplotlib.pyplot as plt
import matplotlib.transforms as transforms

fig, ax = plt.subplots()
ax.plot([0, 1], [0, 1], 'ro-', label='how2matplotlib.com')

text = ax.text(0.5, 0.5, 'Rotated Text', ha='center', va='center')
rotate = transforms.Affine2D().rotate_deg(45)
text.set_transform(rotate + ax.transData)

plt.show()
Output:
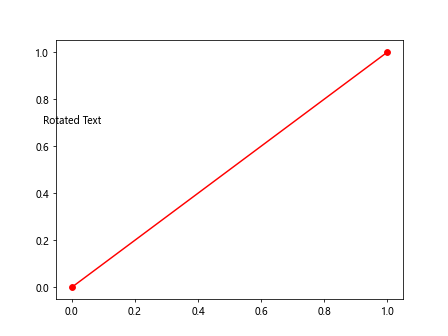
这个例子展示了如何使用set_transform()方法旋转文本。我们创建了一个文本对象,然后应用了45度的旋转变换。
9. 在极坐标系中使用set_transform()
set_transform()方法在极坐标系中也非常有用,可以帮助我们调整极坐标图的元素。
import matplotlib.pyplot as plt
import numpy as np

fig, ax = plt.subplots(subplot_kw=dict(projection='polar'))
theta = np.linspace(0, 2*np.pi, 100)
r = np.ones_like(theta)

line, = ax.plot(theta, r, label='how2matplotlib.com')
scale = ax.transData.scale(1.5, 1.5)
line.set_transform(scale)

plt.show()
这个例子展示了如何在极坐标系中使用set_transform()方法。我们创建了一个圆,然后使用scale变换将其放大1.5倍。
10. 处理图例
set_transform()方法也可以用于调整图例的位置和方向。
import matplotlib.pyplot as plt
import matplotlib.transforms as transforms

fig, ax = plt.subplots()
ax.plot([0, 1], [0, 1], label='Line 1')
ax.plot([0, 1], [1, 0], label='Line 2')

legend = ax.legend(title='how2matplotlib.com')
rotate = transforms.Affine2D().rotate_deg(90)
legend.set_transform(rotate + ax.transAxes)

plt.show()
Output:
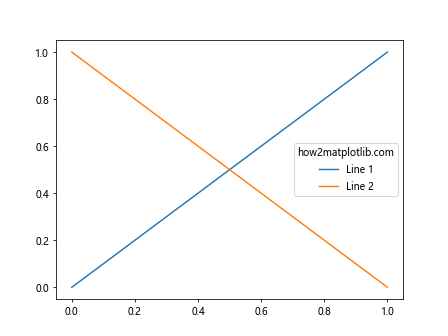
这个例子展示了如何使用set_transform()方法旋转图例。我们创建了两条线和一个图例,然后将图例旋转90度。
11. 在子图中使用set_transform()
当使用子图时,set_transform()方法可以帮助我们调整每个子图中元素的位置和方向。
import matplotlib.pyplot as plt
import matplotlib.transforms as transforms

fig, (ax1, ax2) = plt.subplots(1, 2, figsize=(10, 5))

line1, = ax1.plot([0, 1], [0, 1], label='how2matplotlib.com')
line2, = ax2.plot([0, 1], [0, 1], label='how2matplotlib.com')

rotate1 = transforms.Affine2D().rotate_deg(30)
rotate2 = transforms.Affine2D().rotate_deg(-30)

line1.set_transform(rotate1 + ax1.transData)
line2.set_transform(rotate2 + ax2.transData)

plt.show()
Output:
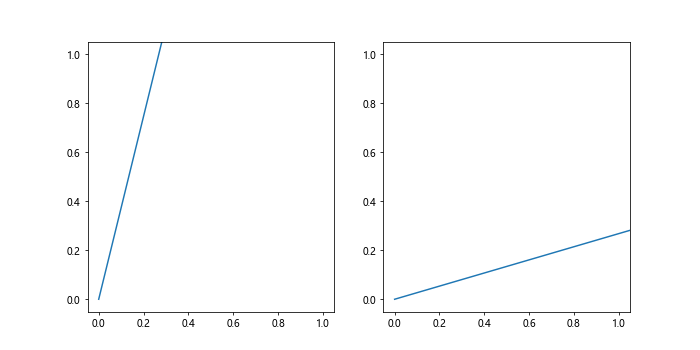
这个例子展示了如何在两个子图中分别使用set_transform()方法。我们在左边的子图中将线旋转30度,在右边的子图中将线旋转-30度。
12. 处理图像
set_transform()方法不仅可以用于线条和文本,还可以用于图像。
import matplotlib.pyplot as plt
import matplotlib.transforms as transforms
import numpy as np

fig, ax = plt.subplots()

# 创建一个简单的图像
image = np.random.rand(10, 10)
im = ax.imshow(image, extent=[0, 1, 0, 1], label='how2matplotlib.com')

# 定义变换
rotate = transforms.Affine2D().rotate_deg(45)
scale = transforms.Affine2D().scale(1.5)
transform = rotate + scale + ax.transData

# 应用变换
im.set_transform(transform)

ax.set_xlim(-1, 2)
ax.set_ylim(-1, 2)
plt.show()
这个例子展示了如何使用set_transform()方法来旋转和缩放图像。我们创建了一个随机的10×10图像,然后应用了45度旋转和1.5倍缩放的复合变换。
13. 在动画中使用set_transform()
set_transform()方法在创建动画时特别有用,可以用来实现各种动态效果。
import matplotlib.pyplot as plt
import matplotlib.transforms as transforms
import numpy as np
from matplotlib.animation import FuncAnimation

fig, ax = plt.subplots()
line, = ax.plot([0, 1], [0, 1], 'ro-', label='how2matplotlib.com')

def animate(frame):
    angle = frame * 10
    scale = 1 + 0.5 * np.sin(frame * 0.1)
    transform = transforms.Affine2D().rotate_deg(angle).scale(scale)
    line.set_transform(transform + ax.transData)
    return line,

ax.set_xlim(-2, 2)
ax.set_ylim(-2, 2)

anim = FuncAnimation(fig, animate, frames=100, interval=50, blit=True)
plt.show()
这个例子创建了一个动画,其中一条线同时进行旋转和缩放。每一帧都使用set_transform()方法更新线的变换。
14. 在极坐标系中创建螺旋
我们可以使用set_transform()方法在极坐标系中创建有趣的效果,比如螺旋。
import matplotlib.pyplot as plt
import matplotlib.transforms as transforms
import numpy as np

fig, ax = plt.subplots(subplot_kw=dict(projection='polar'))
theta = np.linspace(0, 8*np.pi, 1000)
r = np.linspace(0, 1, 1000)

line, = ax.plot(theta, r, label='how2matplotlib.com')

def spiral_transform(theta, r):
    return theta, r * (1 + theta / (8*np.pi))

transform = transforms.FuncTransform(spiral_transform)
line.set_transform(transform + ax.transData)

plt.show()
这个例子展示了如何使用自定义的函数变换创建一个螺旋。我们定义了一个spiral_transform函数,然后将其应用到极坐标图上的线条。
15. 在散点图中使用set_transform()
set_transform()方法也可以应用于散点图,以创建有趣的视觉效果。
import matplotlib.pyplot as plt
import matplotlib.transforms as transforms
import numpy as np

fig, ax = plt.subplots()

# 创建散点数据
n = 100
x = np.random.rand(n)
y = np.random.rand(n)

scatter = ax.scatter(x, y, label='how2matplotlib.com')

# 定义变换
shear = transforms.Affine2D().skew(0.5, 0)
transform = shear + ax.transData

# 应用变换
scatter.set_transform(transform)

ax.set_xlim(0, 1.5)
ax.set_ylim(0, 1)
plt.show()
这个例子展示了如何对散点图应用错切变换。我们创建了一个随机的散点图,然后使用set_transform()方法应用了水平方向的错切变换。
16. 在柱状图中使用set_transform()
set_transform()方法可以用来修改柱状图的形状和方向。
import matplotlib.pyplot as plt
import matplotlib.transforms as transforms
import numpy as np

fig, ax = plt.subplots()

# 创建柱状图数据
x = np.arange(5)
y = np.random.rand(5)

bars = ax.bar(x, y, label='how2matplotlib.com')

# 定义变换
slant = transforms.Affine2D().skew(0.3, 0)

# 应用变换到每个柱子
for bar in bars:
    bar.set_transform(slant + ax.transData)

ax.set_xlim(-1, 5)
ax.set_ylim(0, 1.2)
plt.show()
这个例子展示了如何对柱状图应用倾斜变换。我们创建了一个简单的柱状图,然后使用set_transform()方法对每个柱子应用了水平方向的倾斜变换。
17. 在等高线图中使用set_transform()
set_transform()方法可以用来修改等高线图的形状和方向。
import matplotlib.pyplot as plt
import matplotlib.transforms as transforms
import numpy as np

fig, ax = plt.subplots()

# 创建等高线数据
x = np.linspace(-3, 3, 100)
y = np.linspace(-3, 3, 100)
X, Y = np.meshgrid(x, y)
Z = np.sin(X) * np.cos(Y)

contour = ax.contourf(X, Y, Z, levels=20, cmap='viridis')

# 定义变换
rotate = transforms.Affine2D().rotate_deg(45)
transform = rotate + ax.transData

# 应用变换
for collection in contour.collections:
    collection.set_transform(transform)

ax.set_xlim(-5, 5)
ax.set_ylim(-5, 5)
plt.show()
这个例子展示了如何对等高线图应用旋转变换。我们创建了一个简单的等高线图,然后使用set_transform()方法对整个等高线图应用了45度的旋转变换。
18. 在箱线图中使用set_transform()
set_transform()方法可以用来修改箱线图的形状和方向。
import matplotlib.pyplot as plt
import matplotlib.transforms as transforms
import numpy as np

fig, ax = plt.subplots()

# 创建箱线图数据
data = [np.random.normal(0, std, 100) for std in range(1, 4)]

boxplot = ax.boxplot(data, labels=['A', 'B', 'C'])

# 定义变换
scale = transforms.Affine2D().scale(1, 1.5)
transform = scale + ax.transData

# 应用变换到每个箱子
for element in boxplot['boxes'] + boxplot['whiskers'] + boxplot['caps'] + boxplot['fliers']:
    element.set_transform(transform)

ax.set_ylim(-10, 10)
plt.show()
这个例子展示了如何对箱线图应用垂直方向的缩放变换。我们创建了一个简单的箱线图,然后使用set_transform()方法对箱线图的各个元素应用了垂直方向1.5倍的缩放变换。
19. 在热力图中使用set_transform()
set_transform()方法可以用来修改热力图的形状和方向。
import matplotlib.pyplot as plt
import matplotlib.transforms as transforms
import numpy as np

fig, ax = plt.subplots()

# 创建热力图数据
data = np.random.rand(10, 10)

im = ax.imshow(data, cmap='hot', label='how2matplotlib.com')

# 定义变换
shear = transforms.Affine2D().skew(0.5, 0.2)
transform = shear + ax.transData

# 应用变换
im.set_transform(transform)

ax.set_xlim(-2, 12)
ax.set_ylim(-2, 12)
plt.show()
这个例子展示了如何对热力图应用错切变换。我们创建了一个简单的热力图,然后使用set_transform()方法应用了水平和垂直方向的错切变换。
20. 在3D散点图中使用set_transform()
虽然set_transform()主要用于2D图形,但在某些情况下,它也可以用于3D图形的某些元素。
import matplotlib.pyplot as plt
import mpl_toolkits.mplot3d as a3d
import matplotlib.transforms as transforms
import numpy as np

fig = plt.figure()
ax = fig.add_subplot(111, projection='3d')

# 创建3D散点数据
n = 100
xs = np.random.rand(n)
ys = np.random.rand(n)
zs = np.random.rand(n)

scatter = ax.scatter(xs, ys, zs, c=zs, cmap='viridis', label='how2matplotlib.com')

# 定义2D变换(只影响x和y坐标)
rotate = transforms.Affine2D().rotate_deg(45)
transform = rotate + ax.transData

# 应用变换
scatter.set_transform(transform)

ax.set_xlim(0, 1)
ax.set_ylim(0, 1)
ax.set_zlim(0, 1)
plt.show()
这个例子展示了如何在3D散点图中使用set_transform()方法。我们创建了一个3D散点图,然后应用了一个2D旋转变换,这个变换只影响点的x和y坐标。
总结起来,Artist.set_transform()方法是Matplotlib中一个强大而灵活的工具,它允许我们对图形元素进行各种坐标变换。通过合理使用这个方法,我们可以创建出更加丰富和动态的数据可视化效果。无论是简单的平移旋转,还是复杂的自定义变换,set_transform()都能满足各种需求。在实际应用中,我们需要根据具体的可视化需求,选择合适的变换类型和参数,以达到最佳的展示效果。
 极客笔记
极客笔记